The Growth of the Network Media Economy in Canada, 1984 – 2013
This report by the Canadian Media Concentration Research Project examines a deceptively simple yet difficult to answer question: has the media economy in Canada become bigger or smaller over time?
To do so, it looks at the current state and development trends over a three decade period from 1984 to 2013 for a dozen or so of the largest telecoms, media and internet markets in Canada: i.e. wiredline and wireless telecoms; internet access; cable, satellite & IPTV; pay and specialty TV; conventional TV; radio; newspapers; magazines; music; and internet advertising.
It marshals a long-term and comprehensive body of data to identify which of these markets are thriving, stagnating, declining, or recovering from the recent double-fisted blows of technological disruption and economic uncertainties since 2008. The report throws light on the effects of cord-cutting in the cable industry, and of Netflix on the television market, and policy debates over the state of wireless competition, broadband internet development, among others. It also points to the rise of Google in the past year to becoming the sixth largest player in the network media economy with estimated Canadian revenues of $1.9 billion in 2013, just after Bell, Rogers, Telus, Shaw and Quebecor but ahead of the CBC and the rest of Canada’s major media players (see Leading Media, Internet and Telecoms Companies ranking).
While we cite our sources below, by and large, the following documents and data sets underpin the analysis in this post: Media Industry Data, Media Economy Data and the CMCR Project’s Methodology Primary. This is an annual exercise (see previous versions here and here) and it also kicks off a series of reports that the Canadian Media Concentration Research Project will publish on its website over the next month. A PDF version of this post is available here.
The Network Media Economy in Canada: Growth, Stagnation, Decline or Recovery?
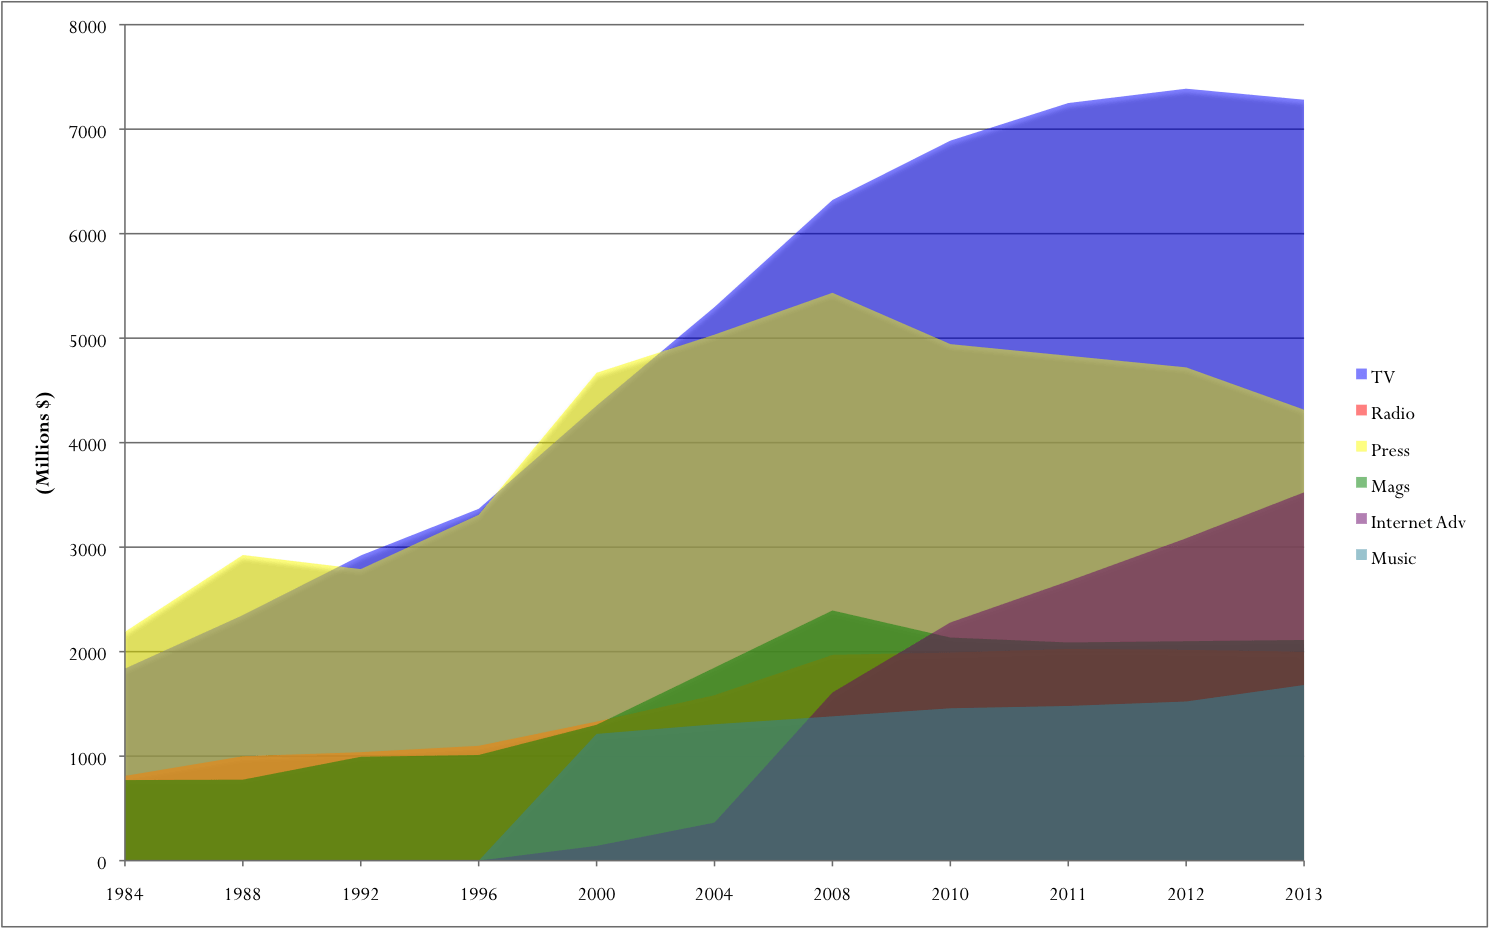
The network media economy in Canada has grown enormously from $19.4 billion in 1984 to $74.8 billion in 2013 (current $), or from $39.4 billion in 1984 to $74.8 billion last year in inflation-adjusted real dollar terms (2013$). Figure 1, below, shows the trends.
Figure 1: Growth of the Network Media Economy, 1984 – 2013
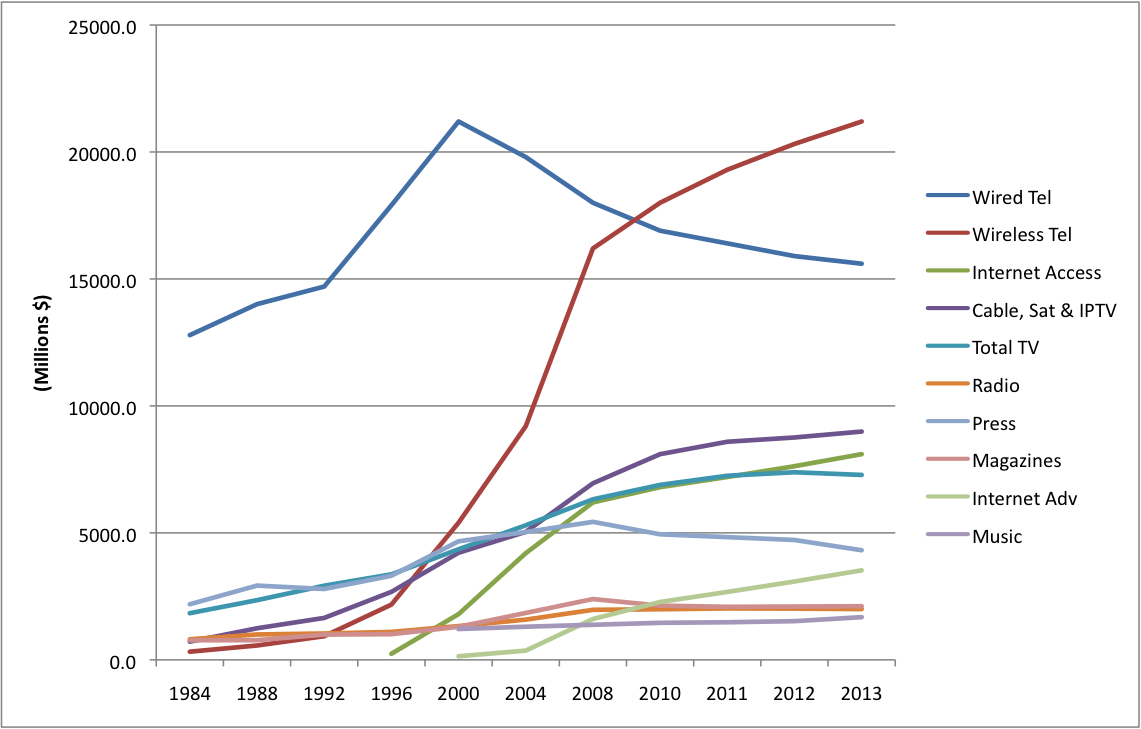
Source: see Media Industry Data, Media Economy Data and the Methodology Primary.
The Canadian media economy is often cast as a pygmy amongst giants. However, while no doubt small next door to the United States, it is the tenth largest in the world, after Italy and Australia and just before Spain and South Korea. It has grown quickly relative to other OECD countries, but like most such countries, growth has sputtered since the global financial crisis of 2007-2008, falling to an average of 2.4 percent per annum since, or about half the rate of the preceding half decade.
The fact that the fate of the media economy swivels on the state of the economy writ large is illustrated in Figure 1 above where the revenue lines for almost all ten sectors (except wiredline telecoms) show a sharp downward kink in 2008 when the global financial crisis took hold. As the Figure shows, revenue for all other sectors either flattened (slowed down), including for mobile wireless, internet access and internet advertising, or declined outright, during this period (see Picard, Garnham, Miege, Vogel, for example, on the relationship between media economy and general economy).
Nonetheless, and cast over a longer period of time, the rise of entirely new sectors – wireless, internet access, pay and specialty tv services, internet advertising, for example – has added immensely to the size and complexity of the network media economy. The most significant source of growth is from the platform media elements (wireless, ISPs, IPTV, cable and satellite), especially after the mid-1990s. The media ecology is thus much larger and structurally more complex now than at the outset of the time period covered by the CMCR project data.
The Platform Media Industries: Perhaps Connectivity, not Content, is King?
The platform media industries – the pipes, bandwidth and spectrum used to connect people to one another and to devices, content, the internet, and so on — of the network media economy grew the most, from $13.8 billion to $53.9 billion between 1984 and 2013. Table 1 shows the trends.
Table 1: Revenues for the Platform Media Industries, 1984 – 2013
Source: see Media Industry Data, Media Economy Data and the Methodology Primary.
In real dollar, or inflation adjusted, terms, revenue almost doubled from $28 billion to $53.9 billion over this period. Accounting for nearly three-quarters of all revenues (72%), the platform media sectors are the fulcrum of the media economy.
Mobile wireless services have expanded quickly since the turn-of-the-21st century to become the centrepiece of the digital media ecology. Mobile wireless revenues nearly quadrupled from $5.4 billion in 2000 to $21.2 billion last year, and surpassed those of plain old wiredline services in 2009.
The recent growth spurt is due to the expanding array of devices that people connect to wireless networks: phones, smartphones, tablets, wifi connected PCs, and so on. Personal wireless mobile communications are now at the centre of the media universe. Mobile data traffic doubled in Canada in 2013 over the previous year.
Some argue that the slowdown in wireless growth since 2008 is the result of it becoming a mature market (Church and Wilkins, 2013, p. 40). Relative to the torrid pace of growth from the late-1990s through the 2000s, the pace of growth has undoubtedly slowed, but this single-focus explanation is misguided.
The pace set during the early uptake of new technologies cannot be sustained forever, as is well known, and the growth of mobile wireless has not surprisingly followed the classic “S-pattern” of diffusion. More than that, however, the recent flattening of growth dovetails perfectly with the financial crisis.
This reality cannot be ignored. Revenues for the network media economy worldwide declined between 2008 and 2009 and some of the world’s biggest media economies are smaller today than they were half a decade ago (Germany, UK, Italy and Spain), others have stalled (Japan and France) or grown only modestly over this period (US, Canada and Korea). Overall, wireless revenues have not been hit nearly as hard as other media sectors by either the collapse of the dot.com bubble in 2000 or by the Anglo-European financial crisis (2007-2008ff), but a let-up in the pace of wireless growth amidst such conditions can be seen and is not surprising.
In sum, while the pace of development has slowed relative to past trends, the explanation is not due solely, or even primarily, to the maturation of the mobile wireless market but to a combination of the following factors:
- the typical ‘S-shape’ diffusion of innovation curve;
- the impact of economic uncertainty; and
- a reluctance the big three mobile wireless carriers – Rogers, Bell, Telus — to target less lucrative subscribers.
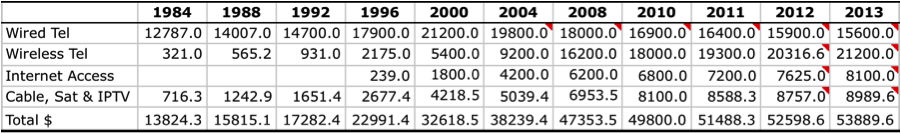
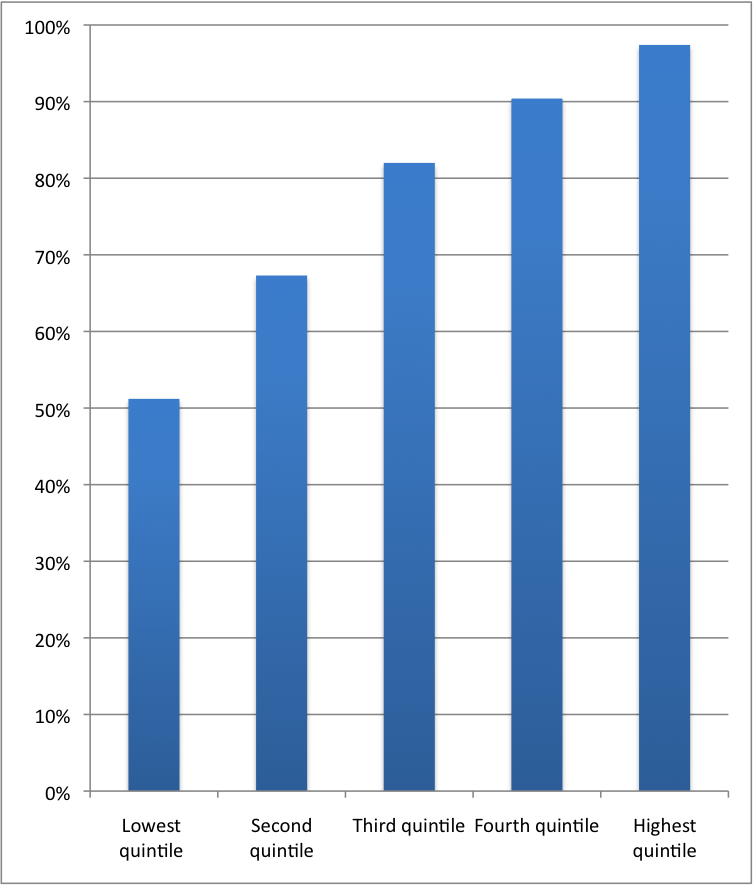
This last points deserves more attention. Just over four-fifths of Canadians subscribed to cellphone service (81.4%) at the end of 2012, according to the most recent Statistics Canada data, while one-in-five do not subscribe to mobile wireless services. As Figure 2 below shows, access to mobile wireless services, and other information and communications media, is highly unequal and stratified by income.
Figure 2: Household Access to Information and Communication Technologies by Income Quintile, 2012
Note and Source: Upper bounds for the first to fourth quintiles are $27.4k, $48.4k, $74.5k, $112K and Above $116.9k. Statistics Canada (2014). ‘Dwelling characteristics, by household income quintile, Canada, 2012. In Survey of Household Spending in 2012. Ottawa: Statistics Canada.
For households in the lowest income quintile, two-in-five do not subscribe to a mobile wireless service, while a quarter of those on the next rung up the income ladder stand in the same position. At the opposite end of the income scale, wireless penetration is securely above 90%.
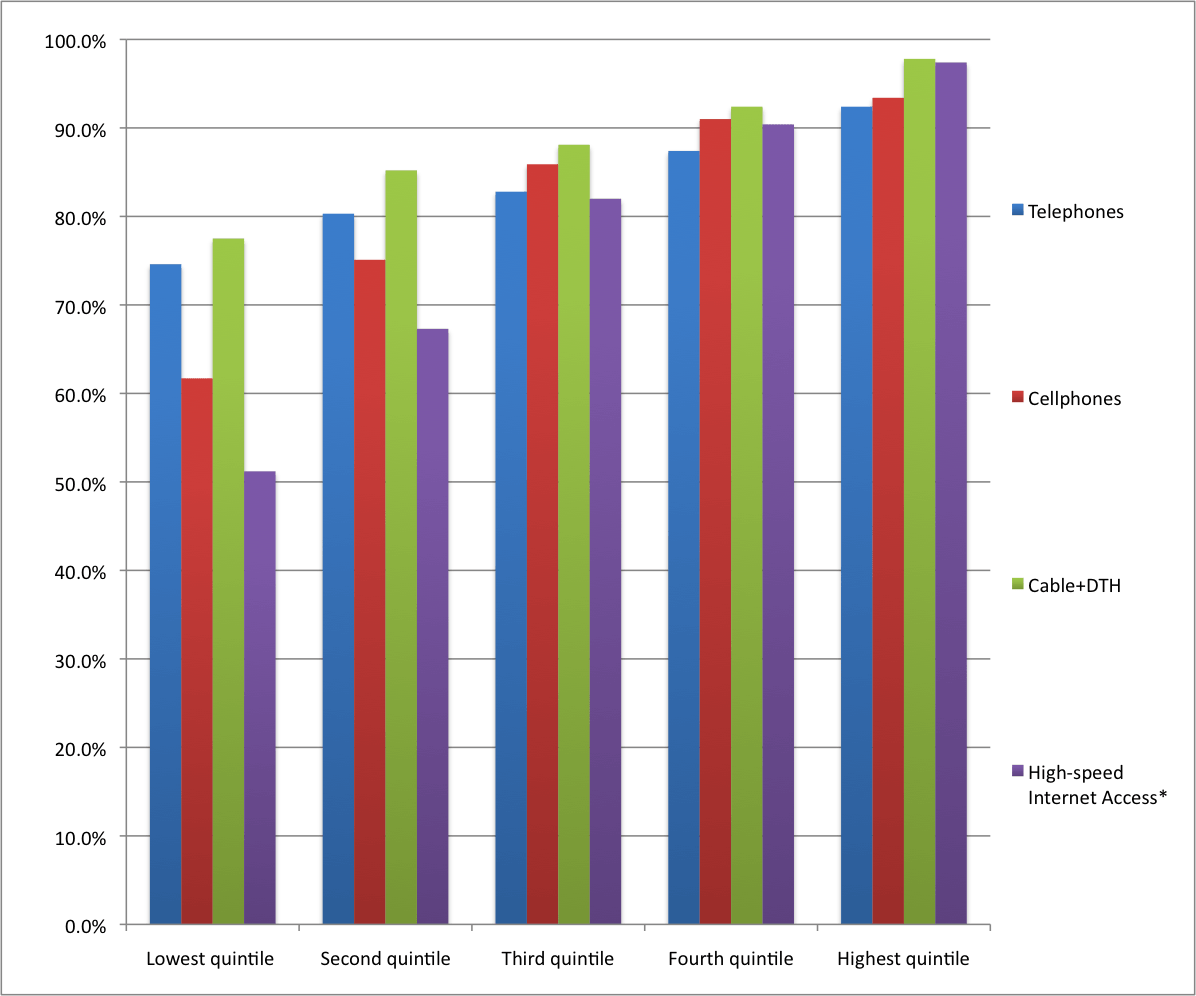
Rogers, Bell and Telus obscure the reality of low levels of wireless penetration by touting the high percentage of existing subscribers that have smartphones. Take account of the low levels of cellphone penetration (81.4%) in Canada, however, the idea that sixty percent of existing wireless subscribers are smartphone users is not a triumph to be celebrated but a problem to be addressed. Calculated thus, less than half of Canadians (48%) are smartphone users. Rather than placing Canada at the top of international comparisons, such results put it 24th out of 34 OECD countries for broadband wireless penetration at the end of 2013, as Figure 3, below, demonstrates — far below peers such as the US, the UK, Denmark, Australia, and many others.
Figure 3: OECD wireless broadband subscriptions per 100 inhabitants, by technology, December 2013
Source: OECD Broadband Portal. http://www.oecd.org/sti/broadband/oecdbroadbandportal.htm
While the so-called mobile wireless revolution has certainly put such services at the centre of the universe, the wiredline telecoms infrastructure – e.g. the plain old telephone system (POTS), internet access, cable and IPTV networks – remains central. Taken altogether, each of the segments that comprise the wiredline infrastructure accounted for more than half of all platform media industry revenues (55%) in 2013. Mobile wireless services accounted for roughly forty percent; direct-to-home satellite services make up the difference (6%).
This is despite the fact that the decline in plain old wireline telecom revenues continued in 2013, with revenues falling to $15.6 billion, far off their high-water mark of $21.2 billion in 2000. At the same time, however, those decreases have been offset by growth in internet access, IPTV and cable revenues.
Internet access revenues have grown immensely in the past decade, similar to mobile wireless, albeit for not as long or to the same extent. Internet access revenues last year were $8.1 billion, up substantially from $7.6 billion a year earlier. They were quadruple what they were at the turn-of-the-21st century ($1.8 billion).
However, as with mobile wireless services, this should not obscure the fact that broadband internet access is far from universal. Four-out-of-five Canadian households subscribed to high speed internet access by the end of 2013, according to the CRTC. However, tighten the definition to include only high-speed internet access with download speeds greater than 5 Mbps, and that number drops sharply to 67% (see CMR 2014, p. 171). It is also the case that access to high-speed internet access is highly divided along income lines, as Figure 4, below, shows.
Figure 4: High-speed Internet Access by Income Quintile, 2012
Note and Source: Upper bounds for the first to fourth quintiles are $27.4k, $48.4k, $74.5k, $112K and Above $116.9k. Statistics Canada (2014). ‘Dwelling characteristics, by household income quintile, Canada, 2012. In Survey of Household Spending in 2012. Ottawa: Statistics Canada.
A notable recent development has been the rapid growth of the telephone companies’ Internet Protocol TV (IPTV) services, the incumbent telcos’ managed internet-based tv services: e.g. Telus, Bell, MTS Allstream, SaskTel, and Bell Aliant. The number of IPTV subscribers has more than tripled since 2010, rising from 550,000 to almost 1,700,000 last year. A corresponding sharp increase in revenues for the telcos’ IPTV services has followed, increasing from $740 million in 2012 to just over $1 billion last year – quadruple the amount of three years earlier.
Tables 2 and 3 below show the trends for IPTV growth in terms of both subscribers and revenues, respectively.
Table 2: The Growth of IPTV Subscribers in Canada, 2004–2013
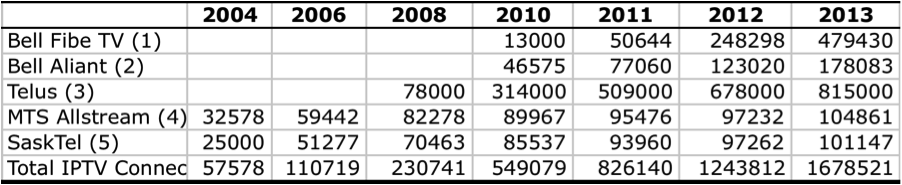
Source: see Media Industry Data, Media Economy Data and the Methodology Primary.
Table 3: The Growth of IPTV Revenues in Canada, 2004–2013
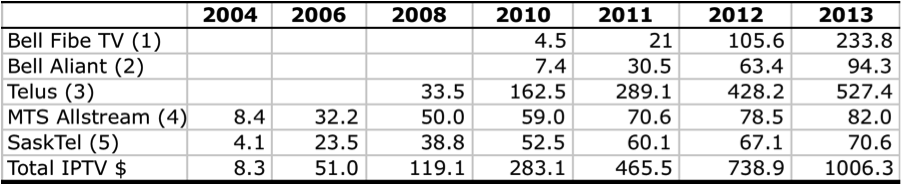
Source: see Media Industry Data, Media Economy Data and the Methodology Primary.
The subscriber and revenue figures reported in Tables 2 and 3 are slightly higher than those in the CRTC’s 2014 Communication Monitoring Report: 1,385,100 subscribers and $926.1 million, respectively (pp. 120-121). This is likely because the CRTC’s figures for subscribers are taken from the end of August each year as opposed to the companies’ fiscal year-end, as I have done. Also, the CRTC’s estimated revenues (ARPU) are lower than those the telcos cite in their annual reports. Lastly, the lack of consistent, full disclosure by the telcos and CRTC further obscures the exact number, although the difference is small enough to suggest that both are close to the mark.
The growth of the IPTV services is significant for many reasons. First, the telcos are finally making the investments needed to bring next generation, fiber-based internet networks closer to subscribers, mostly to their neighbourhood nodes and sometimes right to their doorsteps. If the distribution of television is essential to the take-up of next generation networks, as I believe it is, IPTV will be a key part of the demand drivers for these networks (see below).
Second, the addition of IPTV as a new television distribution platform brings the telcos deeper into the cable companies’ dominion. By 2013, IPTV services accounted for just over 11 percent of the TV distribution market by revenue on the basis of annual reports and year-end figures from the companies, a significance increase from the 7.5% market share they held a year earlier. The CRTC’s Communication Monitoring Report publishes a slightly lower number at 10.3 percent for reasons explained above (see p. 121), but again the difference does not detract from the more general theme regarding the telcos’ deeper forays into the cable companies’ territories.
The increased competition posed by IPTV appears to be most significant in the western provinces where Shaw faces three companies that have been quickest to roll out IPTV services: Telus in Alberta and BC, SaskTel in Saskatchewan and MTS in Manitoba. From Ontario to the Atlantic, in contrast, Bell’s roll-out of IPTV services occurred later, thereby softening the competitive impact on Rogers, Quebecor, Cogeco and Eastlink – at least up until 2013.
Nonetheless, cable and satellite companies have lost subscribers as the telcos launched IPTV services. Cable and satellite companies lost 386,000 subscribers in 2013, according to the CRTC’s data, hence the hand-wringing in the press and some industry circles about cord cutting. They have also seen revenues dwindle in the last two years, as Table 4 below illustrates.
Table 4: Cable & Satellite Provider vs IPTV Revenues, 2004 – 2013

Sources: CRTC, Communication Monitoring Report, p. 120; Media Industry Data, Media Economy Data and the Methodology Primary.
The drop in the number of cable and satellite subscribers, however, was, for all intents and purposes, cancelled out by the increase in IPTV subscribers. The CRTC’s most recent data shows that the number of cable, satellite and IPTV subscriber at the end of 2013 was down .1%, or about 7,000 subscribers, compared to a year earlier (CRTC, 2014, p. 121). Tallying up the figures based on data that the telcos have published, however, suggests a small uptick in total number of subscribers. Moreover, the quarter-of-a-billion dollar rise in 2013 to $9 billion for cable, satellite and IPTV broadcast distribution undertakings as a whole reveals a modest increase, as Table 6 illustrates.
Against the hew and cry about cord-cutting in industry pleadings for regulatory favours, and journalistic coverage that uncritically repeats such claims, the losses of incumbent cable providers, mostly to the telcos’ IPTV services, should not be mistaken with an industry in peril. Even if it was, growing competition is to be encouraged rather than something to shed tears over. The more important story is that duopolistic rivalry between the telcos and cablecos appears to have ratcheted up a notch or two after 2011, with the former gaining at the expense of the latter.
While IPTV services appear to be finally taking off, a few things should be remembered. First, it was the small prairie telcos, followed by Telus, which took the lead in deploying IPTV. As a result, IPTV revenues now make up a significant 10.1 percent, 6.3 percent and 11.9 percent, respectively, of Telus, MTS and Sasktel’s wireline network access revenues (Wiredline + ISP + IPTV). Bell lags far behind, with under 3 percent of its revenues coming from IPTV services, including Bell Aliant, in 2013 (see Table 5).
Indeed, Bell launched IPTV late via its affiliate Bell Aliant in 2009. It slowly rolled out service for the next two years in the high-end districts of Montreal and Toronto, half-a-decade after MTS and SaskTel began doing so in the prairies. More cities were added in 2012 and 2013 and subscriber numbers and revenues began to rise more quickly for the Bell Fibe service. By 2013, Bell (including Bell Aliant) had 657,500 subscribers versus 371,318 a year earlier and just one-fifth that total in 2011. Again, while it is not possible to say with certainty, the slower roll-out by Canada’s biggest telco, Bell, is likely due, at least in part, by its desire to minimize the impact of IPTV roll-out on its existing investment in DTH.
Still, IPTV remains under-developed as a core element of the network infrastructure in Canada, accounting for only 3.4% of $30.5 billion in wiredline network access revenues (i.e. wireline + cable BDUs + IPTV + ISPs). Just under three percent of broadband connections in Canada use fiber-to-the-home (see Communication Monitoring Report, p. 147). The OECD average is 17 percent. In countries at the high end of the scale (Sweden, Slovak Rep., Korea, Japan), thirty to seventy percent of all broadband connections are fiber-based. The OECD ranks Canada 22nd out of 34 countries in terms of fiber-connections out of the total number of subscribers as of December 2013. The following figure illustrates the point.
Figure 5: Percentage of Fibre Connections Out of Total Broadband Subscriptions (December 2013)
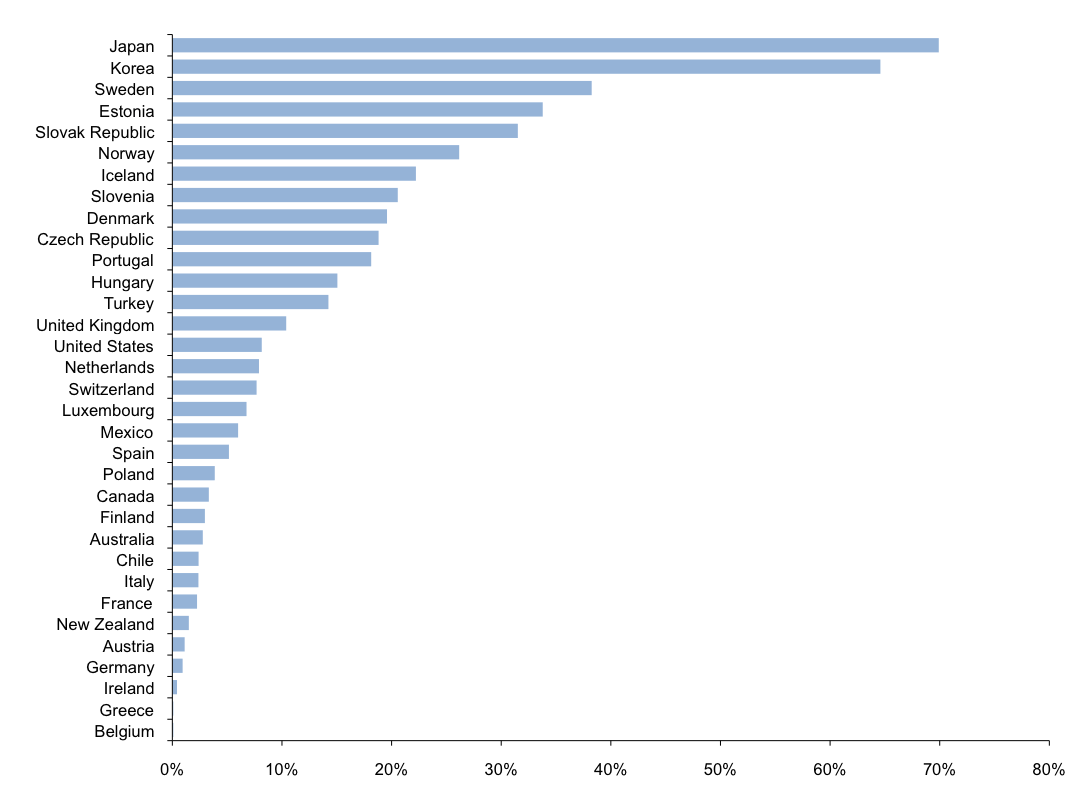
Source: OECD (2014). Broadband Portal.
For those who might be dismissive of such figures, it is useful to remember that the data presented in Tables 4 and 5 about IPTV are based on the Canadian telcos’ own audited numbers from their annual reports. While it has become something of a sport in Canada to cast aspersions on the OECD data (see here, here and here), the UK regulator Ofcom reached similar conclusions in its latest international comparisons: 7% of Canadian households subscribed to IPTV in 2012 versus France (32%), Netherlands (13%), Sweden (14%), the US (8%), Germany (5%), and Spain (5%) as of 2012 (p. 160). The prairie telcos and Telus are undoubtedly part way to the OECD average, but in many ways, especially given its size and presence from Ontario to the Atlantic, Bell’s poor performance over the past half-decade has dragged Canada down in the global league tables.
That innovation and investment in IPTV in Canada came first from telcos on the margins and, secondly, by Telus, not Bell, replays a long-standing practice for new services to start out as luxuries for the rich before a mixture of public, political and competitive pressures turn them into affordable and available necessities for the public generally (see Richard John with respect to the US, Robert Babe for Canada). From the telegraph to next generation fibre Internet infrastructure, the tendencies, conflicts and lessons have remained much the same, with the ongoing debates over access to broadband infrastructure the latest iteration of an old, old story (Winseck Reconvergence, Winseck and Pike, John, Babe, Middleton).
The Content Media Industries
The remainder of this post looks at the content media industries (broadcast tv, specialty and pay tv, radio, newspapers, magazines, music and internet advertising). For the most part, they too have grown substantially over the long-run, but growth has been marginal, if at all, for most such sectors since 2008.
In 1984, total revenue for the content industries was $5.6 billion; in 2012, it was $20.8 billion in 2012. In inflation-adjusted dollars, revenues basically doubled from $11.4 billion to $20.9 billion over this span of time. Growth was steady, with no discernible major uptick or downturn at any given point in time except since 2008 when, for reasons discussed above, revenues slowed to a crawl (on the basis of current $) or stalled (using real $). Figure 6 depicts the trends.
Figure 6: Revenues for the Content Industries, 1984 – 2013 (current $)
Sources: see Media Industry Data, Media Economy Data and the Methodology Primary.
Trends in the content media industries generally follow the twists and turns of those in the general economy more closely than the platform industries because they are more heavily dependent on advertising revenues. And advertising revenue has gyrated in lockstep with the state of the economy: plummeting by 7% from 2008 to 2009 followed by sizeable increases of 8.1%, 4.7% and 3.8% in 2010, 2011 and 2012, respectively. However, total advertising revenue shrank again by 2% in 2013 amid ongoing economic uncertainty.
Perhaps even more tellingly, on a per capita basis, advertising revenue was exactly the same in 2013 as it was in 2006: $415, although there was substantial swings between highs and lows on this basis and over this period, with the low falling to $394 per capita in 2009 at the bottom of the economic downturn. In short, these trends fit the patterns described earlier perfectly (on economic recessions, advertising revenue and the media economy see Picard, Garnham or Miege).
These trends in advertising have had a significant impact on those media that depend the most on advertising: conventional TV, radio, magazines and newspapers. For conventional television, overall revenues, stayed relatively flat between 2008 and 2012, when including advertising revenue and the CBC’s annual parliamentary appropriation, before dropping significantly in the last two years.
However, while advertising plunged in 2009 before rising again in the following two years, it has dropped greatly since, falling from $2.3 billion in 2011 to less than $2.1 billion in 2013. Still, however, television advertising as a proportion of all advertising has continued to stay remarkably steady over time: it was 23.2% of all advertising last year versus an average of 23.8% per annum in the five year span prior to the economic downturn in 2008.
Last year’s government cut-backs of $27.8 million to the CBC and drop of $47.1 million in payments from the Local Program Improvement Fund compounded the woes (CBC, 2012-2013 Annual Report, p. 61). Altogether, conventional TV revenues slid from an all-time high in 2011 of $3,501.7 million to $3,190.9 million last year — a 9% decline. The bulk of the drop-off took place last year, with the result that conventional television revenues in 2013 were, more or less, where they were a decade ago.
Overall, four points help to explain the stagnation and recent decline of conventional TV:
- declining TV advertising in 2012 and 2013;
- budget cuts to the CBC (p. 78);
- the phasing out of the Local Program Improvement Fund between 2012 and 2014;
- the big four commercial TV providers – Shaw, Bell, Rogers and Quebecor – shift of resources and support to fast growing pay, specialty and other subscriber-based forms of TV (i.e. mobile, IPTV), while edging away from broadcast TV (see the CRTC’s Communication Monitoring Report, pp. 113-117 and Individual Financial Summaries for a list of the 117 pay and specialty channels the big four, in total, own 2013).
The real growth in television, however, has been in subscriber fees and the pay-per model of TV, as has been the case around the world. Once we widen the lens to look at the fastest growing areas of television it becomes clear that cries of television being in crisis or on the wane are wide of their mark: i.e. specialty and pay tv services (HBO, TSN, Comedy Central, Food Network, etc), mobile TV and television distribution. Indeed, pay and specialty TV services have been fast growing segments since the mid-1990s and especially so during the past decade.
Specialty and pay TV revenues eclipsed those of conventional broadcasting in 2010, when revenues reached $3,474.6 million. Last year, the figure was $4,091 million. The fact that specialty and pay TV have continued to grow briskly even in the face of the economic downturn also points to a crucial point: the importance of the direct pay-per model (Mosco) and its relative imperviousness to economic shocks in comparison to the hyper-twitchy character of advertising revenue.
Adding conventional as well as specialty and pay tv services together to get a sense of ‘total television’ revenue as a whole yields an unmistakable picture: total TV revenues quadrupled from $1,842 million in 1984 to $7,281 million in 2013; using ‘real dollars’, total TV revenues doubled from $3.7 billion three decades ago to $7.3 billion last year. The severity of the decline in conventional TV did drag down total TV revenues by just over one percent, but other than this, the mid- and long-term trends hardly comport with the image of a media sector in crisis.
Once cable, satellite and IPTV distribution are added to this portrait the trend is more undeniable. In these domains, as indicated earlier, the addition of new services, first DTH in the 1990s, accompanied by the steady growth of cable TV and by the relatively quick growth of IPTV in the past few years means that the TV distribution market has grown immensely. Indeed, revenues for this sector expanded more than twelve-fold from $716.3 million in 1984 to $8,989.6 million in 2013 (in current dollars).
Sum up all of the various elements of “Total TV” and TV distribution, and the television marketplace accounted for nearly $16.3 billion in 2013. To put this another way, in 1984, all segments of the TV industry accounted for 13% of revenues in the network media economy. That figure rose to 19% in 2000; by 2013, it was 22%. Table 5 illustrates the trends.
Table 5: Television Moves to the Centre of the Network Media Economy Universe, 1984 – 2013 (millions current $).
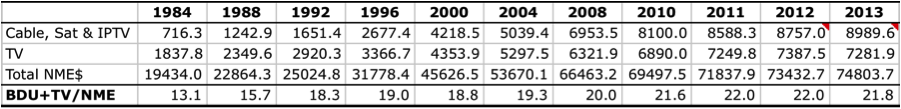
Sources: see Media Industry Data, Media Economy Data and the Methodology Primary.
Looking further afield, the picture is somewhat mixed but hardly fits the image of television being in dire straights. The time people spent watch television has stayed remarkably steady and even grew between 2010 and 2011, but fell across all age groups by 2.1 percent in the last two years.
The most recent Canadian Media Usage Study also indicates that the amount of time spent watching television weekly in Canada has grown substantially during the past decade. Time spent on the internet using a variety of devices – PCs, smartphones, tablets – has caught up and now equals time spent watching television on the traditional screen (p. 2), although the study does not indicate how much time spent using the internet is spent watching television on a PC, smartphone, tablet or some other device.
Sanford C. Bernstein & Co. senior analyst Todd Juenger sheds some light on this point in “Why the Internet Won’t Kill TV”, when he states that, “so far teens are following historical patterns, and in fact, their usage of traditional TV is increasing”. Their use of computers, smart phones and tablets to do so is adding to, rather than taking away from, how much they watch television, he states. As Marshall McLuhan once put it, old media become the content of new media rather than just fade away.
Ofcom’s 2013 International Communications Market Report shows that television revenues worldwide were up an average of 4.4% per year, 2008-2012, and in 13 out of 17 countries it surveyed, including Canada (pp. 133-136, 147-148). Viewing time was also up between 2011 and 2012 in nine out of the fifteen countries it surveyed, including, in contradiction to CRTC figures, in Canada, while remaining flat in the US (p. 170).
Internet equipment manufacturers Cisco and Sandvine suggest that television and online video are driving the evolution and architecture of the internet, with over half of down-stream internet traffic now accounted for by Netflix and Youtube. Indeed, Netflix alone accounted for just under a third of all downstream internet traffic in North America at the end of 2013.
In general, the proliferation of devices is expanding the time and space/place for television in people’s lives. Elsewhere, I have called this the rise of the prime time internet. The fact that Netflix is engineered to be watched on 800 devices helps to illustrate the point.
Of course, this does not mean that life is easy in the television business. Indeed, all of its constituent elements continue to have to come to terms with an environment that is becoming structurally more differentiated because of new media, notably IPTV and over-the-top (OTT) services such as Netflix, as well as significant changes in how people use the multiplying media at their disposal.
Incumbent television providers have leaned heavily on the CRTC and Parliament to change the rules to bring OTT services into the regulatory fold, or to weaken the rules governing their own services, on the grounds that such services threaten their commercial viability and the underlying economics of the Canadian television system (see Bell’s submission to the CRTC’s Talk TV proceeding this year, for a recent example, notably pp. 22-24). However, rather than cannibalizing the revenues of the television industry, new OTT services appear to have added to the size of the pie, given the trends outlined above.
Based on an estimated 2.9 million subscribers at the end of 2013, Netflix’s revenues from Canada were $216 million – about 3 percent of “Total TV” revenues. If this is counted as part of the overall television marketplace, total TV revenues actually rose to roughly $7.5 billion in 2013 rather than the slight decline cited above (1%). Recent reports by Media Technology Monitor and CBC and the CRTC’s (2011) Results of the Fact Finding Exercise on Over-the-Top Programming Services lead to a similar conclusion.
In sum, television is not dead or dying. Conventional television is in trouble, but everywhere else, television is thriving, with revenue up, and watching television very much at the core of the internet- and wireless-centric media universe. Television and online video, in fact, are driving the development and use of wireless and internet services. This is why Rogers, Telus and Bell are all using television to drive the take-up of 4G wireless services, internet access and IPTV. To paraphrase Mark Twain, rumors of television’s demise are greatly exaggerated.
Internet Advertising
Part of the more structurally differentiated network media economy is also illustrated by the rapid growth of internet advertising. In 2013, internet advertising revenue grew to $3.5 billion, up from just over $3.1 billion a year earlier and $1.7 billion in 2008. At the beginning of the decade, internet advertising accounted for a paltry $181 million, but has since shot upwards to reach current levels. Similar to wireless services, however, internet advertising revenues continue to grow fast, but the pace of growth has slowed since the onset of the financial crisis, even if the impact has been modest relative to other media.
To be sure, these trends have given rise to important new actors on the media scene in Canada, notably Google and Facebook, among others, who account for the lion’s share of internet advertising revenues. Indeed, based on common estimates that Google accounts for about half of all internet advertising revenues, the search engine giant’s revenues in Canada in 2013 were around $1,870.5 million, or about 2.5% of total revenues across the network media economy. This is significant.
On this basis, Google ranks as the sixth largest media company operating in Canada, just after Bell, Rogers, Telus, Shaw and Quebecor, in that order. By 2013, its revenues were greater than those of the CBC, MTS, Cogeco, Sasktel, Torstar, Postmedia, Eastlink, Power Corporation (Gesca) and the Globe and Mail.
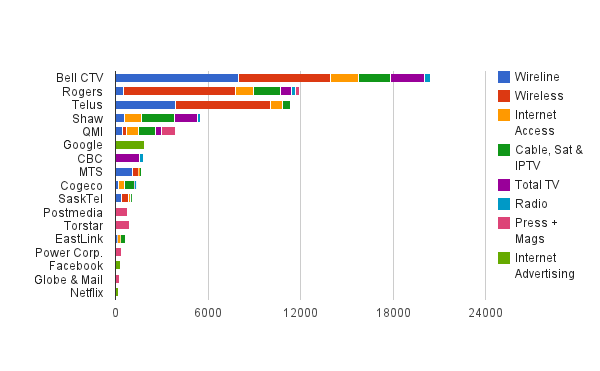
For its part, Facebook had an estimated 19 million users in Canada by mid-2013. With each Canadian user worth about $18.70 to the company a year (see Facebook, Annual Report, p. 41), it’s revenue can be estimated as having been $355.3 million in 2013. This is about 10% of online advertising revenue – a sum that gives it a modest place in the media economy in Canada and near the bottom of the list of the top twenty TMI companies in this country.
While it is commonplace to throw digital media giants into the mix of woes that are trotted out as ailing many traditional media in Canada, the impact of Google and Facebook are largely limited to three media sectors where they are probably quite significant: music, magazines and newspapers. For the latter two, this is because of the direct impact on advertising revenues, while for music it is not advertising that is at issue, but how online distribution and the culture of linking and aggregation, affects the music industry. The concluding sections of this post sketch out trends in each of these domains.
Music
While many have held up the music industry as a poster child of the woes besetting ‘traditional media’ at the hands of digital media, the music industry in Canada is not in crisis. The picture over time, however, is mixed but getting better from a commercial standpoint.
In fact, trends in Canada appear to be in line with and may be leading those worldwide. As the International Federation of Phonographic Industries notes, 2013 was the second year in a row in which music industry revenues increased (pp. 5-9). While the details the IFPI offers are sketchy, it points to the advent of legitimate online music downloading and streaming services, the diversification of revenue sources, and an industry that has met the need to transform itself in light of new realities after having clung to the past for years.
The sum of all revenues from the main components of the music industry – i.e. recorded music, digital sales, concerts and publishing royalties – indicates that the music industry has grown from $1,214 million in annual revenues in 1998 to $1,680.8 million in 2013. Revenues rose significantly in 2013, but caution is needed insofar that one element in the calculation – recorded music – is based on an estimate pending the release of relevant figures early next year from Statistics Canada. Overall, however, the trend of the past decade-and-a-half has been unsteady, with considerable oscillation between record highs, lows and a tentative recovery.
Revenues dropped after the collapse of the dot.com bubble between 2000 and 2002, for instance, but then rose again until hitting a peak in 2004 of $1,305.2 million where they stayed basically flat for the next four years, when they began once again to climb. Indeed, this was the exact opposite trend of almost all other sectors, where growth either slowed, stalled or went into decline after 2008.
By 2010, music industry revenues had grown to $1,458.2 million, from where they have edged up ever since until rising significantly in 2013. Figures 7, 8 and 9 illustrates the trends over time based on current dollars and, more importantly, the structural transformation of the sector away from an industry centred on recorded music to one where concerts and live entertainment, the internet and mobile devices, and publishing play key and growing roles.
Figure 7: Total Music Revenues, 2000 (millions current $).
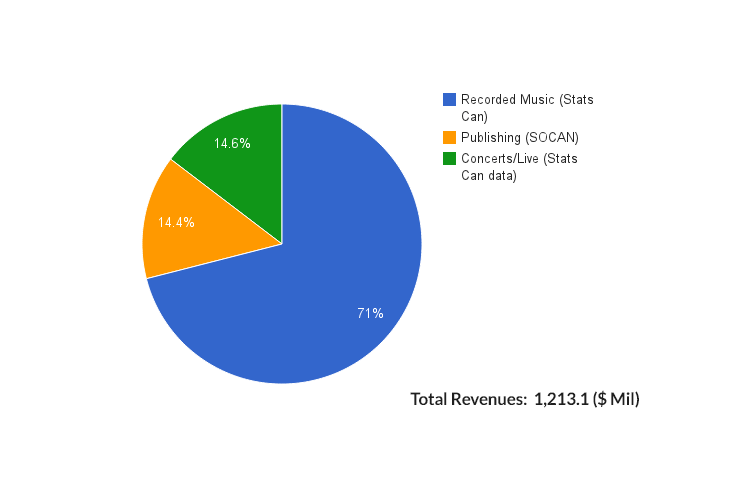
Figure 8: Total Music Revenues, 2006 (millions current $).
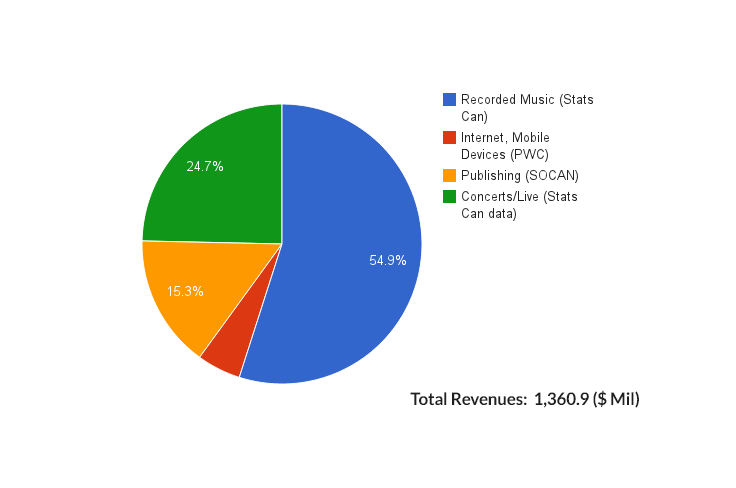
Figure 9: Total Music Revenues, 2013 (millions current $).
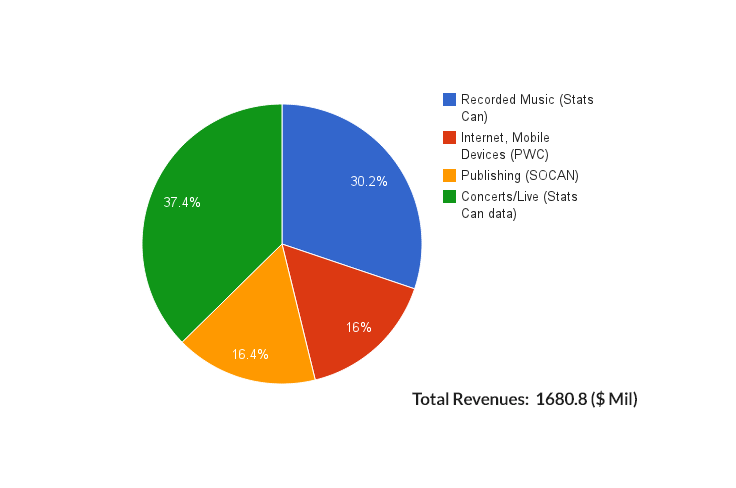
Sources: Recorded Music from Statistics Canada, Sound Recording and Music Publishing, Summary Statistics CANSIM TABLE 361-0005; Stats Can., Sound Recording: data tables, October 2005, catalogue no. 87F0008XIE; Stats Can, Sound Recording and Music Publishing, Cat. 87F0008X, 2009; Concerts from Stats Can, spectator sports, event promoters, agents & managers, and artists for 2007, 2008, and 2009; Publishing from Socan, Financial Report (various years); Internet from PriceWaterhouseCooper, Global Media and Entertainment Outlook, 13th ed. USD converted to CDN$ using Bank of Canada Year Average of Exchange Rates <http://www.bankofcanada.ca/rates/exchange/annual-average-exchange-rates/>
There is and has been no crisis in the music industry. In fact, conditions in Canada now mirror those in the music industry worldwide. To be sure, certain elements within the music industry – recorded music, for instance – have suffered badly, but publishing has plugged along steadily with some modest increases, while digital/online/mobile revenues have exploded. The music industry, in short, seems to be in recovery mode, and lessons from this sector may hold lessons for others.
As the music industry’s main lobby group, the International Federation of Phonographic Industries stated in last year’s Digital Music Report, in 2013 “the music industry achieved its best year-on-year performance since 1998” (p. 5). And in 2014, the same publication notes, “Recorded music revenues in most major markets have returned to growth” (p. 5).
One reason for this might be because of all the media covered by the network media concept, the music industries embraced digital/internet sources of revenue earlier and more extensively than any other. Worldwide, by 2012, the industry obtained about 15% of its revenues from online, mobile and digital sources, compared to numbers in the single digits for newspapers and television.
Radio
Radio stands in a similar position to the music industries a few years ago. Revenues grew until reaching a peak in 2008: $1,969.5 million (including the CBC annual appropriation), a level at which they have basically remained ever since. Revenues in 2013 were $1,998.8 (current dollars). Change the measurement from current dollars to inflation-adjusted, real dollars, however, and the picture changes, with revenue declining from $2,093.6 million in 2008 to $1,998.8 million in 2013 – a fall of 4.5%.
Magazines
Magazines appear to stand in a similar position as the music and radio sectors as well, although I have not been able to update the revenue data for the sector for either 2012 or 2013. However, combining previous growth rates from Statistics Canada data as well as the slight rise in revenues shown by PriceWaterhouseCooper for these years, I have estimated that revenues increased by less than 1 percent to reach $2112.1 million in 2013. The Television Bureau of Canada, in contrast, shows a net drop in advertising between 2012 and 2013 of just under 3%, but does not address newsstand and subscriber revenues at all. Generally speaking, the data for this sector is especially poor and revenue estimates for it need to be treated with the greatest caution.
Newspapers
Perhaps the most dramatic tale of doom and gloom within the network media economy, at least in terms of revenues, is from the experience of newspapers. Readers of this blog will know that in earlier versions of this post, and other posts, I have been skeptical of claims that journalism is in crisis. I still am but the idea that circulation and revenues are in long-term decline and unlikely to rebound is hard to deny.
Generally, however, I agree with Yochai Benkler who argues that that we are in a period of heightened flux, not catastrophe, even as traditional commercial newspapers cut back to the bone and continue to flail about. However, one can take some respite in this by looking at the emergence of a new crop of commercial internet-based members of the press (the Tyee and Huffington Post, for example), the revival of the partisan press (e.g. Blogging Tories, Rabble.ca) as well as non-profits and cooperatives (e.g. the Dominion) and the rise of an important role for citizen journalists, all of suggest that journalism dead but in a serious moment of soul searching and transformation. Whether these changes will prove to be a boon for a free and responsible press, however, remains to be seen and I am considerably more skeptical on this point than Benkler.
At the same time, I also believe that traditional newspapers, whether the Globe and Mail, the Toronto Star, La Preses or Ottawa Citizen are still important engines in the network media economy, serving as the content factories that produce news, opinion, gossip and cultural style markers that have the ability to set the agenda and whose stories cascade across the media in a way that is all out of proportion to the weight of the press in the media economy. In other words, the press originates far more stories and attention that the rest of the media pick up, whether television, radio or via the linking culture of the blogosphere, than its weight suggests. Thus, problems in the traditional press could pose significant problems for the media, citizens and audiences as a whole.
I have been reluctant to see newspapers as being in crisis, mostly because in previous years I have felt that the trends had not been long enough in the making to draw a firm conclusion one way or another, and because I think many of the wounds suffered have been self-inflicted. However, I have been changing my tune over the past two years. The results this year offer no reason to revert back to my original view.
The revenue figures for the newspaper industry, as one industry insider who tallies up the data told me, are “a mess”. The problems are mostly terminological in nature, such as how to define a daily, community or weekly newspaper while assigning revenue to each category accordingly. Nonetheless, using a mixture of data from Newspaper Canada and Statistics Canada allows us to arrive at a reasonably good portrait of the newspaper industry over time and its main players.
The data I use is drawn mostly from Statistics Canada, but I show both Newspaper Canada and Statistics Canada data below so that readers can see the differences between these two sources for themselves. Of particular interest, Newspaper Canada data also reveal the segment of online revenues, whereas Statistics Canada does not. Further discussion of why these differences exist can be seen in the relevant sections of the documents here and here.
Regardless of differences, both sources show that newspaper revenues have plummeted. In current dollar terms, Statistics Canada shows that newspaper revenues peaked at $5,482.3 million in 2008, and have fallen since to an estimated $4,315.5 million last year. Table 6 below illustrates the trends over time since 2004, while the full data set based on Statistics Canada data from 1984 can be seen under the relevant heading here.
Table 6: Newspaper Revenue — Newspapers Canada vs Statistics Canada, 2004-2013
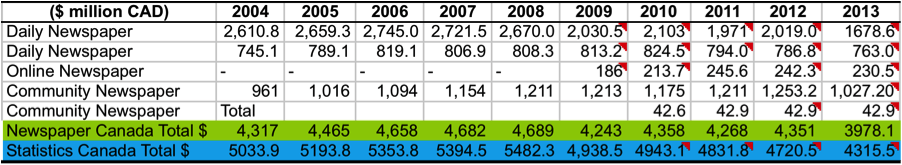
Sources: see Media Industry Data, Media Economy Data and the Methodology Primary.
In real dollar terms, the fall is more pronounced yet, with the decline setting in earlier and the drop being steeper. According to this measure, newspaper revenues flatlined between 2000 and 2008, with a small drop, but have shrunk immensely since from $5.8 billion to $4.3 billion – a plunge of 25% in half a decade. This is the most clear cut case of a medium in decline out of the ten sectors of the network media economy reviewed in this post.
The results of these trends in 2013 were clear:
- Most major newspaper publishers – Postmedia, Quebecor, Power Corp (La Presse) and the Globe and Mail – saw steep revenue losses;
- Reduced publishing schedules across the Postmedia chain adopted in 2012 (the Calgary Herald, Edmonton Journal and Ottawa Citizen) and previous years (e.g. the National Post) were maintained;
- Torstar cut 55 jobs in March, Quebecor’s Sun newspapers cut another 360 jobs in July and another 200 in December, on top of the 500 it cut at the end of 2012 as it laid off journalists and centralized its printing operations in a smaller number of locations;
- the Globe and Mail voluntary retirement program for journalists and editorial staff was kept in place (and here);
Perhaps the most significant other change to take place in the last two years is the extent to which dailies were put behind paywalls in Canada. Prior to 2011 there were no dailies with paywalls; in 2011 there were 5 covering under 1/10th of daily circulation; by 2012 the number had grown to 16 dailies and more than a quarter of daily circulation. By the end of 2013, the number had grown to 27 dailies accounting for more than half of daily circulation – a rate that is considerably higher than either the US or the UK (see here). Table 8 illustrates the point.
Table 7: The Rise of the Great Paywalls of Canadian Newspapers, 2011-2013

Sources: Newspaper Canada 2013 Daily Circulation Report.
Some Concluding Comments and Observations
Several observations and conclusions stand out from this analysis.
First, the network media economy has grown immensely over time, whether we look at things in the short-, medium- or long-term. In the short- to medium-term (1-5 years), however, things have been less rosy. The effects of the economic downturn in the wake of the Euro-American centred financial crisis have hit every sector, except, it would appear, music, which began to recover shortly afterwards. Otherwise, the effect has been to slow the rate of growth even in the fastest growing sectors (wireless, ISPs, internet advertising, television) and to compound the problem in those media already under stress (newspapers, magazines and radio).
Second, while most sectors of the media have grown substantially, and the network media economy has become structurally more complex on account of the rise of new segments of the media, a few segments have stagnated in the past few years (cable and satellite, when IPTV is treated separately, and radio). It is now safe to say that four sectors appear to be in long-term decline: the traditional newspaper industry, wiredline telecoms, broadcast TV and, more hesitantly, magazines. Magazines probably fit the latter designation but it may still be too early to tell, with some good sources suggesting that it too, like the music sector, might be poised for a turn-around, and if the definition of the sector is redefined to include online magazines and their associated revenues, which are now excluded from Statistics Canada data.
Table 8: Growth, Stagnation Decline, or Recovery in the Network Media Economy

These ambiguities give good reason for why the CMCR project will continue to update our research on these matters annually. As we have said before, we know of few better ways to gain an intimate understanding of our objects of analysis – the network media and all of its constituent elements – than to peer deeply and systematically into the data, while providing a theoretically and historically informed analysis of the trends that emerge over as long a period of time as we reasonably can.