Growth of the Network Media Economy in Canada, 1984-2015
Introduction
Every year for the past five years the CMCR Project has put out a series of reports on the state of the telecoms-internet and media industries in Canada. This report is the first installment in this year’s series. A PDF version of this report is available here, while previous versions can be found for 2014, 2013, 2012 and 2011.
The report examines the development of the media economy over the past thirty-odd years, with the “media” defined broadly to include mobile wireless and wireline telecoms services; internet access; cable, satellite & IPTV; specialty and pay TV; broadcast TV; radio; newspapers; magazines; music; and internet advertising.
Its aim is to get a good sense of how all of the different sectors of the telecoms- internet and media industries have developed over time, and how they fit together into a larger entity that I call the network media economy. It is also to determine which of these industries are growing, stagnating or in decline, while also casting a light on those sectors of the media that are showing signs of recovery, like the music industry. It also examines whether over-the-top services (OTT) like Netflix, CraveTV, Spotify, and trends such as cord-cutting, are delivering lethal blows to established media or helping to expand the size and diversity of the media economy overall.
A key development identified in this report is the extent to which advertising-supported media (i.e. television, radio, newspapers and magazines) are being pushed aside by the “platform” and “pay-per” media industries. The “platform” segments of the media – i.e. the pipes, bandwidth and spectrum that people use to connect with one another and to devices, media content, the internet, and so forth – accounted for three-quarters of all revenue by the end of 2015: i.e. mobile wireless, wireless telecoms, ISPs, as well as cable, DTH and IPTV services. Platform media and other content media that rely primarily on subscriptions and direct purchases constitute the “pay-per” media and their revenue now outstrips that of advertising-supported media, including internet advertising, by a ratio of more than five-to-one.[1]
Indeed, while advertising revenue inched upwards over the past decade, on a per capita basis it fell significantly (see TVB, 2015). The general stagnation of total advertising revenue has little to do with the internet and much to do with the anemic period of economic growth that has held sway since the “Great Financial Crisis of 2008”. Whatever growth in advertising revenue that has occurred has gone almost entirely to internet advertising. Moreover, the distribution of that revenue has become more concentrated. The top ten internet companies’ share of such revenue was a little over three-quarters in 2009; it was 86% last year (IAB, 2016, p. 9). Just two internet hypergiants — Google and Facebook — accounted for an estimated two-thirds of the $4.6 billion in internet advertising revenue in 2015 (see the “Top 20 w Telecoms” sheet in the Excel Workbook).
The upshot of these dynamics are two-fold. First, well-established content media that have relied the most on advertising have been dealt punishing blows: e.g. broadcast television, radio, newspapers and magazines. Second, in an increasingly internet- and mobile wireless-centric world, “Connectivity is King”, not content (see Odlyzko) – and especially not advertising-based media content.
While some have taken this drift of events, for understandable reasons, to justify applying a levy to internet service providers (ISPs) and mobile wireless carriers to support cultural policy goals,[2] that idea should be rejected. Most importantly, this is because to do otherwise would be to harness the general purpose, internet- and mobile wireless-centric media ecology to supporting the few genuine public goods that have been supported by the advertising-subsidized “broadcasting system” over the past half-century or so, but that are now in disarray: professional journalism and original audiovisual media content created in Canada. Those are worthy goals, and the fact that people have never paid the full freight for either of these types of media needs to be dealt with head-on instead of taking tools built over the past fifty years within the context of a cable television-centric system and applying them willy-nilly to cellphones and the internet. Internet and mobile wireless connectivity should not be remade in the image of the “broadcasting system”, not least because it constitutes a small part of what people use their broadband and mobile phone connections for.[3]
This does not mean that we should take a squinty-eyed view of the matters at hand, however. Instead, we need an ambitious “connectivity policy” and “cultural policy”, and both need to be suitably funded and independently administered. The former should not be put in the service of the latter. Why?
Because, as a general rule, we should not tax a more expansive general purpose network whose effects are felt across society, the economy and more and more aspects of our everyday lives to support targeted cultural policy aims. To do so would cast aside the basic principle that policy means should be proportionate to the aims sought. The fact that “connectivity” and “culture” policies deal explicitly with public goods also means they should be dealt with directly through general taxes and politically — in the public domain — rather than through a labyrinth of opaque inter- and intra-industry funds, as is currently the case.
Crucially, it is the creators of cultural goods, whether journalism, television, film or video games, who should be the targeted beneficiaries of whatever cultural policy efforts are adopted, not distributors, because the latter are, for the most part, doing just fine. Making telecoms operators integral to the achievement of cultural policy goals would also inevitably embed conflicts of interest into the heart of media and cultural policy.
We also need to realize that “connectivity” policy is also “culture” policy in its own right. It fosters “mass self-expression” and widespread social interaction across time and space (see Castells, 2009; Rainie & Wellman, 2014). What we typically think of as culture policy tends to be more institutional and professionally-oriented, and often elitist and anchored in conservative notions of ‘merit’, although that is not reason to reject such policy but rather as caution as to what must be avoided. More formally, the golden rule of common carriage (aka Net Neutrality) that those who control the medium shall not control the messages flowing over it is violated whenever mobile wireless and broadband internet infrastructure is leveraged to promote some kinds of messages over others – no matter how meritorious they are.
We’ve been here before. In the late-1960s and 1970s, the real potential to develop cable communications networks as multi-functional, common carriers was forsaken in favour of developing them as limited purpose broadcasting distribution networks with the explicit goal of tilting the media ecology in favour of Canadian TV. That was a mistake. Similar mistakes must be avoided today in relation to broadband internet and mobile wireless networks, because these networks are even more multifaceted and support a wide and expanding diversity of uses, users, services and apps than cable ever did.
These and a wide sweep of other critically important issues are now on the table in ways they have not been for years. Indeed, besides the “ISP tax”, one of the major issues taking shape at present is whether or not there should be a specific “Netflix tax” earmarked for the production of Canadian content. Others also see no reason why Netflix, Google, Facebook, Apple or any other internet giant delivering services in this country should not pay income and sales taxes like every other business – a stance that this author agrees with. And never-to-be-missed, the CRTC continues to address a wide range of telecoms, internet and television issues after having found core segments in each of these markets woefully uncompetitive and unresponsive to people’s needs and desires.[4]
At the end of the day, without a good body of data from which to address these difficult questions, hyperbolic claims and vested interests tend to pollute public and policy discourse about the state of the media in Canada and what might be done in response, if anything. This report aims to add to the discussion of these issues out of sense that we are currently living in a constitutive moment when choices made now or in the near future will have enduring and cumulative effects on what the media and communications ecology will look like for much of the rest of the 21st Century.
Throughout the report we cite the sources but the entire dataset underpinning the analysis can be freely downloaded and used under Creative Commons licensing arrangements for non-commercial purposes with proper attribution and in line with the ShareAlike principles set out in the International License 4.0 (see here).
The Network Media Economy in Canada: Growth, Stagnation, Decline or Recovery?
The network media economy continues to expand considerably. Indeed, between 1984 and last year, it quadrupled in size, with total revenues rising from $19.4 billion to $78 billion (current $). Figure 1 below illustrates the trends.
Figure 1: Growth of the Network Media Economy, 1984–2015 (current $, millions)
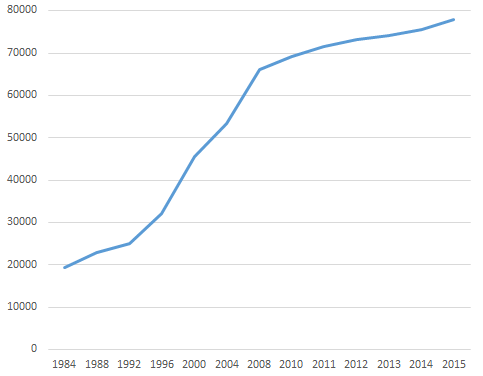
Source: see the “Media Economy” sheet in the Excel Workbook.
The media economy in Canada is often seen as a pygmy amongst giants, especially relative to the colossal size of the US media economy. While small beside the US, it must also be born in mind that it is actually amongst the biggest media economies in the world. Of the thirty countries examined in Who Owns the World’s Media, the sum total of which account for 90% of media revenues worldwide, for example, Canada ranked 9th (Noam, 2016, pp. 1018-19).
The media economy in Canada, as elsewhere, is also becoming evermore internet- and mobile-centric. “Platform media” (i.e. wireline, mobile wireless, ISPs and cable, satellite and IPTV) have grown much faster than the “content media” (i.e. television, radio, newspapers, magazines, music), especially those that depend on advertising. Platform media altogether accounted for nearly three-quarters of all revenue in 2015. To illustrate the point, while internet advertising has grown swiftly into a $4.6 billion industry and now represents 6% of all revenue across the media economy, internet access is close to double that size (see the “Media Economy” sheet in the Excel Workbook).
Figure 2 below illustrates the divergent development trajectories for the “platform media”, “content media” and “internet advertising” over the past thirty years.
Figure 2: Development of Platform Media vs Content Media and Internet Advertising, 1984-2015 (current $, millions)
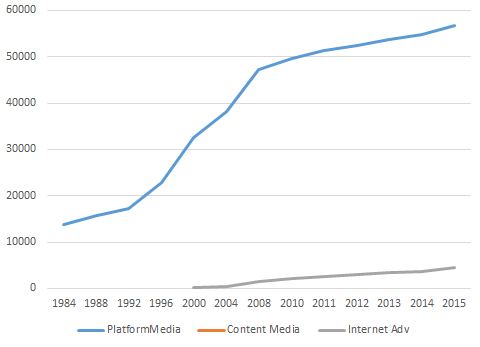
Source: see the “Media Economy” sheet in the Excel Workbook.
Figure 3 goes one step further by separately depicting each of the sectors covered in this report. While all areas of the telecoms-internet and media industries have grown substantially over the long-run, there are unique differences among them that merit further discussion.
Figure 3: Separate Media, Distinct Evolutionary Paths and the Network Media Economy, 1984–2015 (current $)
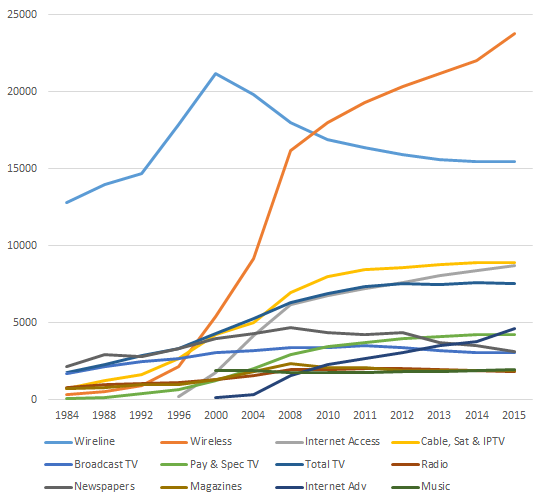
Source: see the “Media Economy” sheet in the Excel Workbook.
The rise of wholly new media sectors – e.g. mobile wireless, internet access, pay and specialty TV and internet advertising – has added immensely to the size of the network media economy. It has become much larger and structurally more complex as a result.
Another thing that stands out in Figure 3 is the sharp kink in the revenue lines since 2008 for all sectors. This reflects, first and foremost, the impact of the global financial crisis on the media economy. Growth has fallen to less than two percent per year on average ever since – half the rate of the previous half-decade. Switch the metric to inflation-adjusted, real dollars, and the size of the media economy has basically flat-lined since 2010 amidst uncertain economic times, albeit with a modest uptick last year.
The financial crisis and economic downturn thereafter have had an impact on all media, but the severity of the impact has varied considerably. After 2008, the earlier rapid pace of growth for mobile wireless, internet access, cable television, specialty and pay television channels and even internet advertising slowed. It declined outright for direct-to-home satellite, broadcast television, newspapers and magazines. The music industry, in contrast, went into decline earlier in the decade, before bottoming out towards the middle of the decade but appears to have turned a corner in the last few years (see Picard, Garnham, Miege, Vogel on the relationship between the fate of the media economy and the general economy).
Table 1 below provides a summary snapshot of which segments of the telecoms, media and internet industries have grown, stagnated, declined or recovered over the past few years.
Table 1: Growth, Stagnation, Decline and Recovery in the NME, 2015
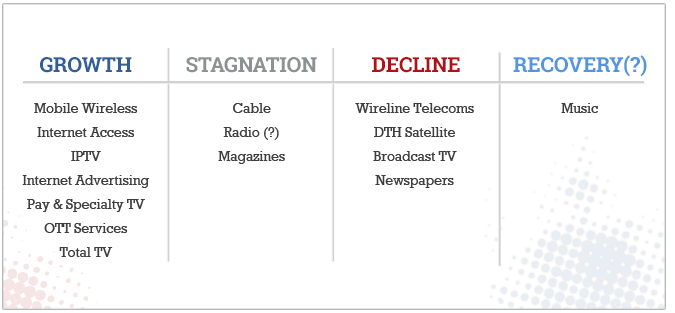
Source: see the “Media Economy” sheet in the Excel Workbook.
The Platform Media Industries: Bandwidth is King, not Content
The platform media industries have grown enormously, from $13.8 billion to $56.9 billion between 1984 and 2015. Table 2 below shows the trends. They account for approximately 73% of all revenue, and are thus the fulcrum upon which the media economy pivots.
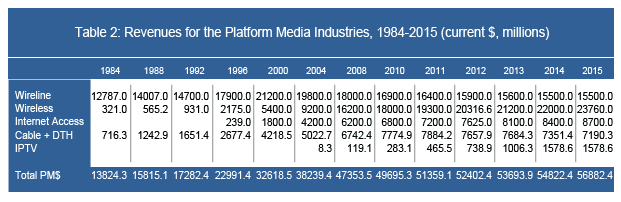
Source: see the “Wireline”, “Wireless”, “ISPs” and “CableSatIPTV” sheets in the Excel Workbook.
Mobile Wireless
Mobile wireless services have expanded quickly since the turn-of-the-21st century to become a critical cornerstone of the digital media ecology. During this time, revenue grew more than four-fold, from $5.4 billion to $23.8 billion last year. Mobile wireless revenue also over-took that of plain old wireline services in 2009, while in 2014 the number of Canadian households subscribing exclusively to mobile services for their voice calling needs exceeded those relying exclusively on landlines for the first time (CRTC, 2015, p. 1).
The growth spurt in mobile wireless services has tracked an expanding array of devices that people connect to wireless networks — feature phones, smartphones, tablets, wifi connected PCs, and so on – and a widening diversity of services. Mobile data traffic doubled in Canada between 2012 and 2013, and has continued to grow in the 40-60% range since. Cisco projects that mobile data traffic will quadruple yet again between now and 2020.
Like other sectors, revenue growth in mobile wireless slowed post-2008. Some have argued that this is the result of a maturing market (Church and Wilkins, 2013, p. 40). The pace of growth has slowed relative to the torrid pace of growth in the late-1990s and early 2000s, but this single-focus explanation is much too narrow and myopic.
The pace set during the early uptake of new technologies cannot be sustained forever, however, and mobile wireless has unsurprisingly followed the classic “S-pattern” of diffusion, i.e. slow adoption at first, rapid uptake as the new technology becomes mainstream, and a return to flatter growth thereafter as “late adopters” come on board.
However, more than just following the typical “technology diffusion curve”, the flattening of mobile wireless growth dovetails perfectly with the financial crisis. In fact, revenues for the network media economy worldwide declined between 2008 and 2009 and some of the world’s biggest media economies actually shrank in the next few years thereafter (e.g. Germany, UK, Italy and Spain), while others stalled (e.g. Japan and France) or grew only modestly (e.g. US, Canada and Korea). Mobile wireless revenues were not hit as hard as other media sectors by the collapse of the dot.com bubble in 2000 or the Anglo-European financial crisis (2007-2008ff), but the recent let-up in the pace of wireless growth amidst such conditions is not surprising.
In addition, the “mature market” explanation ignores the under-development of the mobile wireless market in Canada relative to all but a few of its OECD peers. The latest Statistics Canada data shows that 85.6% of Canadian households had a mobile phone subscription at the end of 2014. That same data, as Figure 4 illustrates, also demonstrates that access to wireless services, like other information and communications media in general, is highly unequal and stratified by income.
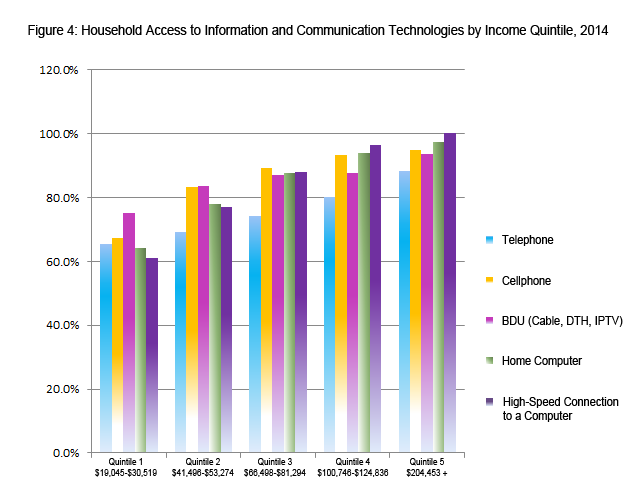
Note and Source: Lower and Upper bounds for the first to fourth quintiles are $19,045-$30,519k, $41,496-$53,274, $66,498-$81,294, $ $100,746-$124-836 and above $ $204,453k for the highest quintile. Statistics Canada (2016). Dwelling characteristics, by household income quintile, Canada, 2014, in Statistics Canada, 2016. Survey of Household Spending.
For households in the lowest income quintile, one in three have not subscribed to a mobile wireless service, while just a little over one-in-five of those on the next rung up the income ladder stand in the same position. At the opposite end of the income scale, however, mobile wireless penetration is nearly universal at 95%.
Rogers, Bell and Telus, and other observers content with this state of affairs, often obscure the reality of such low levels of mobile wireless penetration by touting the large proportion of mobile wireless subscribers who have smartphones. Taking into account the low rate of cellphone adoption in Canada, however, a large percentage of the relatively small subscriber base means that only 56% of Canadian households have a smartphone (OECD, 2016; also CRTC, 2015, Table 5.5.14). In other words, while smartphone adoption as a proportion of mobile phone subscriptions is high, the base from which things are being measured is low. As such, smartphone adoption in Canada is not a triumph to be celebrated but part of a bigger problem that needs to be redressed, i.e. low levels of mobile phone adoption, high prices, and significant inequalities in terms of adoption rates.
Consequently, rather than placing Canada at the top of international league tables, it ranked a lowly 27th out of 35 OECD countries for broadband wireless penetration as of December 2015 — far below levels in the US, UK, Denmark, Australia, and many other countries. Figure 5, below, illustrates the point. Moreover, this is a position that Canada has languished in for years (Benkler, Faris, Glasser, Miyakawa, Schultze, 2010; OECD, 2011).
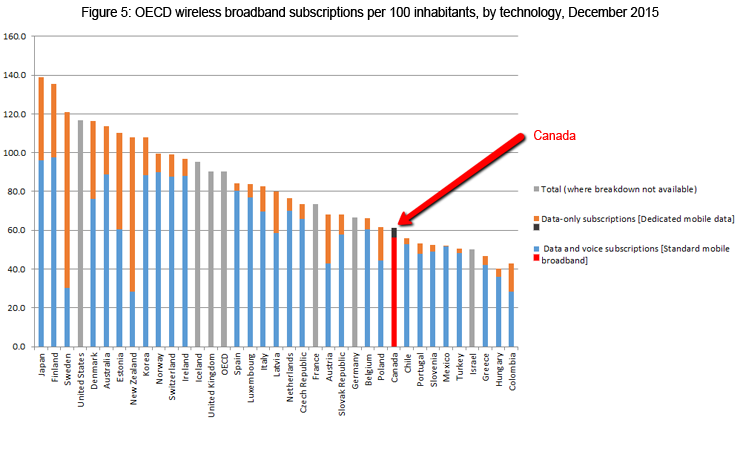
Source: OECD Broadband Portal.
Plain Old Telephone Service, Internet Access and Internet Protocol TV (IPTV)
While mobile wireless services are at the centre of the media universe, the wireline telecoms infrastructure – e.g. plain old telephone service (POTS), internet access, cable and IPTV networks – still remain central pillars in the network media economy. Altogether, they accounted for well over half of all platform media revenues (56%) in 2015. Mobile wireless services accounted for forty-two percent while direct-to-home satellite services made up the rest.
Plain old wireline telecom revenues were estimated to be $15 billion (current $) last year — far off their high-water mark of $21.2 billion in 2000, but with the steep drop-off seeming to have abated in recent years. Those decreases, however, have been offset by significant growth in internet access, IPTV and cable revenues. All of the major telecoms and cable companies have also moved significantly into data centres in the last few years, although the available data does not allow us to gauge the size of this sector or the companies’ revenues in it with any precision.
Internet access revenues have grown immensely in the past decade, similar to mobile wireless. Internet access revenues were $8.9 billion last year, up substantially from $8.1 billion the previous year. This was five times what they were at the turn-of-the-21st century ($1.8 billion).
However, as with mobile wireless services, this should not obscure the fact that high-speed and broadband internet access are far from being universal. According to the most recent Statistics Canada data, 85% of Canadian households had high-speed internet access by the end of 2014 (i.e. > 1.5 Mbps). Tighten the definition to include only broadband internet with download speeds more than 5 Mbps, however, and that number drops to 77% (see CMR 2015, Table 2.0.9). It is also the case that access to high-speed internet access is highly divided along income lines, as Figure 6 shows.
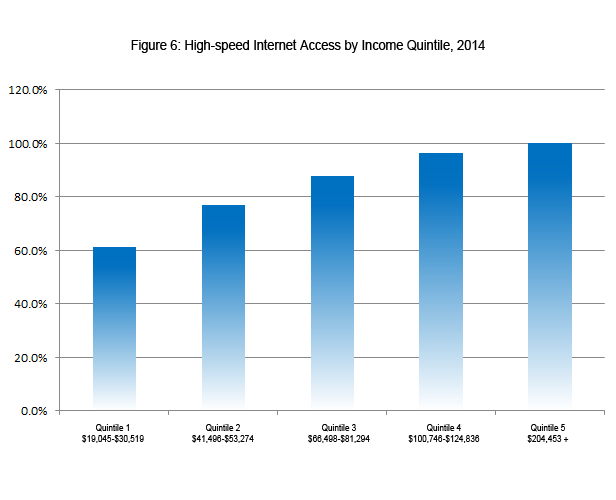
Note and Source: Lower and Upper bounds for the first to fourth quintiles are $19,045-$30,519k, $41,496-$53,274, $66,498-$81,294, $ $100,746-$124-836 and above $ $204,453k for the highest quintile. Statistics Canada (2016). Dwelling characteristics, by household income quintile, Canada, 2014, in Statistics Canada, 2016. Survey of Household Spending.
A key recent development has been the rapid growth of the telephone companies’ Internet Protocol TV (IPTV) services, the incumbent telcos’ managed internet-based tv services: e.g. Telus, Bell, MTS Allstream, SaskTel, and Bell Aliant. The number of IPTV subscribers has more than quadrupled in the last five years, to 2,401,416 IPTV subscribers at the end of 2015. Table 3 below show the trends.
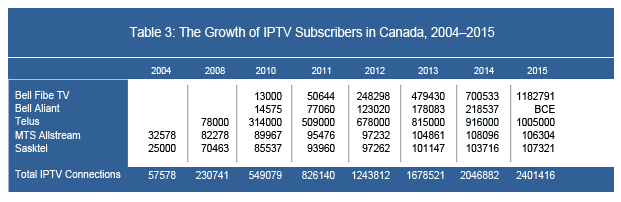
Source: see the “IPTV” data sheet in the Excel Workbook.
There has also been a corresponding sharp increase in revenues for the telcos’ IPTV services, from $1 billion in 2013 to $1.73 billion last year – again, quadruple 2010 revenue. Table 4 below shows the trends.
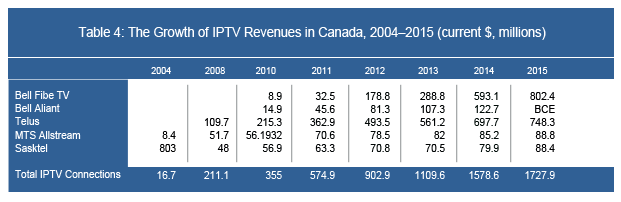
Source: see the “IPTV” data sheet in the Excel Workbook.
The subscriber and revenue figures reported in Tables 3 and 4 are slightly higher than those reported by the CRTC. This is likely because the CRTC’s data is taken from the end of August each year as opposed to the companies’ fiscal year-end, as we have done. The CRTC’s estimated “average revenue per user” (ARPU) is lower than those that the telcos cite in their audited annual reports as well. Lastly, the lack of consistent, full disclosure by both the telcos and CRTC further obscures the exact number. Nonetheless, the difference between our figures and those of the CRTC is small enough to suggest that both are close to the mark.
The growth of IPTV services is significant for many reasons. First, the addition of IPTV as a new television distribution platform brings the telcos deeper into the cable companies’ turf. By 2015, IPTV services accounted for roughly twenty percent of the TV distribution market by revenue and subscribers, a doubling of their market share in just three years.
The increased competition posed by IPTV has been the most significant in the western provinces where Shaw faces three companies that have been quickest to roll out IPTV services: Telus in Alberta and BC, SaskTel in Saskatchewan and MTS in Manitoba. From Ontario to the Atlantic, in contrast, Bell’s roll-out of IPTV services occurred later, softening the competitive impact on Rogers, Quebecor, Cogeco and Eastlink – until around 2013, that is.
Cable and satellite companies are losing subscribers to the telcos IPTV services as a result. Altogether, they have collectively lost more than half a million subscribers since 2011, hence the hand-wringing in some industry and journalistic circles about cord cutting. They have also seen revenue drop by more than 10% ($771.1 million) over the same span of time, as Table 5 illustrates.
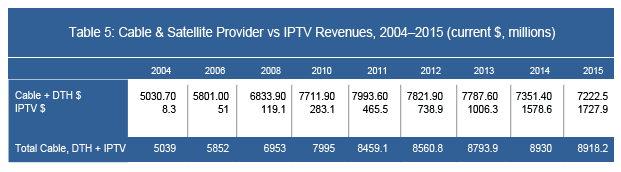
Sources: see the “IPTV” and “CableSatIPTV” data sheets in the Excel Workbook and the Methodology Primary.
Against the hew and cry about cord-cutting and industry pleadings for regulatory favours, and much journalistic coverage that uncritically repeats such claims, the losses of incumbent cable providers, mostly to the telcos’ IPTV services, must not be mistaken with an industry in peril (see the Miller Report, 2015 as an example of such claims). Indeed, almost all of the losses to the cable and DTH satellite TV providers have redounded to Telus, Sasktel, MTS and Bell’s IPTV services. In fact, the total number of cable subscribers has dipped by less than two-and-a-half percent since 2012. Viewed from another angle, the number of subscribers has slipped from 84.7% of households to 81% between 2010 and 2015 (CRTC, 2016). These losses are real, to be sure, but they are hardly the blood-letting that some might have us believe.
Revenues overall, however, have continued to climb, although in 2015 they stayed basically the same as they had the year before, as Table 5 above illustrates. This is because whatever subscriber losses have occurred have not only been offset by the growth of IPTV but steep increases in the subscription prices as well that have risen well-above increases in the consumer price index, as Figure 7 illustrates (also note the steep rise in internet access prices since 2010).
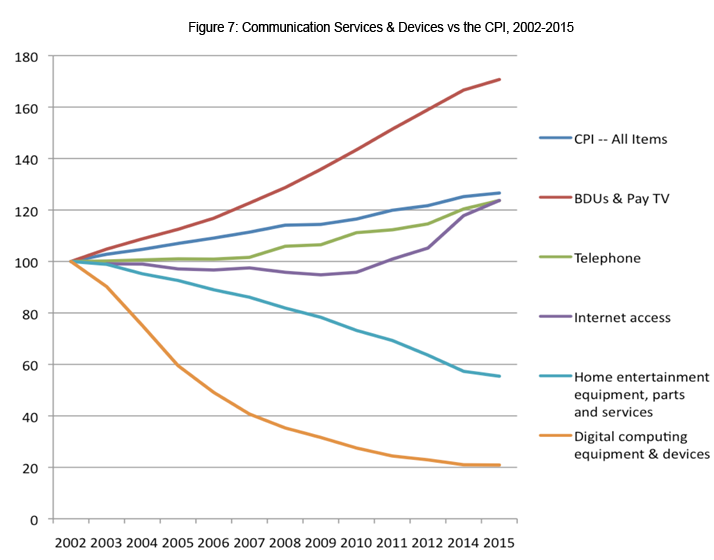
Source: Statistics Canada. Table 326-0020 – Consumer Price Index, annual (2002=100)
The trend indicated in Figure 7, in turn, partly justifies the CRTC’s efforts to promote the unbundling of cable TV packages and pick-and-pay options in its trilogy of “Talk TV” decisions last year – against the hew and cry of the culture policy and industry groups. The former want to retain and even expand the methods used in the past in the “age of the internet”, while the latter want the Commission to stand aside and let the industry do as it pleases, or for it to be dismantled altogether and its residual bits of its mandate handed over to the Competition Bureau (see, for example, the reports by the C.D. Howe Institute, the Fraser Institute, the Montreal Economic Institute and the MacDonald Laurier Institute, all in the last year, to this effect, and calling for the CRTC to be dismantled). Against those complaints, however, the CRTC’s efforts match these and other realities of the communications and media markets; they are also firmly in line with efforts taken by the FCC in the US as well as by regulators in Europe, both within countries and at the European Commission. The backlash from the industry and “cultural industries community” against the Commission has been ferocious, a clear index of the stakes being disturbed, but not unusual and also in line with similar responses seen abroad.
That said, there is no doubt, however, that duopolistic rivalry between the telcos and cablecos has intensified since 2011. While IPTV services are taking off in many cities across the country, a few things need to be kept in mind. First, it was the prairie telcos, followed by Telus, which took the lead in deploying IPTV in the early- to mid-2000s. Bell launched IPTV relatively late, first via its then affiliate Bell Aliant in 2009, before slowly rolling out the service in the high-end districts of Montreal and Toronto over the next two years — half a decade after MTS and SaskTel did so in the prairies. More cities have been added at a hastening pace since 2012. Subscriber numbers and revenue have risen significantly for the Bell Fibe service as a result. Bell’s slow start is due, at least in part, to its desire to minimize the impact of its IPTV roll-out on its existing investment in DTH satellite TV. It has turned the corner since, however, and last year it had more than a million IPTV subscribers; it has been the largest BDU in the country since 2014.
The telcos are finally making the investments needed to bring next generation, fiber-based internet networks closer to subscribers, mostly to their neighbourhood nodes and sometimes right to their doorsteps. If the distribution of television is essential to the take-up of next generation fibre optic broadband networks, as I believe it is, IPTV is a key part of the demand drivers for these networks (see below).
The rate of IPTV adoption in Canada is relatively high by international standards. About 17% of households in Canada subscribed to IPTV services by the end of last year. However, this lags far behind countries such as France (where uptake of IPTV reached 41% of households), Singapore (27%), Korea (30%) and the Netherlands (23%), as the UK regulator Ofcom notes, but is still higher than the US (10%), Japan (7%), Germany and the UK (8%), Spain (12%) and Australia (2%), for example (p. 164).
While Canada has done reasonably well with respect to IPTV, the picture changes for fiber-to-the-premise (FTTP) — the latest generation of broadband internet access technology. Only 7.4% of broadband connections in Canada use FTTP – less than half the OECD average (19.4), according to the most recent data (December 2015). In countries at the high end of the scale like Denmark, Finland, Norway, Sweden, Korea, Japan, in contrast, one third to three-quarters of broadband connections are fiber-based. Canada ranked 24th out of 35 countries on this measure as of December 2015, according to the OECD.
The following figure illustrates the point.
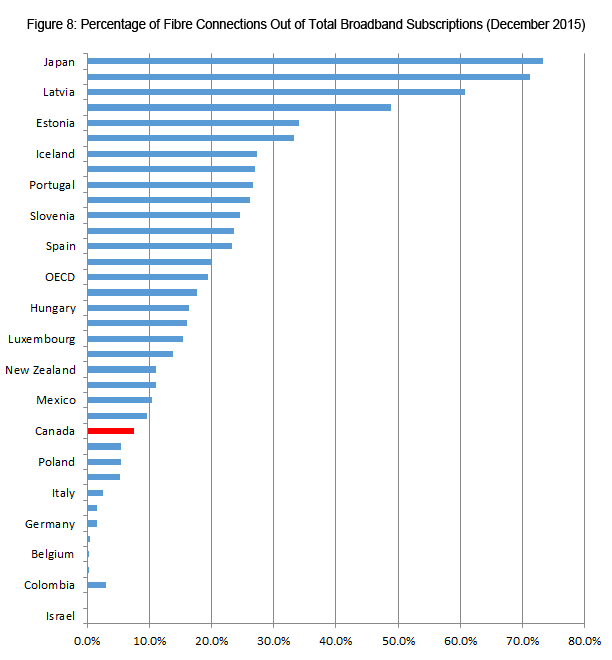 Source: OECD (2016). Broadband Portal.
In sum, when it comes to fibre-optic networks, the prairie telcos and Telus were early leaders, not Bell. Globally, Bell’s late turn to IPTV and FTTP in Ontario, Quebec and Atlantic Provinces has also dragged Canada down in the comparative league tables.
The general evolutionary pattern that we see replays a long-standing practice for new services to start out as luxuries for the rich before a combination of competitive market, public and political pressures turn them into affordable necessities for people at large (see Richard John with respect to the US, Robert Babe for Canada). Current ongoing debates over access to broadband infrastructure are the latest iteration of a very old story (Winseck Reconvergence, Winseck and Pike, John, Babe, Middleton). The outcomes of the CRTC’s current review of whether broadband internet service, and at what levels of speed and pricing, should be included as part of the universal and affordable communications services that Canadians can expect as a right rather than just what “the market” gives them will do much to address these old problems in light of today’s industrial realities and people’s communication needs (and wants).
The Content Media Industries
The remainder of this post looks at the content media industries: broadcast TV, pay and specialty TV, radio, newspapers, magazines, internet advertising and music. For the most part, these sectors have grown substantially over the long-run, but growth has been marginal, if at all, for most of these sectors since 2008.
In 1984, total revenue for the content industries was $5.6 billion; in 2015, it was $21.1 billion. In inflation-adjusted dollars, revenues basically doubled from $11.4 billion to $20.9 billion over this span of time. Growth was steady, with no discernible major uptick or downturn except since 2008, for reasons discussed above, when total revenue growth slowed to a crawl (on the basis of current $) or stalled (using real $). Figure 9 depicts the trends.
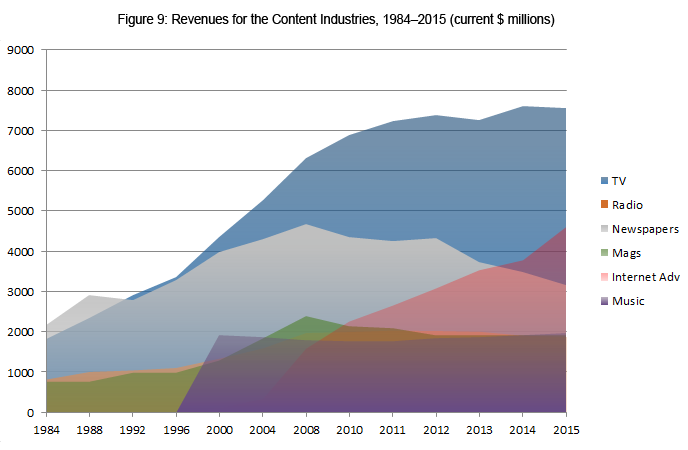
Sources: see the “Total TV”, “Radio”, “Newspaper”, “Magazine” and “Music” sheets in the Excel Workbook.
Trends in the content media industries tend to follow the twists and turns of those in the overall economy more tightly than the platform industries because they depend on advertising revenues rather than subscriber fees. And advertising revenue has gyrated in lockstep with the state of the economy over the half decade: plummeting by 7% from 2008 to 2009 followed by sizeable increases of 8.1%, 4.7% and 3.8% in 2010, 2011 and 2012, respectively, then shrinking again by 2% and another 1.7% in 2013 and 2014, respectively, amid ongoing economic uncertainty.
Perhaps more tellingly, advertising revenue on a per capita basis has fallen from $371 per person in 2008 to $354 last year, while for TV specifically, it fell from $102 per Canadian to around $94 (see TVB, 2015). Such trends fit the patterns described earlier perfectly (on recessions, advertising revenue and the media economy see Picard, Garnham, Miege and Vogel). Of course, this means that media that depend the most on advertising have been the hardest: broadcast TV, radio, magazines and newspapers.
The Rumoured Death of Television is Much Exaggerated
Broadcast TV
While advertising for broadcast television plunged in 2009 before rising again in the following two years, it has dropped greatly ever since, falling from $2.2 billion in 2011 to $1.8 billion in 2015. Total television advertising as a proportion of all advertising, however, has stayed steady over time at just under a quarter of the total (see here). However, that advertising has been moved away from broadcast TV to the specialty cable and satellite channels, e.g. TSN, RSN, the Cartoon Network, Discovery, etc.
Cut-backs by the previous Conservative Government to the CBC of $126 million since 2012, as well as an additional drop of $121.1 million in payments from the Local Program Improvement Fund since 2013, have compounded the woes facing the CBC (see the CBC, Annual Reports and the CRTC, CBC Aggregate Annual Return French and English for these years).
Overall broadcast TV revenues, i.e. including the CBC and its annual Parliamentary funding, slid from an all-time high in 2011 of $3,501.7 million to $3,081 million last year — a 10% decline. Since 2008, four local broadcast TV stations have closed: CHCA (Red Deer), CKNX (Midwest ON), CKX (Brandon) and Sun News (Toronto). In 2015 broadcast TV revenues stood, more or less, at the same point where they were in 1998.
Lay-offs and cut-backs are now a constant theme, and local news staff has been cut by an estimated 4%, according to the Reuters Institute (p. 80). Indeed, just in 2015, at least 1,200 full-time television and radio jobs were cut: 460 at Bell, 439 at Rogers, 244 at the CBC, and 129 at CHCH (see here, here, here and here). Furthermore, a study prepared for the Friends of Canadian Broadcasting and Unifor by Peter Miller (2015) estimates that if current policy trends persist up to half of the local TV stations in 56 small and mid-size cities across Canada, and up to 900 jobs, could be lost (p. 5), thereby further gutting the core of local broadcast journalism and programming.
It is precisely such conditions, and similar ones across the news media, as we will see further below, that have spawned recent reviews by the Canadian Heritage Parliamentary Committee and the CRTC on the state of local news in communities across Canada in the past year, each of which is struggling to come up with some kind of viable solution to the pressing problems these trends raise. In the meantime, some of these pressures will likely abate somewhat in the years ahead on account of the Liberal Government’s decision last year to inject $675 million in additional funds over the next five years into the CBC’s funding envelope. While this step reverses the budget cuts undertaken by the last government since 2012, it will not counter the effects of the significant decline in advertising revenue.
In sum, four points help to explain the stagnation and recent decline of broadcast TV:
- declining advertising revenue since 2011;
- budget cuts to the CBC;
- the phasing out of the Local Program Improvement Fund between 2012 and 2014;
- the big four commercial TV providers – Shaw, Bell, Rogers and Quebecor – shift of resources to fast growing pay, specialty and other subscriber-based forms of TV (i.e. mobile, IPTV), while edging away from broadcast TV (see the CRTC’s Communication Monitoring Report, pp. 122-127 as well as Individual Financial Summaries for a list of the 124 pay and specialty channels the big four combined owned as of 2015).
At the same time, however, crucial questions must be raised about why conditions in Canada appear to be so severe, especially relative to developments in the US and elsewhere? Indeed, while nowhere is broadcast TV enjoying anything like a “golden age”, it is also true that the severity of turmoil is especially pronounced in Canada.
Take, for example, the US, where approximately 10% of US television households were broadcast-only, according to the FCC’s most recent Competition in the Video Marketplace. There, “the total day share of viewing for broadcast network affiliates increased from 27% in the 2012-2013 television season to 29% in the 2013-2014 television season. Prime time rose 31 to 32%”. Broadcast TV advertising increased from $24.6 billion to $27.2 billion between 2012 and 2014 as well (see paras 116-119).
Looking further afield, Ofcom’s survey of fourteen countries reveals a mixed picture with generally stagnant funding for public service media as well as “varying results for advertising revenue”, but seldom are conditions as bad as they are in Canada (pp. 154-255). Indeed, advertising revenue improved for broadcast TV in 10 out of the 14 countries that Ofcom reviewed for the most recent year (2014), and in 8 out of 10 countries over the past five years. Again, nowhere, except Italy, was there a drop in advertising of the same magnitude as in Canada.
Why is this? Miller explains that it’s a function of policies in the US that are more supportive of local broadcasting (pp. 4-5). There is no doubt some truth in that because localism is a bedrock principle in US communications policy, and has been for much of the past century. However, that is far from a sufficient explanation.
For one, it ignores events in the UK and other countries. Second, and crucially, it completely ignores the extent to which the crisis in Canada is a function of the structure of an industry where all of the main commercial television services are owned by telephone companies. The under-development of broadcast TV in Canada reflects an era of unprecedented consolidation, as the next report in this series will show. This main issue, however, is not consolidation within the television industry (which can be seen in many countries around the world), but rather that Canada breaks ranks with its worldwide peers in terms of its extraordinarily high levels of diagonal and vertical integration across the network media economy (for a fuller elaboration of this claim, see CMCRP, 2016).
While we must be cautious about identifying any one cause for the dramatically different situations in Canada versus the US (and elsewhere), one key difference stands out: broadcast TV providers in the US (and elsewhere) are not nearly as integrated into the telecoms-internet sectors and specialty and pay TV services as they are in Canada. Other than Comcast’s ownership of NBC Universal, for example, none of the main broadcast TV ownership groups in the US are owned by telephone companies or BDUs. Indeed, broadcast TV ownership groups in the US are sizeable entities in their own right: CBS, Sinclair, TEGNA Inc., Comcast, E.W. Scripps, Gray, Nexstar, Univision, Walt Disney, Fox, and Media General. Other than Disney (the ABC network) and Fox, broadcast TV ownership groups do not also own a fleet of specialty and pay TV services – again, unlike Canada (see FCC, 2016, para 84).
As sizeable entities in their own right, these groups compete with one another rather than functioning as arms of the telecoms giants which operate with one eye fixed on their rivals and the other on ensuring that whatever competitive strategies they adopt do not side-swipe other aspects of their vertically-integrated telecoms-internet and TV operators, as is the case in Canada. Much the same holds true in Europe. And where there is vertical-integration between telecoms and TV, it is rarely on the scale that it is in Canada, and closer to conditions in the US, where a single entity displays such characteristics, while others stay focused on just the “media content” industries.
This means three things of critical importance. First, stand-alone broadcast TV services in the US compete vigorously with specialty and pay TV services as well as OTT rivals like Netflix, Hulu and Amazon Prime. As a result, “they have increased the amount of online offerings of their ad-supported prime-time programming on their owned-and-operated sites between 2014 and 2015” (see FCC, 2016, para 134). In fact, the catalogue of episodes they offered online “increased between 10.6 percent to 119.3 percent between the end of 2014 to the end of 2015” (see FCC, 2016, para 135). Notably, however, NBC (owned by Comcast), by contrast, still limits access to its online libraries only to people with a BDU subscription – much like its similarly structured counterparts in Canada.
Second, US, UK and European broadcasters and pay TV providers have been quicker to unbundle specialty and premium pay TV services from an underlying cable subscriptions in order to make them available OTT. Examples include Time Warner’s HBO, Disney’s ESPN, several services owned by CBS and Viacom, and some of the major sports league like the NFL and MLB. By not being vertically-integrated, and as “content media” providers only, these operators aim to get their content in front of as many people across as many platforms as possible without the concern that offering their services over the internet and mobile wireless connections might cannibalize the subscriber and revenue base of an affiliated BDU – at least not to the same degree, since BDUs are still their main source of revenue).
The contrast with Canada is striking, and it is this reality that underpins the CRTC’s TalkTV rulings, although one would be hard-pressed to discover such realities in the accounts provided by the Commission’s implacable foes. Looking ahead slightly, this point is driven home by the case of HBO. In the US, it is offered as an OTT service, but in Canada, where Bell owns the distribution rights, there is no such offering and smaller BDUs such as MTS complain bitterly about not being able to get distribution rights so as to be able to offer HBO to their subscribers.
Third, not only are all of the major commercial television services owned by telephone companies but there are no stand-alone mobile wireless operators left in Canada after Shaw acquired Wind last year, which is important because without a stand-alone, competitive mobile phone operator, prices for mobile phone service tend to be higher and data caps lower, and the cost of exceeding them steeper. The upshot is that low data caps and expensive overage charges deter the use of this new media to consume all forms of audiovisual media content, including broadcast TV (see Rewheel, 2016).
Consider the US, UK and EU, where there are major stand-alone mobile wireless operators such as T-Mobile, Vodafone, Hutchison and Free, for example, all of which function as fierce rivals to integrated wireline/wireless operators. Finnish consultancy Rewheel documents how stand-alone mobile or mobile-centric network operators that compete with groups that have both mobile wireless and wireline platforms offer more affordable data plans and data caps on 4G LTE services – i.e. those that are well-equipped to handle watching TV on wireless devices – that are between two and eight times higher than those of the diagonally-integrated groups (see Rewheel, 2016).
None of these points are discussed by the various reports prepared by Miller on behalf of the “cultural industries communities” (e.g. ACTRA, CMPA, Unifor, Friends of Canadian Broadcasting, etc.) or by the implacable foes of the CRTC and other policy makers at the Competition Bureau and the Department of Canadian Heritage (to say nothing of the courts and Cabinet that have been siding with regulators for the last several years). That none of the recent reports from the C.D. Howe Institute, the Fraser Institute, the Montreal Economic Institute or the MacDonald Laurier Institute addresses these structural realities while chastising policy and regulation as the source of the content media industries’ woes should be a major concern, and reflects the extent to which efforts are focused on changing government policies to support of industry interests rather than dealing with the structure of the network media industries and the biggest players in them.
Pay and Specialty (Subscription) TV
For all of the woes that really are affecting broadcast TV, the fact of the matter is that the overall TV universe is doing reasonably well, although again, not without issues that need to be addressed, and with all of the same realities just described bearing down hard on its evolution – even if blithely ignored by those who seek to, variously, maintain some semblance of the BDU-centric model of TV, or to push the CRTC aside in favour of standard competition law and minimal regulatory oversight, under the pretense that ‘letting the market rip’ will serve people well while letting Canadian telecoms and media companies compete with the internet hyper giants across the whole of the ‘digital ecosystem’.
Yet, climb down from the lofty heights of such policy rhetoric and one discovers some fundamental changes taking place within the TV industry, and new centres of growth and development. The real growth in television has been in subscriber fees and the pay-per model of TV, as is the case in many countries around the world.
The UK regulator, Ofcom, underscores the point: “Subscription revenues [worldwide] continue to be the key driver of this growth, rising by 5.4% to reach £125bn, just over half of total revenue”, and a cumulative annual growth rate of 5.3% over the last five years (Ofcom, 2015, pp. 139-141).
Once we widen the lens to look at the fastest growing areas of television it is clear that the chorus of voices chiming in on the supposed “death of television” are wide of their mark: this is evident once we consider how well specialty and pay TV services, OTT services, mobile TV, IPTV, and television distribution have done. Indeed, pay and specialty TV services have been fast growing segments since the mid-1990s, and especially so during the past decade, even if that pace has abated in the last year or two.
Specialty and pay TV revenues eclipsed those of broadcast TV in 2010, when revenues reached $3,474.6 million. By 2015, revenue for this segment of the TV universe had grown to $4,254.6 million, similar to the amount in the previous year. The new engine of growth is now shifting more and more to OTT services, although these remain under-developed in Canada relative to trends in the US and many countries in Europe and elsewhere, for the reasons outlined above.
The Total Television Universe
In order to complete the picture of the “Total TV Universe” we need to add in OTT services. That, however, is difficult given the dearth of publicly available information, from either Netflix, the most important OTT provider in Canada, or from Bell as well as Rogers and Shaw’s CraveTV and shomi, respectively (although the latter have announced that shomi will be closed down in short order). However, we can arrive at a reasonable estimate of subscribers and revenues in Canada based on information from Netflix’s annual reports.
Some reports put the total number of Netflix subscribers in Canada at the end of 2015 at 4.7 million, but that figure seems too high. For one, it would mean that the number of Netflix subscribers in Canada is significantly higher than in the US on the basis of population. It is also substantially higher than levels recently reported by the New York Times and IHS Screen Digest, and by MTM/CBC over the last few years.
Moreover, the fact that the reports making such claims are proprietary means that their results and methods are not public, and thus beyond critical scrutiny. Given the extent to which knowledge is mobilized in this domain for specific interests and policy ends, these are good reasons to raise serious questions about these claims.
Adjusted for differences in population, and using the number of subscribers that Netflix reports for the US as a proxy for Canada, we can estimate that there were 4.1 million Netflix subscribers in Canada at the end of 2015. This comports with data from IHS, which reported 3.1 million Netflix subscribers in Canada at the end of 2014, while estimating that the figure will rise to 5.3 million by the end of 2015, leaving an average between the two years of 4.2 million. Assuming linear growth over the year, and an ARPU of $10.40 (CDN), as reported in Netflix’s Annual Report, ends up with an estimate of Netflix revenue of $447.1 million for 2015 (pp. 17-19).[5]
Adding broadcast TV, specialty and pay TV services and OTT services together to get a sense of the “total television universe” revenue yields an unmistakable picture: total TV revenue quadrupled from $1,804.3 million in 1984 to $7,566 million in 2015. Using “real dollars”, total TV revenues doubled from $3.7 billion three decades ago to $7.5 billion last year.
The decline in advertising revenue for broadcast TV has been significant, but that has largely been offset by the growth of specialty and pay television services that rely on both subscriber fees and advertising, and of OTT services in particular. The advent of Netflix has added to the size and diversity of the television market in recent years, and kept revenue on an upward trend, although overall revenue has been flat in the two most recent years. Based on our estimates, Netflix’s share of all revenues has grown from zero five years ago to nearly 6% last year – but more on this in the next report in this series.
The fact that TV services based on subscriber fees rather than advertising continue to grow briskly even in the face of the economic downturn reveals a crucial point: the TV business has shifted to the direct pay-per model. Subscriber fees, as noted at the outset of this report, are now the centre of the media universe, not advertising. The pay-per model is more resilient to economic shocks compared to the hyper-twitchy nature of advertising revenue, however, they also raise pressing questions in terms of affordability and inequalities of access after nearly a century of policies that have tried to foster universal and affordable broadcasting services.
If we add cable, satellite and IPTV distribution to this portrait the trend is even more undeniable. The addition of new services, first DTH in the 1990s, accompanied by the steady growth of cable TV since that time, and the quick growth of IPTV in recent years, means that the TV distribution market has grown immensely. Indeed, sum up all of the elements of “Total TV” and TV distribution sectors and the whole of the television marketplace accounted for nearly $16.5 billion in revenue in 2015. To put it another way, in 1984, all segments of the TV industry combined made up 13% of revenue across the network media economy. That figure is now 21%. While this is a slight dip relative to the past few years, one thing is clear: television is still central to the increasingly internet- and mobile-centric media universe. Table 6 illustrates the trends.
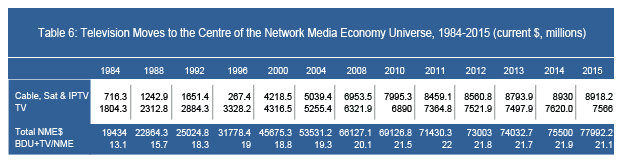
Sources: see the “Total TV” and “CableSatIPTV” sheets in the Excel Workbook.
A broader analysis reveals a somewhat mixed picture, but one that still hardly fits the image of television being in dire straits. The time people spent watching television has stayed remarkably steady. It even grew between 2010 and 2011, but has fallen across all age groups by 4 percent since then. However, that decline has been more than offset by the increase in television viewing over the internet and mobile wireless connections (CRTC, CMR, Figure 4.2.15).
The latest Canadian Media Usage Study also indicates that time spent watching television weekly in Canada has grown substantially during the past decade-and-a-half. According to that study, “[o]ffline media have experienced declines in their ability to generate weekly reach over the last 14 years. The TV medium is the exception” (p. 4).
According to the Canadian Media Usage Study, television viewing has grown by roughly 200 minutes per week on average during this period. Viewing time per week did slide, however, by about twenty minutes per week per capita in the last year (p. 7). Last year’s version of that study also indicated that the time people are spending on the internet using a variety of devices – PCs, smartphones, tablets – has come to match the time they spent watching TV on the traditional screen (p. 2). It did not, however, indicate how much of the time spent using the internet was actually spent watching television on a PC, smartphone, tablet or some other device.
Ofcom’s report is also useful in this regard, and can be summarized as follows: broadcast TV viewing in 2014 relative to the year before is down slightly in half the fourteen countries it examined, but up in the other half, while the take up of pay TV services is up in all cases except three over the most recent five-year period (pp. 170-172).
In a 2012 article, Why the Internet Won’t Kill TV, Sanford C. Bernstein & Co. senior analyst, Todd Juenger, also shed light on the point regarding increased TV viewing across media platforms and devices. As he observed in, “so far teens are following historical patterns, and in fact, their usage of traditional TV is increasing”. Their use of computers, smart phones and tablets is adding to, rather than taking away from, how much they watch television. As Marshall McLuhan once put it, old media are not wiped out by the new but rather become the content of new media.
Data from internet equipment manufacturers Cisco and Sandvine also suggests that television and online video are driving the evolution of the internet, with more than half of all down-stream internet traffic now accounted for by Netflix and Youtube. Netflix alone accounted for a third of all internet traffic in North America at the end of 2015 (p. 4). Internet traffic also ebbs and wanes over the course of a day in ways that closely match traditional television viewing patterns. Elsewhere, I have called this the rise of the prime time internet.
The proliferation of devices is re-arranging the time and space/place for television in people’s lives. That Netflix is engineered to be watched on 800 devices highlights the point. To be sure, watching television the “old fashioned way” is on the way out, but this is largely being offset by changes in how people watch television. In this regard, watching television over the internet and via mobile devices has resulted in television viewing time remaining relatively constant over time.
Of course, this does not mean that that life is easy in the television business. Indeed, all of its constituent elements continue to have to come to terms with an environment that is becoming structurally more differentiated because of new media, notably IPTV and over-the-top (OTT) services such as Netflix, and on account of major changes in how people use the multiplying media at their disposal.
Incumbent television providers have leaned heavily on the CRTC and Parliament to change the rules to bring OTT services into the regulatory fold, or to weaken the rules governing their own services, on the grounds that such services threaten their commercial viability and the economics of the Canadian television system. Others are also pushing hard to apply a levy to internet access and mobile wireless services in support of Canadian content, and to selectively lift data caps for Canadian content while applying them to “foreign” TV and everything else people do with the internet and their mobile phones. In short, while strange bedfellows in the best of cases, the incumbent, vertically-integrated telecoms and TV service providers and reinvigorated cultural nationalists are rallying around the idea that preserving the BDU-centric TV model for as long as heavenly possible is a wise thing to do (see Bell’s submission to the CRTC’s Talk TV proceeding, notably pp. 22-24 and the Miller Report (2015b) commissioned by the ACTRA, CMPA, Writers Guild of Canada, the Directors Guild of Canada, the Friends of Canadian Broadcasting and Unifor).
At the end of the day, clarion calls regarding the “death of television” are far-fetched. Rather than cannibalizing the revenues of the television industry, developments in OTT services and new modes of consumption using the internet, IPTV and mobile wireless services have added to the size of the pie. Watching TV online has become a core activity for denizens of the internet- and wireless-centric media universe. In fact, such activities are driving the uptake and use of mobile wireless and internet services. This is why Rogers, Telus, Shaw, Bell and Videotron are all using television to drive the take-up of 4G wireless services, internet access and IPTV.
To paraphrase Mark Twain, rumours of television’s demise are greatly exaggerated.
Internet Advertising
In absolute terms, overall advertising spending in Canada has stayed relatively flat for the past seven years. On a per capita basis, however, it has fallen significantly, from $371 per person to $354 over the same period (see TVB, 2015). Whatever growth has taken place in absolute terms has accrued almost entirely to internet advertising. Thus, in 2015, internet advertising revenue grew to $4.6 billion, up from just over $3.8 billion a year earlier and $1.6 billion in 2008. At the beginning of the 2000s, internet advertising accounted for a paltry $141 million. Similar to wireless services, however, internet advertising revenue continues to grow quickly, although even it has slowed since the onset of the financial crisis.
The distribution of internet advertising, however, is also becoming more and more concentrated amongst a relatively small number of internet companies. According to the Internet Advertising Bureau, for instance, in 2009, the top ten internet companies took 77% of all internet and mobile advertising revenue; by 2015, the number had risen to 86% (IAB, 2016, p. 9).
Of course, Google and Facebook are in a league of their own, with an estimated two-thirds of total internet advertising revenue (see the “Top 20 w Telecoms” sheet in the Excel Workbook. With estimated revenues of $2,302 million and $757.5 million, the two internet behemoths accounted for 3% and 1% of all revenues across the network media economy, respectively.
On this basis, Google ranked as the sixth largest media company operating in Canada in 2015, after Bell, Rogers, Telus, Shaw and Quebecor, in that order. Its revenues were greater, however, than the long-standing and familiar faces of the CBC, MTS, Cogeco, Sasktel, Torstar, Postmedia, Eastlink, Power Corporation (Gesca) and the Globe and Mail.
For its part, Facebook had an estimated 19.9 million users in Canada at the end of 2015. With each Canadian user worth about $30 to the company a year, Facebook’s revenue in Canada for 2015 can be estimated as having been around $757.5 million, or roughly 17% of internet advertising revenue – a sum that gives it a modest place in the overall media economy in Canada and a spot among the top twenty telecoms-internet and media companies (Facebook, Annual Report 2015, pp. 35-37).
While it is commonplace to throw the digital media giants’ incursions north of the 49th parallel into the mix of woes ailing traditional media in Canada, the impact of Google and Facebook are limited mostly to three areas: newspapers, magazines and music. For the first two, this is because of their direct impact on advertising revenues, while for music it is due to how online aggregation and distribution, as well as the culture of linking, affects the music industry. The concluding sections of this post sketch out trends in each of these domains.
The Music Industry
While many have held up the music industry as a poster child of the woes besetting “traditional media” at the hands of digital media, the music industry in Canada is not in crisis. The picture over time, however, is mixed but seemingly getting better from a commercial standpoint.
Trends in Canada appear to be in line with those worldwide. While the International Federation of Phonographic Industries noted in 2013 that it was the second year in a row in which music industry revenues increased (pp. 5-9), that seems to have been premature and over the next two years it indicates that revenues had stabilized (IFPI, 2015, p. 5). The IFPI’s latest report, however, offers an upbeat assessment, pointing to appreciable growth after two decades of declining or flat growth. While the details the IFPI offers are sketchy, the industry’s main lobby group points to the widespread availability and uptake of commercial music downloading and streaming services, the diversification of revenue sources, stronger copyright laws, and an industry that has met the need to transform itself in light of new realities after having clung to the past for years. In Canada, SOCAN, the association representing music composers, writers and publishers, boasted “a banner year” and “record revenue” in 2015, with future prospects being bright (pp. 1 & 8).
The sum of all revenues from the main components of the music industry – i.e. recorded music, digital sales, concerts and publishing royalties – indicates that the music industry revenues drifted steadily downwards from $1,889.7 million in 1998 to $1,769.8 million in 2011. Revenue began to rise again in 2012, however, and has continued to crawl upwards gradually ever since.[6]
What has fundamentally changed, however, is the composition of the revenue sources over time that make up the total. Indeed, while those who shout from the rooftops about the “death of the music industry” point to the undeniable plunge in revenue from recorded music sales this ignores the reality that the music industry consists of four interlocking components: (1) recorded music sales, (2) publishing royalties, (3) concerts and (4) internet and mobile devices. While recorded music revenue has plunged over the fifteen or so years, the other components have seen a substantial, and offsetting, rise in revenue.
Figure 10, 11 and 12 illustrates the transformation of the sector over time away from an industry centred on recorded music to one where concerts, the internet and mobile devices, and publishing play key and growing roles.
Figure 10: Composition of Total Music Revenues, 2000
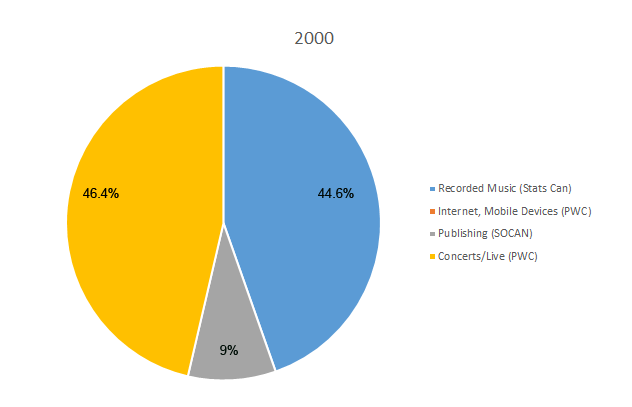
Figure 11: Composition of Total Music Revenues, 2006
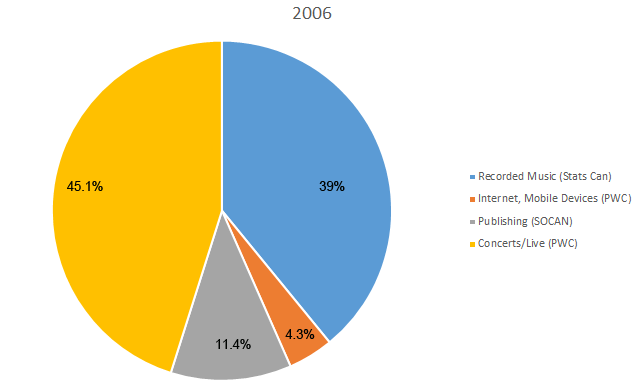
Figure 12: Composition of Total Music Revenues, 2015
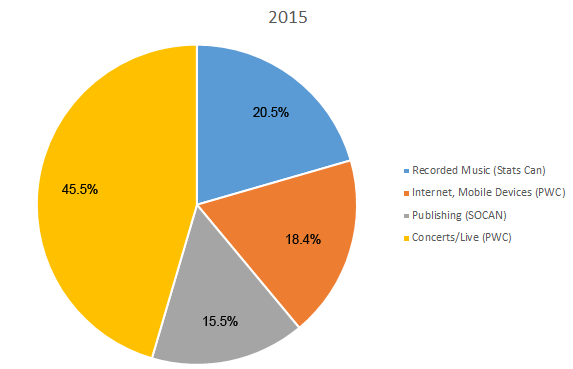
Sources: Recorded Music from Statistics Canada, Sound Recording and Music Publishing, Summary Statistics CANSIM TABLE 361-0005; Sound Recording: data tables, October 2005, catalogue no. 87F0008XIE; Sound Recording and Music Publishing, Cat. 87F0008X; Publishing from Socan, Financial Report (various years); Concerts and Internet from PriceWaterhouseCooper, Global Media and Entertainment Outlook (various years); USD converted to CDN$ using Bank of Canada Year Average of Exchange Rates.
In short, there is and has been no crisis in the music industry. In fact, conditions in Canada now mirror those in the music industry worldwide, with the past few years indicating a slight uptick in revenues and hence a pathway to recovery clearly in sight. To be sure, certain elements within the music industry – recorded music, for instance – have suffered badly, but publishing has grown substantially in the past several years. Digital/online/mobile revenues have exploded and concerts have become a crucial cornerstone of the industry. In short, this is a story of an industry being recomposed along new lines versus an industry in crisis. Such lessons may hold for other media as well.
As the IFPI stated in it 2013 Digital Music Report, “the music industry achieved its best year-on-year performance since 1998” (p. 5). And in 2014, the same publication noted, “Recorded music revenues in most major markets have returned to growth” (p. 5). Last year, the IFPI struck a more measured note but this year it was again offering a more upbeat assessment, the upshot of which is that the lingering sense of an industry is in crisis is slipping into the past:
. . . After two decades of almost uninterrupted decline, 2015 witnessed key milestones for recorded music: measurable revenue growth globally; consumption of music exploding everywhere; and digital revenues overtaking income from physical formats for the first time. These are positive metrics of accomplishment. They reflect an industry that has adapted to the digital age and emerged stronger and smarter (IFPI, 2016, p. 5).
One reason for this rekindled yet measured optimism might be because of all the media covered by the network media concept, the music industries embraced digital/internet sources of revenue earlier and more extensively than any other. Worldwide, already by 2012, the industry obtained about 15% of its revenues from online, mobile and digital sources, compared to single digit figures for newspapers and television. In other words, after having suffered the blows from the onslaught of the internet and piracy since early in the game, the music industry was out in front of others in embracing the realities of an ever increasing internet- and mobile-centric media world.
Radio
Radio stands in a similar position to the music industries a few years ago. Revenues grew until peaking in 2011: $2,025.6 million (including the CBC annual parliamentary appropriation). They have drifted downwards since. In 2015, revenue was $1,1869.4 million (current dollars). Change the measurement from to real dollars, however, and the picture changes, with revenue declining from $2,117 million in 2010 to $1,845.8 million in 2015 – a more substantial fall of 13% (see the “Radio” sheet in the Excel Workbook).
Magazines
Magazines appear to be an instance where there was a steep drop in revenue after peaking in 2008 at $2,394.4 million, before falling to $1,922.2 million in 2012. Fast forward to 2015, however, and revenue was still basically the same at $1,929 million – a drop of 19% from the peak, to be sure, but also seeming to have stabilized over the past four years (see the “Magazine” sheet in the Excel Workbook).
Newspapers
Perhaps the most dramatic tale of doom and gloom in the network media economy comes from the experience of newspapers. In earlier versions of this report, and other posts, I have been skeptical of claims that journalism is in crisis. I still am but the idea that circulation and revenues are in long-term decline, and the industry as well as the nature of journalism as a profession, are in turmoil, is hard to deny.
Making sense of the messy situation that is the contemporary newspaper industry is not easy. Data for the industry, as one industry insider who tallies up the data told me, are “a mess”. As ways of reading the newspaper change to include the internet, tablets and mobile devices, the notion of circulation has had to change, but so too have definitions of the “daily newspaper” been altered to fit the new reality in which many so-called dailies don’t actually publish every day of the week but just four or more. Even the simplest of questions, therefore, like, “What’s a daily newspaper?”, have no easy answer.
The extent of these conceptual and empirical difficulties makes it hard to keep a standard measure of newspaper revenues over time. Nonetheless, using a mixture of data from Newspaper Canada, Statistics Canada and corporate annual reports, we can get a reasonably good portrait of the industry over time and its main players.
On the basis of revenue, the evidence is clear: it peaked between 2006 and 2008 at around $4.7 billion, but has plunged ever since. Last year, total revenue was a little under $3.2 billion – a loss of nearly a third of all revenue in less than a decade. Table 7 below illustrates the trends.
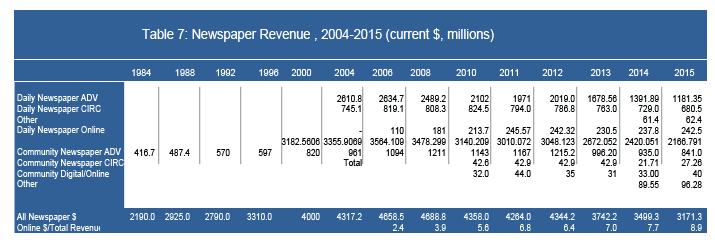
Sources: see the “Newspaper” sheet in the Excel Workbook for industry revenues back to 1984. Newspaper Canada from 2000 onwards; Statistics Canada before. The CMCR Project’s Methodology Primer and additional thoughts on sources and method offers further discussion on the methodological issues at play.
In real dollar terms, the drop is steeper and longer in the making. From this angle, newspaper revenues peaked in 2000 ($5,299 million), drifted downward until 2008 ($4,984.2), and then fell off a cliff to reach $3131.3 million last year – a long, drawn out plunge of over 40%. Digital/internet revenues have increased over time but not even close to being enough to replace the revenues lost. By 2015, they constituted 9% of all newspaper revenue. While this is an increase in percentage terms, given that the revenue base has shrunk, in absolute terms, digital/online revenue has hovered around the $230-245 million range over the last five years, as Table 7 shows.
The tough times can also be seen in the fact that since 2008, nine paid dailies and thirteen free dailies have closed, while another sixteen have scaled back their weekly publishing schedule from six or seven days to four. This is the most clear-cut case of a medium in decline.
The punishing effects of these trends even in just the last two years (i.e. 2014-2015) are clear:[7]
- All major newspaper publishers have seen steep revenue losses: Torstar (16%), Postmedia (21%), Quebecor (12%) and the Globe and Mail (18%) (based on estimates and adjustments for ownership changes);
- Reduced publishing schedules across the Postmedia chain adopted in 2012 (the Calgary Herald, Edmonton Journal and Ottawa Citizen) and previous years (e.g. the National Post) have been maintained and are now the norm at these papers;
- eighteen positions were cut in 2014 at the Globe and Mail (i.e. nine editorial, three photographers, three copy-editors and three others, bringing the number of lay-offs to 100 since 2012); plans to have editorial staff write “branded content” for advertisers met stiff resistance from journalistic staff and were dropped; new voluntary retirement programs for journalists and editorial staff were put in place at the Globe and Mail with the goal of reducing staff by about 60 (here and here);
- lay-offs by Postmedia of at least a half-dozen journalists and editors in its Parliamentary Bureau and elsewhere across the chain, and a standing offer of buy-outs and early retirement packages in place;
- twenty lay-offs at the Halifax Chronicle-Herald, while staff at the paper have also been on strike for must of the last year;
- lay-offs of nine editorial and photographic staff across the Brunswick News chain in the Maritime provinces;
- Postmedia struck a deal to acquire Quebecor’s chain of six major urban dailies, 27 community dailies, 140 weeklies, the 24 Hours free papers in Toronto and Vancouver adn a variety of websites for $306 million (a massive write down from the $983 million Quebecor paid for the papers when it bought them in 1998). The transaction was approved by the Competition Bureau in 2015;
- Six French papers in Quebec (Le Soleil, Le Nouvelliste, Le Quotidien, La Tribune, La Voix de l’Est, Le Devoir) were sold by Gesca/LaPresse to Group Capitales Médias in March 2015;
- La Presse announced the elimination of 102 full-time staff positions and fifty-six in September 2015;
- several small dailies stopped publishing: Kamloops Daily, Vernon Morningstar Daily, Alberni Valley Times and Peace Arch News Daily, and Metro London, Metro Saskatoon and Metro Regina and the Dawson Creek Daily News merged with the Alaska Highway News;
- some newly emerging journalistic organizations have begun to bulk up. iPolitics had 15 full time journalists, five staff and a number of free-lancers, for example, as of 2015.
Taking a broader view that includes broadcasting, Romayne Smith-Fullerton, of the Faculty of Information Studies at Western University, says that “in the last seven or eight years, we’ve lost more than 10,000 journalism jobs”. The idea that all of this is part of a crisis of journalism has underpinned a Canadian Heritage Parliamentary Committee and the CRTC on the state of local news in communities across Canada in the past year as well.
The most systematic attempt to keep track of all of these changes is a project led by Ryerson University and University of British Columbia professors April Lindgren and Jon Corbett. Their interactive Local News Map chronicles the closures and cutbacks at newspapers and broadcast stations across the country, but also the emergence of new ventures and recent hires that effect the production of news as well (also see Watson, 2016).
Another significant other change to take place in the last five years is the extent to which daily newspapers have been put behind paywalls. Prior to 2011 there were no significant dailies with paywalls; two years later, there were 27 dailies accounting for roughly 45% of daily circulation were behind paywalls. By 2015, the number had grown to 38 dailies representing nearly 60% of daily circulation behind a paywall, although the Toronto Star reversed course and dropped its paywall last year when it came out with its tablet-centric StarTouch version of the newspaper for the internet. In sum, paywalls are now a key feature of the daily newspaper landscape in Canada, and at a rate that is considerably higher than in the US or the UK (see here).
Table 8 illustrates the point.
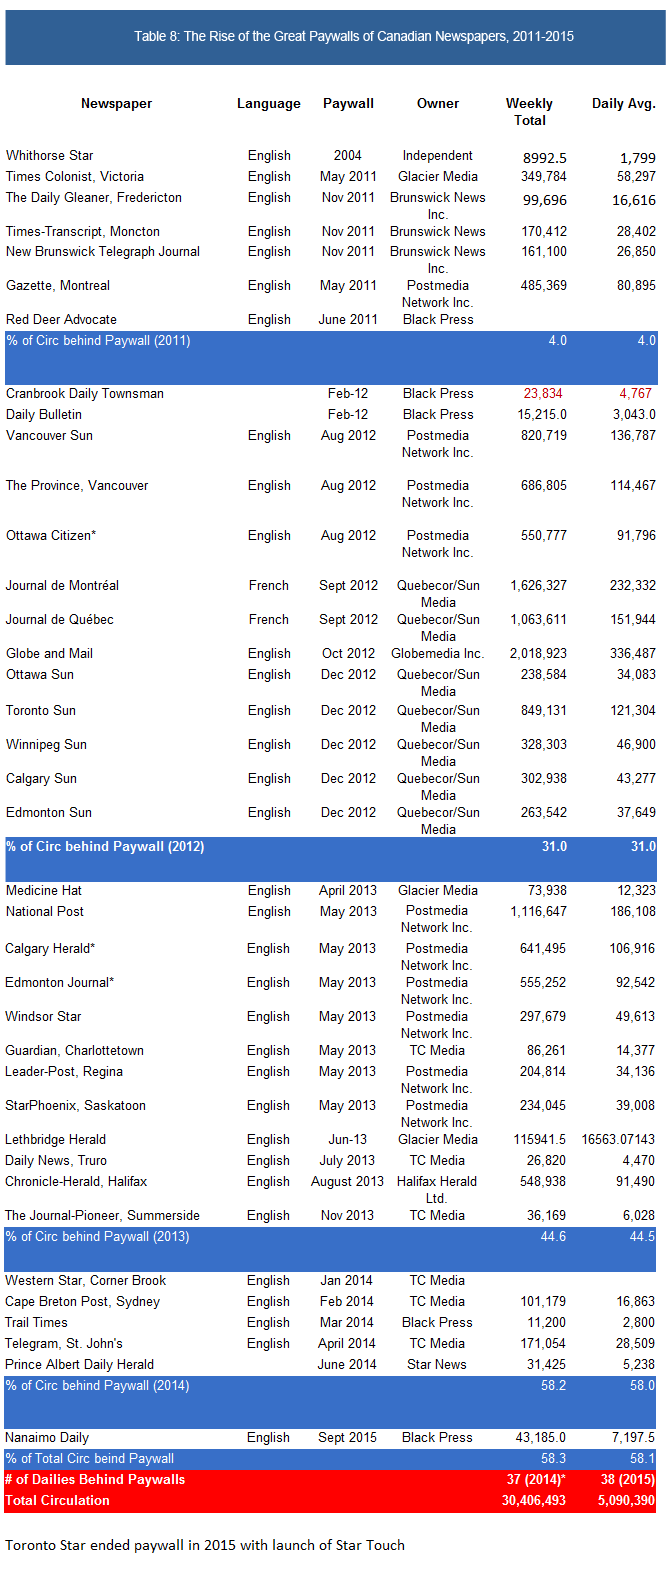 Sources: Newspaper Canada 2015 Daily Circulation Report.
The extent of cut-backs in the number of journalists and newspaper staff, and the fact that most daily newspapers are now behind paywalls but without generating sufficient revenue to come even close to offsetting the losses, all add to the image of a “crisis of journalism”. Indeed, in light of the run-of-events reviewed thus far, it is hard to imagine that things are otherwise. But are things really as they seem?
Maybe not. For several years I was reluctant to agree that newspapers were in crisis, mostly because I felt that the trends had not been long enough in the making to draw a firm conclusion one way or another, and because I saw many of the wounds that the industry suffers as having been self-inflicted by two decades of consolidation, bloated debts, and timid approaches to new technology and new markets. I have changed my views somewhat over the years, however, as evidence of the severity of the economic woes besetting the industry continued to pile up.
I have come to agree more with those like Yochai Benkler, who argue that we are in a period of heightened flux, not catastrophe. Like his observations a few years ago in relation to the US, so too in Canada can we take some respite from the emergence of a diverse new crop of:
- commercial and donor supported, internet-based approaches to journalism and public commentary (e.g. iPolitics, National Observer, Canadaland, Blacklock’s Reporter, the Tyee, Huffington Post, Buzzfeed, Vice, AllNovaScotia, Policy Options, etc.),
- the revival of the partisan press (e.g. Blogging Tories, Rabble.ca, Rebel.ca)
- a few non-profits and cooperatives (e.g. the Dominion),
- a larger role for academic experts who are bringing their specialized knowledge into the public domain like never before; and
- citizen journalists.
Whether these changes will ultimately prove to be a boon for a free press, however, remains to be seen and I am considerably more skeptical on this point than Benkler. That they are taking hold, however, is promising. So, too, is the fact that most of these ventures have been launched by professional journalists. They have broken several major stories. Some have specialized expertise like iPolitics, Policy Options and the Wire Report. This new raft of ventures run by professional journalists, and flanked by a renewed partisan press, lively public conversations led by academic experts and citizen journalists, suggests that there is a healthy dose of good news over and against the steady flow of bleak images of an industry otherwise in peril.
Perhaps most strikingly, that the crisis narrative is probably overwrought can be seen from data on the number of full-time journalists over the past three decades. While the steady drumbeat that “journalism is in crisis” narrative leads one to suspect that the picture is dire, the number of full-time journalists in Canada has not plummeted. In fact, it has actually crawled (stumbled?) upwards over time. Figure 13 illustrates the points.
Figure 13: Journalists vs the PR, Advertising and Marketing Professions,
1987-2015
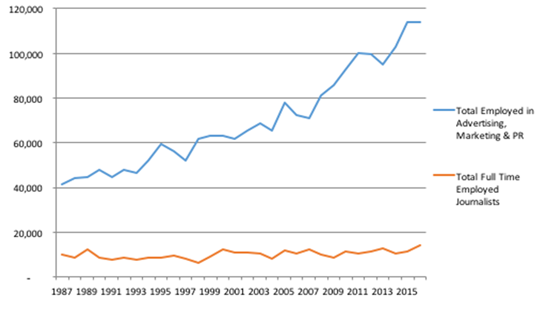
Sources: Statistics Canada (2016) Employment by occupation: 1123 Professional occupations in advertising, marketing and public relations and Statistics Canada (2016). Employment in Journalism occupation, by province. Custom LFS tabulation. File on record with author.
The number of full-time journalists rose from 10,000 in 1987 to 11,631 last year. This is a small increase, to be sure, but an increase all the same. Also consider the fact that, in the 1990s, after years of slow growth, extensive consolidation and cut backs, the number of journalists had fallen to a little over 6,000 in 1998. If we take that as our base, the number of working journalists has nearly doubled and the period since looks more like one of recovery with some modest growth rather than a catastrophe.
At the same time, however, given that the media economy has quadrupled in size while the number of journalists has stayed relatively steady means that the number of journalists has shrunk relative to the size of the network media economy. In other words, there are fewer journalistic resources in a much bigger media pie. In addition, the modest growth in journalists has been vastly out-paced by the number of people working in the PR, advertising and marketing professions. In 1987, there were four people working in the publicity industries for every journalist; last year, the imbalance had swelled to 10:1.
We also need to consider that while the increasing number and diversity brought about by new journalist ventures is important, none of these efforts – e.g. iPolitics, Blacklocks Reporter, Canadaland, etc. – even ranks in the top 60 internet news sources that people in Canada go to for their news (see the “Internet News Sources” sheet in the Excel Workbook). This implies that they account for under one percent of internet news traffic, suggesting that they speak mainly to small and specialized audiences.
Their presence in the online news environment is vastly outstripped by mostly well-established news organizations like the CBC, Postmedia, Torstar, Quebecor, CTV, the Globe and Mail, the BBC, the New York Times, CNN, The Washington Post, the Guardian, and an assortment of “internet native services” like Buzzfeed, MSN News, TRONC, RT, etc. While the range of internet news sources now used by Canadians is a diverse mixture new and old, as well as local, national and international sources, the emergent crop of online journalistic ventures have yet to register significantly in the public mind except for the occasional intervention when they really do lead the charge and set the agenda by breaking stories that others have missed (e.g. the Jian Ghomeshi story and the Snowden disclosures, amongst many others).
For the time being, however, traditional news organizations are still the most important sources of journalism in the network media economy. They are still the content factories that produce news, opinion, gossip and cultural style markers that by and large set the agenda and whose stories cascade across the media in a way that is all out of proportion to the weight of the press in the media economy. In other words, the press continues to originate far more stories that the rest of the media pick up, whether television, radio or via the linking culture of the blogosphere, than its weight suggests. Thus, problems in the press pose significant problems for the media, citizens and audiences as a whole.
All-in-all, these developments suggest that journalism is not dead but in a serious moment of soul searching and transformation. Whether the changes will ultimately prove to be a boon for a free press, however, it is still too early to tell. And on this point, I am considerably more skeptical than Benkler and others who put their faith with the new online ventures, not least because the central problem, in my view, is nowhere near being adequately solved: i.e. the people have never paid the full cost for the news. For the past 150 years, advertising played an ever-increasing role in covering up that reality, but that façade is now collapsing before our eyes (John & Loeb-Silberstein, 2016).
As the advertising subsidy dries up, or is diverted to the internet and into fewer and fewer hands, and government-funding for public service media stagnates, as Ofcom notes (see pp. 153-154) and as our discussion of recent trends with respect to the CBC showed, who or what will fill the breach?
Some Reflections on Subsidies and Public Goods
Of course, the major English- and French-language press groups have called for subsidies, and for those subsidies to be directed toward them (see, for example, Postmedia CEO Paul Godfrey’s call to the Canadian Heritage Parliamentary Committee along these lines, as well as similar calls from Quebec-based newspaper groups (see here)).
Such calls for public subsidies for journalism, of course, have been resisted in many quarters, not least by many of the new journalistic ventures that have emerged (see, for example, Canadaland’s position statement on the issue). The view from these quarters tends to be that such subsidies will only preserve that which is destined to die, or worse, that state funds will be funneled into both commercial enterprises and the CBC that these new upstarts must compete against as they strive to carve out a place for themselves in the emergent network media ecology. One hears such views whenever discussions turn to the emergent journalistic ventures such as iPolitics, the National Observer, the Tyee, Blacklocks, AllNovscotia and Canadaland, to take just the most prominent. Maybe crowd-funding, subscriptions and/or some other type or direct payments will do the trick, is the response that, understandably, tends to flow from those backing these efforts bent on remaking the news for the 21st Century, and an evermore internet-centric media environment.
Yet, the idea that paywalls, crowdfunding, backing by wealthy benefactors, or some combination thereof might carry the day brings us right back to square one: people have never paid the full-freight for journalism. Historically, other than advertising, the other two main sources of subsidies to support journalism and other cultural goods have been “the state” through public service broadcasting and various other ways and means, or wealthy benefactors who have funded the high arts and, most notably, kept more than a few influential newspapers going for their own reasons, some of which have been altruistic, others tied to personal political projects and specific agendas to promote. The question, thus, becomes what kind of support do we want to give – as a society – to functions that we think are essential to personal and social well-being?
Avoiding, or simply opposing subsidies on the grounds that they are antithetical to “market values” simply avoids the reality that copyright, paywalls, and the entire intellectual property edifice itself is a specially devised creature of “the state” designed to deal with the public good characteristics of news, knowledge and culture. Indeed, the entire institutional set-up of copyright is based on one basic predicate: these goods are not normal goods traded in normal markets. That is why a distinctive set of “intellectual property laws” has been created for them, unlike most other kinds of “property”, where the normal rules of the law, property and the market hold sway.
In a bid to encourage the production and consumption of news copyright was extended to news around the turn-of-the-20th Century. Indeed, news wasn’t even copyrightable – i.e. treated as property and a commodity in the eyes of the law – in the UK until this time. Similar events took place in the US in 1918. As a matter of fact, subsidies and legal protections like copyright have been the twin pillars of journalism since the creation of the US itself, and far from ever being seen as offside from the point of view of the First Amendment, such measures have been seen as crucial to furthering the free press and free speech values that it embodies and that a democracy needs to flourish (see John on how the US postal service subsidized the development of the “free press” to the tune of tens of billions of dollars per annum in the late-18th and 19th centuries).
Generally speaking, people have never paid the full freight for a wide variety of media and cultural productions that we have grown accustomed to in modern capitalist democracies. These go well beyond audiovisual media to include libraries, education, basic research, archives, the arts, orchestras, statistical agencies, etc., in other words, the media and cultural infrastructures of modern societies. As a rule, the more of these things there are, and the better they are managed in the public interests, the healthier, happier and more democratic a society is – a sweeping statement to be sure, but in the round, basically on point.
Information/culture/media goods are not public goods just because I say they are but because society does, through the political process, and because they fit the criteria for public goods set out in mainstream and heterodox economic theory, historical experience, as well as normative ideas that directly link them to human development, citizenship and democracy. The economic ways and means used to produce such things through a combination of market and non-market forces are integral parts of the overall structure of the media economy not just in Canada but around the world – at least developed and democratic ones. The settlement struck during the ‘industrial media era’ that recognized these basic facts is becoming undone, but without clear alternatives in sight.
Turning away from such realities for reasons of self-interest is understandable, but avoids the nub of the issues before us. How to settle the problems raised by these issues is an open question. However, there are lots of good ideas and accumulated expertise available to draw upon and it is incumbent upon us – and policy-makers – to draw on those resources in order to address the many big questions now in front of us and whose resolution will shape the evermore internet- and mobile wireless-centric media ecology in front of us for decades, and maybe a century or more, if the lessons from the past 150 years of the “industrial media age” are any guide (for an example of how changes to income tax law in Canada, for example, might better sustain non-profit journalism, see the report by the Reuters Institute on the topic).
Some Concluding Comments and Observations
This report has examined the development of the network media ecology over the past three decades. It has done so out of the conviction that too often discussion of “the media” in Canada proceeds without a solid base of evidence, and too often is driven by stakeholders whose interests are understandable but not necessarily in line with public interests.
The network media economy has grown immensely over time, quadrupling in size on the basis of revenue between 1984 and 2015. Within the emergent network media economy, “content media” are being steadily displaced by the “platform media” (mobile wireless and broadband internet access services). Bandwidth is king, not content, in this context. There is also a decisive shift from advertising-supported content media to “platform” and “pay-per” media, with the common denominator between the latter being that they are based on subscriber fees and direct payments versus advertising revenue.
While advertising revenue has held steady in absolute terms, it is in decline relative to the size of the media economy and on a per capita basis. TV advertising revenue has stayed basically flat in absolute terms but fell from $102 per Canadian in 2008 to around $94 last year, but overall the growth of the “pay-per” aspect of TV (as well as music) means that television is still central to the ever more broadband internet- and mobile wireless-centric media ecology. Indeed, it is a key driver of their growth, and we can even speak of the ‘prime-time internet’ to capture the sense to which both TV and the internet overlap.
Although advertising is receding as a defining feature of the network media economy, it is important to note that internet advertising has soared, but has become more and more concentrated over time, with the share of the top ten internet companies growing significantly from 77% of all internet and mobile advertising revenue in 2009 to 86% last year. Such trends have redounded, in particular, to Google and Facebook, which combined accounted for an estimated two-thirds of the total $4.6 billion in internet advertising revenue in Canada in 2015.
Other relative newcomers like Netflix have also become significant players in the media economy. They are having a significant impact on “the broadcasting system”, although that nomenclature is circumspect in the context of the emergent network-centric media ecology. Moreover, while Google, Facebook and Netflix were the 6th, 14th and 15th biggest media companies in the country last year, they are still modest enterprises relative to Bell, Shaw (Corus), Rogers, Telus and Quebecor (Videotron), whose revenues individually and collectively are many times greater the US-based internet hyper-giants’ revenues in Canada.
This is not likely to change anytime soon either, mainly because, other than Netflix, the US-based internet companies depend almost entirely on advertising revenue. In the network media economy, it is bandwidth and subscription fees that are king, and the dominant Canadian telecoms-TV operators have secured their position across the network media economy on the basis of these realities. The fact that revenue from subscriber fees outstrips advertising by a widening margin also works in their favour, because it is the absolute core of Bell, Shaw, Rogers, Telus and Quebecor’s telecoms-internet and TV operations. Of course, the “pay-per” model also benefits Netflix, but Netflix depends on others for the bulk of its bandwidth needs.
The fact that all of the major commercial TV operators in Canada are owned by telephone companies sets it apart from the vast majority of other countries in the world. The CRTC, backstopped in recent years by the Competition Bureau, has begun to address this condition, one that just a few years earlier it had given its full blessing to. That about face, however, has provoked a ferocious backlash from the “cultural industries communities” and the incumbent telecoms-TV operators.
These two groups are uneasy bedfellows but for now they share an interest in rolling back the regulatory tide. They generally want to keep things the way they have been for the last half-century. The BDU-centric model of TV suits them just fine, and to the extent that the internet and mobile phones are given any thought at all, they are just a new revenue stream, and a means by which income can be diverted to support Canadian Content. As I have said in another report, we need to think of the network media ecology in terms of Lego building blocks, in which competitors, newcomers and people can pick, choose and snap together various elements of the whole as they see fit, versus the “systems” view and its long legacy of “end-to-end”, and top-down control (see here).
What could be easier, for instance, the “cultural industries communities” say, than to apply a “small tax” on smart phones and people’s internet service to replenish the assortment of cultural production funds that now exist across an equally wide variety of media, from TV, to music, to videogames, film, and so on? And why not “zero-rate” CanCon while applying data caps to foreign content and everything else people do with their mobile phones and internet connections, if that tilts the field in Canadian producers’ favour?
From this view, that the telcos own all of the biggest commercial TV services in the country passes by without comment. Data caps are not seen as artificial constraints on people’s ability to communicate and do as they please with the connectivity (the bandwidth) at their disposal, but rather something to be skewed in ways that support the “cultural production community” – much like cable networks went from being the foundation of “wired cities” in the 1960s and 1970s to become the nucleus of a BDU-centric “TV System”, and its spin-off effects on arts and cultural communities across the country. The culture and arts part, and even the TV part, are all just fine, in my view, but the means to get there being promoted by dominant interests are twisted, and the idea that we should think about things in terms of “a system” closes off more open possibilities before the discussion even begins.
The “Big 5” — Bell, Rogers, TELUS, Shaw and Quebecor – and their supporters amongst consultants, hired experts, think tanks and many journalists are probably the most influential participants in this ongoing battle over the network media ecology. To their way of thinking as well, who cares that Canada stands in a league unto its own in the extent to which telephone and internet companies own all of the major television services in the country when even the biggest Canadian companies are little more than lightweights thrown into battle with massively capitalized and largely unregulated global internet behemoths (Apple, Google, Facebook and Netflix) — a digital free for all of global proportions now playing out in Canada’s own backyard. It is not the broadcasting system we need to worry about, they and their hired guns assert, but the digital ecosystem. The best thing to do in the face of these daunting realities is to let the market rip, they assert.
That the current battle is as intense as it is, highlights the scale of the interests at stake. Sorting through these competing interests without losing sight of the myriad of public voices who have something to say is vital. So, too, is having a long-term, systematic body of evidence, set against a background of history, experience and scholarly independence, critical. That is what this report, and the CMCR Project, aims to achieve.
[1] Pay-per media refer to media that people pay for through subscriptions or other direct modes of payment. They generally include platform media plus subscription-based content media such as pay & specialty TV, OTT, video games, movies, music and books. They are different from media that are subsidized by advertising or government-funding (as in the case of the CBC) or wealthy patrons (as in the “high arts”). I take the “pay-per” term from Vincent Mosco’s Pay-Per Society (1989). The video game, film and book industries are not included in this report because of data availability limitations, but see PWC, 2016 for evidence that, more or less, confirms the point being made here.
[2] The best expression of such calls is probably a report done by Miller, P. (2015). Canadian Television 2020: Technological and Regulatory Impacts and which was prepared for ACTRA, Canadian Media Guild, Directors Guild of Canada, Friends of Canadian Broadcasting, Unifor. Ottawa: Nordicity.
[3] I have developed these points at greater length in a report entitled From the BDU-Model of TV to Radical Unbundling: Common Carriage and Culture Policy for the Internet Age (2016).
[4] See, for example, the CRTC’s trilogy of Talk TV decisions in 2015, it’s wholesale roaming investigation (2014-398), wholesale mobile wireless (2015-177), mobile TV (2015-26) and wholesale wireline (2015-326) decisions and the decision by the Liberal Government to reject Bell’s appeal to overturn that latter decision.
[5] For further notes on the method used to arrive at this estimate, see the Netflix entry for 2015 in the “Top 20 w/ Telecoms” worksheet in the Excel Workbook.
[6] The quality of the data and constantly changing methodologies for establishing revenues across each of the main elements that make up the music industries as a whole requires caution in drawing conclusions from the available data. The publishing sector is the best of the lot, while the recorded music segment data from Statistics Canada is good but the latest is for 2013, and thus requires estimating the amounts since based on average year-over-year growth rates. The same is true of the digital/internet and concert revenues, both of which are derived from PWC’s Global Entertainment and Media Outlook, as cited below.
[7] Thanks to Sabrina Wilkinson, an MA student at the School of Journalism and Communication at Carleton University, whose research for her MA thesis led me to several of these examples and sources.