The Growth of the Network Media Economy in Canada, 1984 – 2012
Has the media economy in Canada become bigger or smaller over time? Does the answer to that question, one way or the other, apply across the board, or to only a few of the dozen or sectors that make up the network media economy: i.e. wireline and wireless telecoms; internet access; cable, satellite & IPTV; pay and specialty television; conventional television; radio; newspapers; magazines; music; search engines; social media; internet advertising and online news sources?
Which of these sectors are growing, which are stagnating and which are in decline? To illustrate these trends over the period from 1984 until 2012, this post hones in on rising new media services (IPTV), those that have seen their revenues stay relatively flat over the past few years (conventional television) and those that appear to be in long-term decline (newspapers). I also examine whether the media economy in Canada is big or small relative to global standards.
This post also aims to set down a baseline of data to underpin a series of posts to follow over the next few weeks. Similar to what I have done for the past two years, the next post examines trends within and across the TMI industries from 1984 until 2012 to see if they have become more concentrated over time, or less (for previous versions, see here and here). The post after that zooms in on the top sixteen or so companies with one percent or more market share across the network media in Canada. Such firms account for 86% of all telecom, media and internet revenues. Rank ordered on the basis of revenue, they are: BCE, Rogers, Telus, Shaw, Quebecor, the CBC, MTS, Cogeco, Google, Torstar, Sasktel, Postmedia, Astral, Eastlink, the Globe and Mail, Facebook and Netflix. You can see a past version this discussion here).
In addition to updating our analysis for a complete set of the 2012 data, our goal is to break new ground. This year we do so by adding a new post that examines the state of media, telecom and internet concentration in Canada relative to the preliminary results of a thirty country study by the International Media Concentration Research Project, in which I served as the lead Canadian researcher. There are some surprising results that that smash a few shibboleths while confirming other elements of what we know from past research.
Finally, another new dimension for this year is a break out of data and analysis for the English- and French-language telecom, media and internet (TMI) markets. For the most part, similar questions to those introduced above are addressed about media growth and concentration trends between 2000 and 2012, while the leading firms in both of these regions are profiled in terms of size, ownership, the media, telecom and internet sectors they operate in, and how they each fit into the Canadian mediascape overall. 1
While we cite our sources below, by and large, the following documents and data sets underpin the analysis in this post: Media Industry Data, Media Economy Data, Sources and Explanatory Notes and the CMCR Project’s Methodology Primary.
Canada’s Network Media Economy in a Global Context
Canada’s network media economy has grown immensely over time. Between 1984 and 2012, it nearly quadrupled from $19.4 billion in revenue to $73.3 billion (current $). Adjusted for inflation, the rise was from $39 billion to $73.3 billion last year (2012 $).
While often cast as a dwarf amongst giants, the network media economy in Canada is large by international standards: tenth largest in the world as of 2012, as the overview in Table 1 below illustrates.
Table 1: Canada’s Ranking Amongst 12 Biggest Network Media Economies by Country, 1998 – 2012 (billions USD)1
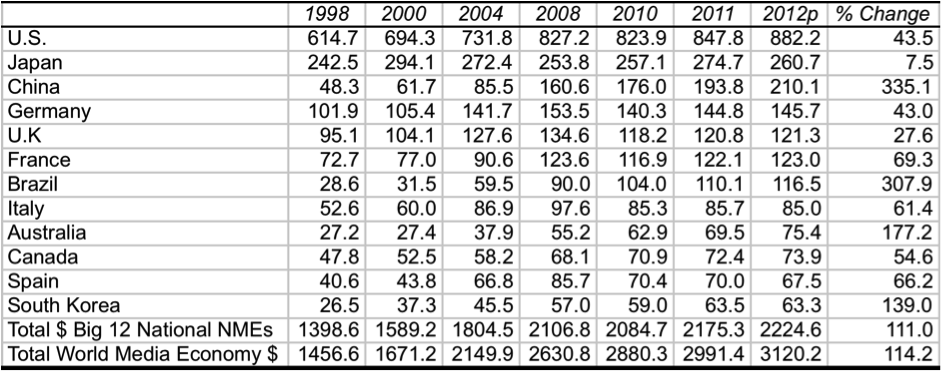 Sources and Notes: OECD Communication Outlook 2013; ITU Revenues 2012. PriceWaterhouseCooper’s Global Entertainment and Media Outlook, 2012 – 2016 (plus 2011, 2010 and 2009 editions) for media and internet. P = preliminary estimate for countries, except Canada. See CMCRP Media Industry Data and methodology primer for Canadian data and analysis.
Canada’s network media economy is obviously small relative to the U.S., at one-twelfth the size. However, relative to the rest of the world, it is amongst the biggest, right after Australia, Italy and Brazil and just ahead of Spain and South Korea.
The growth of the network media economy was especially swift from the early-1990s well into the first decade of the 21st century but like most other countries on the list, it has slowed since 2008, mostly on account of the economic instability that has followed quick on the heels of the Anglo European financial crisis (2007ff). Indeed, worldwide network media revenues fell 5% between 2008 and 2009 and half of the countries listed in Table 1 saw their media economies actually shrink over the following years: the US, Germany, France, the UK, Italy and Spain.
Collectively, these countries’ media economies shrank by around $67.2 billion between 2008 and 2012. Some of this lost ground was regained by 2011, but only on account of increases in the US and France while the media economies in the other four countries (Germany, the UK, Italy and Spain) continued to be smaller than they were before the financial crisis.
In sharp contrast to much of Europe, the US and, less so, Canada, the media economies of Australia, South Korea, Brazil and China have been largely unscathed by the financial crisis. Indeed, these countries and a few others such as Turkey, India, Indonesia, South Africa, and Russia have been going through something of a ‘golden media age’ over the past decade, with most media, from internet access, to the press, television, film and so on undergoing an unprecedented phase of fast-paced development (OECD, 2010).
The Network Media Economy in Canada: Growth, Stagnation or Decline?
As noted above, the network media economy in Canada has grown enormously from $19.4 billion in 1984 to nearly $73.3 billion in 2012 (current $), or from $39 billion in 1984 to just over $73.3 billion last year (2012$). Figure 1 below charts the trends using current dollars.
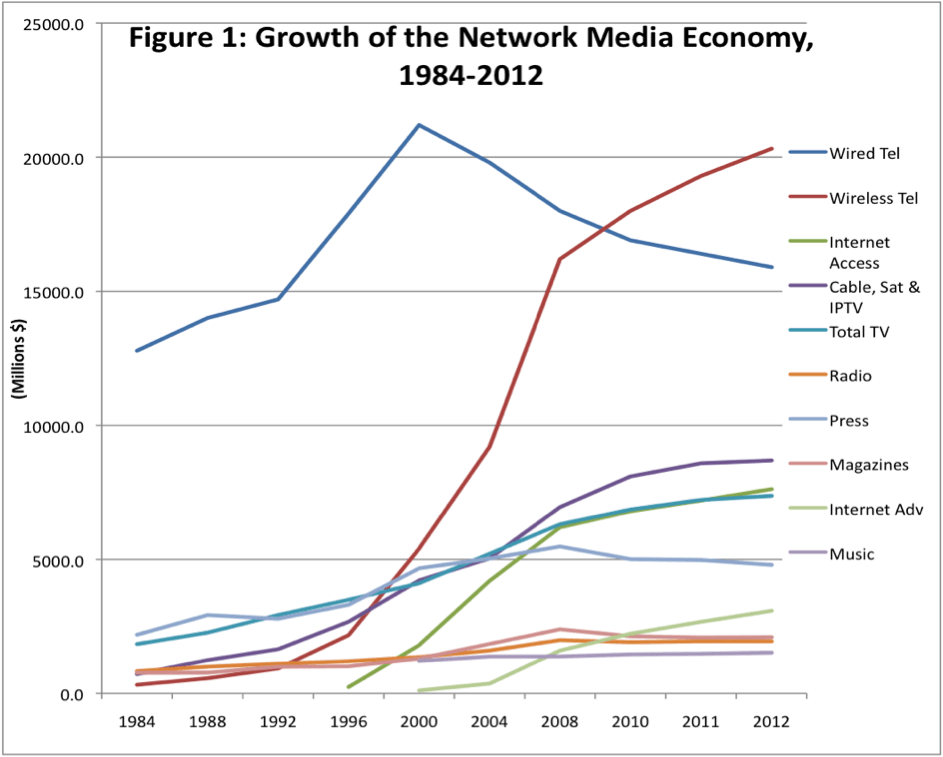
Source: see Media Economy Data, Sources and Explanatory Notes and the CMCR Project’s Methodology Primary.
Entirely new sectors – wireless, internet access, pay and specialty tv services, internet advertising – have added immensely to the increase. The most significant source of growth is from the platform media elements (wireless, ISPs, IPTV, cable and satellite), especially after the mid-1990s, but television has also grown enormously regardless of where we start the time line.
Music has also grown slightly, at least once a full measure of all of its subsectors are included – recorded, live, digital/online and publishing – as shown below, while radio has stayed mostly flat. In contrast, wireline telecoms, newspapers and magazines have declined, the first very sharply since 2000 and the latter two gently since sometime between 2004 and 2008, depending on whether trends are looked at from the point of view of real dollars or current dollars.
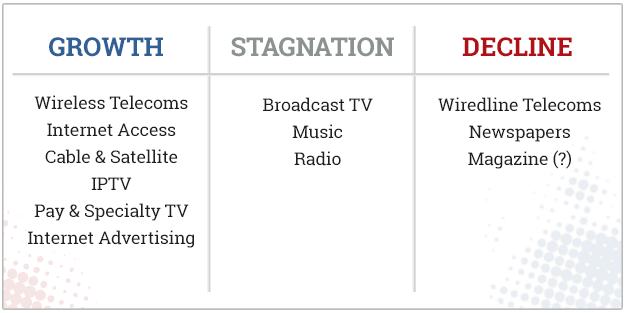
Table 2 below summarizes the state of affairs across the network media economy as things stood at the end of 2012 in terms of whether each sector covered in this post appears to be growing, stagnating or in decline.
Table 2: The Network Media in Canada: Sectors Experiencing Growth, Stagnation or Decline
The Platform Media Industries
The platform media industries – the pipes, bandwidth and spectrum used to connect people to one another and to devices, content, the internet, and so on — of the network media economy grew from $13.8 billion to $51.5 billion between 1984 and 2012. In real dollar terms, revenue grew from $26.8 billion to $52.5 billion. Table 3 shows the trends.
Table 3: Revenues for the Platform Media Industries, 1984 – 2012
|
|
1984 |
1988 |
1992 |
1996 |
2000 |
2004 |
2008 |
2010 |
2011 |
2012 |
| Wireline |
12787 |
14007 |
14700 |
17900 |
21200 |
19800 |
18000 |
16900 |
16400 |
15900 |
| Wireless |
321 |
565 |
931 |
2175 |
5400 |
9200 |
16200 |
18000 |
19300 |
20317 |
| ISP |
239 |
1800 |
4200 |
6200 |
6800 |
7200 |
7625 |
|||
| Cable+DTH |
716 |
1243 |
1651 |
2677 |
4219 |
5023 |
6856 |
7869 |
8208 |
8058 |
| IPTV |
16 |
97 |
231 |
380 |
638 |
|||||
| Total |
13824 |
15815 |
17282 |
22991 |
32619 |
38239 |
47354 |
49800 |
51488 |
52537 |
Source: see Media Economy Data, Sources and Explanatory Notes and the CMCR Project’s Methodology Primary.
Accounting for 72% of revenues, the platform media sectors are the fulcrum of the media economy, as is the case in most of the world. This is why Bell, Rogers, Shaw, Quebecor, Telus, SaskTel, MTS Allstream, Eastlink, Cogeco, etc. are so fundamental to the media economy.
While some might think that the over-sized weight of the platform media in the media economy is of recent vintage, their share of the network media economy in 2012 was basically the same as it was in 1984, i.e. 71-72%, albeit within the context of a vastly larger media economy. This is mostly because of the steep decline in wireline telecom revenues, from $21.2 billion at their peak in 2000 to $15.9 billion in 2012.
As plain old telephone service (POTS) has gone into decline, however, some pretty awesome new stuff (PANS) has come along to more than pick up the slack. Wireless is the best example of this, with revenues skyrocketing after 1996, as Figure 1 and Table 2, above, demonstrate.
Indeed, wireless revenues have nearly quadrupled from $5.4 billion in 2000 to $20.3 billion last year. A corresponding rapid growth in mobile voice and data traffic reinforce the impression. Voice and data traffic were up in Canada 69% and 85% in 2012 over 2011, respectively, with the latter rising considerably faster than the worldwide average (70%)(sources cited here are silent on the other).
The growth in wireless is fast on account of the expanding array of devices that people use to connect to wireless networks: phones, smartphones, tablets, wifi connected PCs, and so on. In short, personal wireless mobile communications are quickly moving to the centre of the media universe. These are the social, economic and technological foundations underpinning the wireless wars that are now in full-swing in Canada.
Some have recently argued that the rate of wireless growth has slowed since 2008, arguing that this is mainly because it is becoming a mature market (Church and Wilkins, 2013, p. 40). Relative to the torrid pace of growth from the late-1990s through the most of the 2000s, this is true. However, it is well known that the pace set during the early commercialization of new technologies cannot be sustained forever. More than this, however, the flattening of growth coincides perfectly with the financial crisis.
This reality simply cannot be ignored. As indicated earlier, revenues for the network media economy worldwide declined between 2008 and 2009 and many of the world’s largest network media economies are still smaller today than they were five years ago (Germany, UK, Italy and Spain), have stalled (Japan and France) or are only modestly larger now than they were five years ago (US, Canada and Korea). Therefore, a modest let-up in the pace of wireless growth amidst such conditions is not surprising.
That said, wireless revenues have not been hit as hard as other media sectors by either the collapse of the dot.com bubble in 2000 or by the Anglo-European financial crisis (2007ff). Only the pace of development has slowed relative to past trends.
Internet access displays similar patterns of massive growth, albeit for not as long or to the same extent. Internet access revenues last year were $7.6 billion, up substantially from $6.2 billion in 2008 and quadruple what they were at the turn-of-the-21st century ($1.8 billion).
The most notable development in the past two years is the rapid growth of the telephone companies’ Internet Protocol TV (IPTV) services, albeit from a low base. IPTV is the incumbent telcos’ managed internet-based tv services: e.g. Telus, Bell, MTS Allstream, SaskTel, and Bell Aliant. Revenues have nearly tripled, from $231 million to $638 million, over the past two years. The number of IPTV subscribers has followed suit, rising sharply from 200,000 in 2008, to nearly a half-million at the end of 2010, to just under 1.2 million at the end of 2012.
These figures are slightly higher than those in the CRTC’s Communication Monitoring Report (pp. 110-111) because the CRTC’s figures for subscribers are taken from the end of August in each year as opposed to the end of the year. More importantly, the CRTC’s estimated revenues (ARPU) are lower than those the telcos cite in their annual reports (see CMR, pp. 110-111).
Tables 4 and 5 below show the trends for IPTV growth in terms of both subscribers and revenues, respectively.
Table 4: The Growth of IPTV Subscribers in Canada, 2004–2012
|
2004 |
2006 |
2008 |
2010 |
2011 |
2012 |
|
| Bell Fibe TV |
13,000 |
50,644 |
248,298 |
|||
| Bell Aliant |
46,575 |
68,199 |
107,391 |
|||
| Telus |
63,000 |
266,000 |
453,000 |
637000 |
||
| MTS Allstream |
25,422 |
59,442 |
82,278 |
89,604 |
93,244 |
95,374 |
| SaskTel |
22,850 |
48,980 |
68,408 |
83,610 |
91,854 |
93507 |
| Total IPTV Connections |
48,272.0 |
108,422 |
213,686 |
498,789 |
756,941 |
1,181,570 |
Source: see Media Industry Data, Sources and Explanatory Notes and the CMCR Project’s Methodology Primary.
Table 5: The Growth of IPTV Revenues in Canada, 2004–2012
|
|
2004 |
2006 |
2008 |
2010 |
2011 |
2012 |
| Bell Fibe TV |
8.9 |
22.7 |
120.2 |
|||
| Bell Aliant |
14.9 |
27.6 |
55.7 |
|||
| Telus |
14.3 |
101.6 |
202.2 |
314.7 |
||
| MTS Allstream |
8.4 |
29 |
50 |
59.0 |
70.6 |
78.5 |
| SaskTel |
7.6 |
23.9 |
37.1 |
51 |
63.7 |
74.3 |
| Total IPTV $ |
16 |
52.9 |
97.2 |
231.3 |
380.0 |
638.1 |
Source: see Media Industry Data, Sources and Explanatory Notes and the CMCR Project’s Methodology Primary.
The growth of IPTV services is significant for many reasons. First, the telcos are finally making the investments needed to bring next generation, fiber-based internet networks closer to subscribers, mostly to neighbourhood nodes and sometimes right to people’s doorsteps. If the distribution of television is essential to the take-up of next generation networks, as I believe it is (for better or worse), IPTV will be a key part of the demand drivers for these networks (see below).
Second, the addition of IPTV as a new television distribution platform brings the telcos deeper into the cable companies’ dominion. IPTV services accounted for 7.5% of the TV distribution market in 2012 (the CRTC’s Communication Monitoring Report publishes a slightly lower number at 6.7%, p. 110 for reasons explained above). The competitive threat posed by IPTV services, however, is more prominent in the western provinces where Telus, SaskTel and MTS are deploying IPTV in direct rivalry with Shaw versus the provinces from Ontario to the Atlantic where Bell’s decision to manage the introduction of IPTV in ways that are as least disruptive to its existing satellite operations as possible has moderated the impact on Rogers, Quebecor and Cogeco.
While the telcos’ IPTV services appear to have cut into the revenues of some cable companies, they have also contributed to a substantial expansion of BDU revenues from $8.1 billion in 2010 to $8.7 billion last year. Growth in 2012, however, was slow. Against the hew and cry about cord-cutting in industry pleadings for regulatory favours, and in so much of the journalistic coverage that uncritically repeats such claims, the losses of a few incumbent cable providers should not be mistaken with an industry in peril. Even if it was, growing competition is to be encouraged rather than something to shed tears over.
While IPTV services finally appear to be taking off, we must remember several things. First, the small prairie telcos, followed by Telus, have taken the lead in deploying IPTV. For Sasktel, MTS and Telus, IPTV now make up a significant 13.9 percent, 6.6 percent and 5.9 percent, respectively, of their revenues from wireline network access services (Wiredline + ISP + Cable). Bell lags far behind, with 1.5 percent of its revenues coming from IPTV services, including Bell Aliant, in 2012 (see Table 5).
Indeed, Bell launched IPTV late via its affiliate Bell Aliant in 2009. It slowly rolled out service for the next two years in the high-end districts of Montreal and Toronto, half-a-decade after MTS and SaskTel began doing so in the prairies. More cities were added in 2012 and subscriber numbers for the Bell Fibe service grew as a result from just under 120,000 the year before to about 356,000.
Innovation and investment in Canada came first from small telcos on the margins and Telus, not Bell. This replays a long-standing practice for new services to start out as luxuries for the rich before a mixture of public, political and competitive pressures turn them into affordable and available necessities for the public generally (see Richard John with respect to the US, Robert Babe for Canada). From the telegraph to next generation fibre Internet infrastructure, the tendencies, conflicts and lessons have remained much the same. The wireless wars that are now in full-swing are just the latest iteration of an old, old story (Winseck Reconvergence, Winseck and Pike, John or Babe).
IPTV remains under-developed as a critical part of the network infrastructure in Canada, accounting for only 2 percent of the $32.2 billion in wire line network access revenues (i.e. wireline+BDUs+ISPs) (see Table 3 above). Less than two percent of broadband connections in Canada use fiber-to-the-home (see CMR, p. 142). The OECD average is 15 percent. In countries at the high end of the scale (Sweden, Slovak Rep., Korea, Japan), thirty to sixty percent of all broadband connections are fiber-based. The OECD ranks Canada 24 out of 34 countries in terms of fiber-connections out of the total number of subscribers as of December 2012. The following figure illustrates the point.
Figure 2: Percentage of Fibre Connections Out of Total Broadband Subscriptions (December 2012)
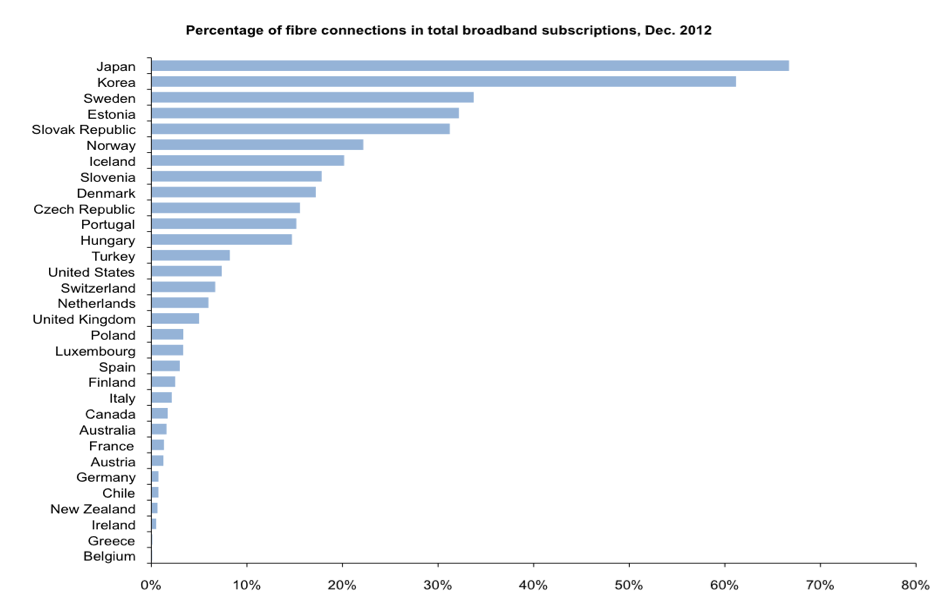
Source: OECD (2013). Broadband Portal.
For those who might be dismissive of such figures, it is useful to remember that the data presented in Tables 4 and 5 about IPTV are based on the Canadian telcos’ own audited numbers from their annual reports. While it has become something of a sport in Canada to cast aspersions on the OECD data (see here, here and here), the UK regulator Ofcom comes to similar conclusions: 5% of Canadian households subscribed to IPTV in 2011 versus France (28%), the Netherlands and Sweden (11%), Germany and the US (6%) and Spain (4%) as of 2011 (p. 136). The prairie telcos and Telus are part way to the OECD average, but in many ways, especially given its size and presence from Ontario to the Atlantic, it is Bell’s poor performance over the past half-decade that has dragged Canada down in the global league tables.
The Content Media Industries
The remainder of this post looks at the content media industries (broadcast tv, specialty and pay tv, radio, newspapers, magazines, music and internet advertising). For the most part, they too have grown substantially, although the picture has become murkier for a few sectors in the past few years.
In 1984, total revenue for the content industries was $5.6 billion; in 2012, it was $20.8 billion in 2012. In inflation-adjusted dollars, the revenues basically doubled from $11.3 billion to $20.8 billion over this span of time. Growth was steady throughout this period, with no discernible major uptick or downturn at any given point in time except for the years between 2008 and 2010, for reasons discussed above. Figure 3 depicts the trends.
Figure 3: Revenues for the Content Industries, 1984 – 2012 (Millions $)[visualizer id=”555″]
Sources: see Media Economy Data, Sources and Explanatory Notes and the CMCR Project’s Methodology Primary.
The rise of the internet and the confluence of its impact with the advertising downturn after the Anglo European financial crisis led many to claim that conventional TV is in a death spiral. Over-the-top services such as Netflix and supposedly rampant cord-cutting further compound the woes, or at least so the story goes.
Such doomsday scenarios, however, have been wide of their mark. Advertising revenue has gyrated in lockstep with state of the economy: plummeting by 8.5% from 2008 to 2009 followed by substantial increases of 9.2% and 7.7% in 2011. Things, however, stalled in 2012 amid ongoing economic uncertainty (-2%), fitting the patterns described earlier perfectly (on economic recessions, advertising revenue and the media economy see Picard, Garnham or Miege).
Beyond advertising, the picture is clearer. The amount of time people watch television has stayed remarkably steady across all age groups and outstrips time with other media — the internet, radio, newspapers or other media – by a considerable margin, according to the most recent Canadian Media Usage Study. Ofcom’s latest international monitoring report shows that TV viewing was up in 13 of the 16 countries it surveyed, including Canada (p. 162).
In “Why the Internet Won’t Kill TV”, Sanford C. Bernstein & Co. senior analyst Todd Juenger writes, “so far teens are following historical patterns, and in fact, their usage of traditional TV is increasing”. Their use of computers, smart phones and tablets to do so is adding to, rather than taking away from, how much they watch television, he states.
Internet equipment manufacturers Cisco and Sandvine suggest that television and online video are driving the evolution and architecture of the internet. The proliferation of devices is expanding the time and space for television in people’s lives, not taking away from it. Elsewhere, I have called this the rise of the prime time internet. The fact that Netflix is engineered to be viewed on 800 devices helps illustrate the point.2
Conventional broadcast TV revenues have been basically flat since 2008. In real dollar terms, they have slid from $3,562 million to $3,407 in 2012 – a 4% decline. The real growth has been in subscriber fees and the pay-per model of TV (Mosco), as has been the case around the world – a point returned to immediately below.
For now, however, four points can be highlighted to explain the stalled growth of conventional TV when measured in current dollars or slight decline when ‘real dollars’ are used:
- dip in TV advertising in 2012;
- budget cuts to the CBC (p. 8);
- the phasing out of the LPIF between 2012 and 2014;
- the big four commercial TV providers – Shaw, Bell, Rogers and Quebecor –backing of the rapidly growing pay, specialty and other subscriber-based forms of TV (i.e. mobile, IPTV), while edging away from broadcast TV (see the CRTC’s CMR, pp. 100-102 and Individual Financial Summaries for a list of the 116 pay and specialty channels the big four, in total, own 2012).
That the TV in crises choir is wide of the mark is clearer yet once we widen the lens to look at the fastest growing areas of television: i.e. specialty and pay tv services (HBO, TSN, Comedy Central, Food Network, etc), mobile TV, and television distribution. Pay and specialty television services have been fast growing segments since the mid-1990s and especially so during the past decade. Their revenues eclipsed those of conventional broadcasting in 2010, when revenues reached $3,474.6 million. Last year, that figure was half-a-billion dollars higher at $3,967.5 million.
Adding conventional as well as specialty and pay tv services together to get a sense of ‘total television’ revenue as a whole yields an unmistakable picture: total TV revenues quadrupled from $1,842 million in 1984 to $7,375 million in 2012; using ‘real dollars’, total TV revenues doubled from $3.7 billion to $7.4 billion last year — hardly the image of a media sector in crisis. The fact that such trends persisted steadfast in the face of the economic downturn also points to a crucial point: the importance of the direct pay-per model (Mosco) and its relative imperviousness to economic shocks in comparison to the hyper-twitchy character of advertising revenue.
Add cable, satellite and IPTV distribution and the trend is more undeniable. In these domains, as indicated earlier, the addition of new services, first DTH in the 1990s, followed by IPTV in the past few years, plus steady growth in cable TV, means that TV distribution has grown immensely. Indeed, revenues for these sectors expanded twelve-fold from $716.3 million in 1984 to $8,695.7 million in 2012 (in current dollars).
“Total TV” and TV distribution revenues accounted for just over $16.1 billion in 2012. To put this another way, in 1984, all segments of the TV industry accounted for just 7% of revenues in the network media economy. That figure rose to 14% in 2000; by 2012, it was 22%. Table 6 illustrates the trends.
Table 6: Television Moves to the Centre of the Network Media Economy Universe, 1984 – 2012 (millions current $).
|
|
1984 |
1988 |
1992 |
1996 |
2000 |
2004 |
2008 |
2010 |
2011 |
2012 |
| Cable, Sat & IPTV |
716 |
1243 |
1651 |
2677 |
4219 |
5039 |
6954 |
8100 |
8588 |
8696 |
| TV |
1842 |
2270 |
2927 |
3496 |
4110 |
5210 |
6311 |
6865 |
7224 |
7375 |
| Total NME$ |
38951 |
38661 |
36222 |
43770 |
57577 |
62146 |
69821 |
72204 |
72781 |
73364 |
| BDU+TV/NME (%) |
7 |
9 |
13 |
14 |
14 |
16 |
19 |
21 |
22 |
22 |
Sources: see Media Economy Data, Sources and Explanatory Notes and the CMCR Project’s Methodology Primary.
Television is not dead or dying. It is thriving, and remains at the core of the internet- and wireless-centric media universe. Moreover, television and online video are driving the development and use of wireless and internet services. This is why Rogers, Telus and Bell are all using television to drive the take-up of 4G wireless services, and IPTV for the latter two. To paraphrase Mark Twain, rumors of television’s demise are greatly exaggerated.
Of course, this does not mean that that life is easy for those in the television business. Indeed, all of these sectors continue to have to come to terms with an environment that is becoming structurally more differentiated because of new media, notably IPTV and over-the-top (OTT) services such as Netflix, as well as significant changes in how people use the multiplying media at their disposal.
While incumbent television providers have leaned heavily on the CRTC and Parliament to change the rules to bring OTT services into the regulatory fold, or to weaken the rules governing their own services (see Bell’s submission in its bid to take over Astral Media, for a recent example, notably p. 22), OTT services have not cannibalized the revenues of the industry. They have added to the size of the pie. Based on an estimated 1.6 million subscribers at the end of 2012, Netflix’s Canadian revenues were an estimated $134 million – about 1.8 percent of “Total TV” revenues. Reports by Media Technology Monitor and CBC as well as the CRTC’s (2011) Results of the Fact Finding Exercise on Over-the-Top Programming Services lead to a similar conclusion.
Part of the more structurally differentiated network media economy is also illustrated by the rapid growth of internet advertising. In 2012, internet advertising revenue grew to $3.1 billion, up from just over $2.7 billion a year earlier and $1.6 billion in 2008. At the beginning of the decade, internet advertising accounted for a comparably paltry $110 million, but has shot upwards since to reach current levels. Similar to wireless services, however, internet advertising revenues continue to grow fast, although even here the pace has slowed appreciably since the onset of the Euro American financial crisis.
To be sure, these trends have given rise to important new actors on the media scene in Canada, notably Google and Facebook, among others, who account for the lion’s share of internet advertising revenues. Indeed, based on common estimates that Google takes about half of all internet advertising revenues, the search engine giant’s revenues in Canada in 2012 were in the neighbourhood of $1,542.5 million.3 This is significant. It is enough to rank Google as the eighth largest media company operating in Canada, just after the CBC and MTS, but ahead of, in rank order: Cogeco, Torstar, Sasktel Postmedia, Astral, Eastlink, Power Corporation (Gesca) and the Globe and Mail.
For its part, Facebook had an estimated 18.1 million users in Canada at the end of 2012. With each Canadian user worth about $12.70 to the company a year, it’s revenue can be estimated as having been $229.7 million in 2012, or 7.5% of online advertising revenue – an amount that gives it a modest place in the media economy in Canada and near the bottom of the list of the top twenty TMI companies in this country.
While it is commonplace to throw digital media giants into the mix of woes that are, erroneously, trotted out as bedeviling many of the traditional media in Canada, the fact of the matter is that Netflix’s impact on television revenues is negligible, while those of Google and Facebook are mostly irrelevant except for three areas where they are likely quite significant: music, magazines and newspapers. For the latter two, this is because of the direct impact on advertising revenues, while for music it is not advertising that is at issue, but how online distribution and the culture of linking is affecting the music industry. The following and concluding sections of this post sketch out trends in each of these domains.
Music
While many have held up the music industry as a poster child of the woes besetting ‘traditional media’ at the hands of digital media, the music industry in Canada is not in crisis. The picture over time, however, is mixed but getting better from a commercial standpoint.
Using current dollars, the sum of all of the main components of the music industry – i.e. recorded music, digital sales, concerts and publishing royalties – the music industry has grown modestly from $1,214 million in 1998 to $1,523.2 million in 2012. The current trend is slightly up, but the trend over the past decade-and-a-half has been unsteady, with considerable oscillation between record highs and contemporary lows.
Revenue dropped after the collapse of the dot.com bubble between 2000 and 2002, for instance, but then rose again until hitting a peak in 2004 of $1,379.3 million where they stayed flat for the next four years, when they began once again to climb. By 2010, music industry revenues had grown to $1,458.2 million; they have edged upwards from there ever since: to $1,480.4 million in 2011 and to $1,523.2 million last year – an all time high. Figure 4 illustrates the trends over time based on current dollars.
Figure 4: Total Music Revenues, 2000, 2006 & 2012 (millions$).
[visualizer id=”695″] [visualizer id=”696″] [visualizer id=”694″]
Sources: Recorded Music from Statistics Canada, Sound Recording and Music Publishing, Summary Statistics CANSIM TABLE 361-0005; Stats Can., Sound Recording: data tables, October 2005, catalogue no. 87F0008XIE; Stats Can, Sound Recording and Music Publishing, Cat. 87F0008X, 2009; except for 2012, from PriceWaterhouseCooper, Global Media and Entertainment Outlook, 13th ed., 2012; Concerts from Stats Can, Spectator sports, event promoters, agents & managers, and artists for 2007, 2008, and 2009; Publishing from Socan, Financial Report (various years); Internet from PriceWaterhouseCooper, Global Media and Entertainment Outlook, 13th ed (various yrs).
The picture is less rosy when we switch the metric to ‘real dollars’, which results in revenues reaching a high of $1.6 billion in 2004 before dropping to their lowest point in over a decade: $1, 455 million in 2008. Yet, since then, revenues have once again been on the rise and in 2012 reached $1523.2 million – less that 4% off their peak in 2004.
This is a slight decline since the all-time high in 2004, of course, but certainly not a calamity. Moreover, the trend from 2008, whether measured in current or real dollars is all in one direction: up! One reason for this might be because of all the media covered by the network media concept, the music industries embraced digital/internet sources of revenue earlier and more extensively than any other. Worldwide, by 2012, the industry obtained about 15% of its revenues from online, mobile and digital sources.
There is and has been no crisis in the music industry. In fact, conditions in Canada now mirror those in the music industry worldwide. To be sure, certain elements within the music industry – recorded music, for instance – have suffered badly, but publishing has plugged steadily along with modest increases and digital/online/mobile have exploded. Even recorded music now appears to be holding steady. Moreover, whereas recorded music has long been the centre of the industry that place has now been usurped by live concerts, as shown above. Even the music industry’s main lobby group, the International Federation of Phonographic Industries states in its most recent Digital Music Report that in 2012 “the music industry achieved its best year-on-year performance since 1998” (p. 5).
Radio
Radio stands in a similar position to the music industries a few years ago. Revenues grew until reaching a peak in 2008: $1,990 million (includes CBC annual appropriation), a level at which they have basically remained ever since. Revenues in 2012 were $1,946 (current dollars). Change the measurement from current dollars to inflation-adjusted, real dollars, however, and the picture changes, with revenue declining from $2,088.3 million in 2008 to $1,946 million in 2012 – a fall of 6.8%.
Magazines
Magazines appear to stand in the same position as the music and radio sectors as well, although I have not been able to update my revenue data for the sector for either 2011 or 2012. Yet, extrapolating from trends between 2008 and 2010 to obtain an estimate for 2012, revenues have declined slightly on the basis of current dollars (from 2,394 million in 2008 to $2,100 in 2012). PriceWaterhouseCooper, in contrast, shows a slight uptick in revenues between 2011 and 2012. Back to estimates using Statistics Canada and the drop of nearly 17 percent from $2,522.4 million in 2008 to $2,071.1 last year seems pronounced. The Internet Advertising Bureau shows a net drop in advertising between 2011 and 2012 of 3%. In other words, the evidence is mixed but leans toward the ‘media in decline’ side of the ledger.
Newspapers
Perhaps the most dramatic tale of doom and gloom within the network media economy, at least in terms of revenues, is from the experience of newspapers. Readers of this blog will know that in earlier versions of this post, and other posts, I have been skeptical of claims that journalism is in crisis. I still am. Generally, I agree with Yochai Benkler who argues that that we are in a period of heightened flux, but with the emergence of a new crop of commercial internet-based members of the press (the Tyee and Huffington Post, for example), the revival of the partisan press (e.g. Blogging Tories, Rabble.ca) as well as non-profits and cooperatives (e.g. the Dominion) and the rise of an important role for citizen journalists signs that journalism is not moribund or in a death spiral. In fact, these changes may herald a huge opportunity to improve the conditions of a free and responsible press.
At the same time, however, I also believe that traditional newspapers, whether the Globe and Mail, the Toronto Star or Ottawa Citizen are important engines in the network media economy, serving as the content factories that produce news, opinion, gossip and cultural style markers that have the ability to set the agenda and whose stories cascade across the media in a way that is all out of proportion to the weight of the press in the media economy. In other words, the press originates far more stories and attention that the rest of the media pick up, whether television, radio or via the linking culture of the blogosphere, than its weight suggests. Thus, problems in the traditional press could pose significant problems for the media, citizens and audiences as a whole.
While I have been reluctant to see newspapers as being in crisis, mostly because in previous years I have felt that the trends had not been long enough in the making to draw that conclusion. I also believe that many of the wounds suffered by the newspaper business have been self-inflicted out of a mixture of hubris and badly conceived bouts of consolidation. Nonetheless, I began to change my tune last year and the results this year offer no reason to change course now.
The revenue figures for the newspaper industry, as one industry insider who tallies up the data told me, are “a mess”. The problems are mostly terminological in nature, such as how to define a daily, community or weekly newspaper while allocating revenue to each category accordingly. They also reflect concerns with how to present the industry in the least damaging light but without sugar-coating harsh realities. That said, using a mixture of data from Newspaper Canada and Statistics Canada allows us to arrive at good portrait of the newspaper industry over time and its main players, although it’s also important to point out that the Statistics Canada data for 2011 and 2012 are preliminary estimates that must wait until next year when it releases newspaper industry revenues for these years.
The data I use is drawn mostly from Statistics Canada, but Table 7 below shows both Newspaper Canada and Statistics Canada data so that readers can see the difference and also to reveal online revenues. Further discussion of why these differences exist can be seen in the relevant sections of the documents here and here.
Regardless of differences, both sources show that newspaper revenues have plummeted. In current dollar terms, Statistics Canada shows that newspaper revenues peaked at $5,482.3 million in 2008, and have fallen substantially since to an estimated $4,978 million last year. They fell another $180.7 million in 2012 – 3.6% — a decline of 12.5% since 2008. Table 7 illustrates the trends over time since 2004, while the full data set based on Statistics Canada data from 1984 can be seen under the relevant heading here.
Table 7: Newspaper Revenue — Newspapers Canada vs Statistics Canada, 2004-2012
| ($ million CND) | 2004 | 2008 | 2009 | 2010 | 2011 |
2012 |
| Daily Newspaper (Adv$) |
2,611 |
2,489 |
2,030 | 2,102 | 1,971 |
2,019 |
| Daily Newspaper (Circ$) |
745.1 |
808.3 |
867.2 | 836.9 | 829.5 |
829.5 |
| Community Newspaper ((Adv$) |
961 |
1,211 |
1,186 | 1,143 | 1,167 |
1,253 |
| Community Newspaper (Circ$) |
Total |
42.6 | 42.9 |
42.9p |
||
| Online Newspaper* |
– |
180.7 |
212.7 | 246.0 | 289.3 |
277.3 |
| Newspaper Canada |
4,317 |
4,689 |
4,509 | 4,616 | 4,589 |
4,422 |
| Statistics Canada Total $ |
5033.9 |
5482.3 |
4,938.5 | 5009.8 | 4978.5 |
4797.8 |
Sources: see Media Economy Data, Sources and Explanatory Notes and the CMCR Project’s Methodology Primary. Online Newspaper revenues includes daily and community papers. 2012 data for Community Newspaper circulation revenue based on estimate of flat year-over-year growth.
In real dollar terms, the fall is more pronounced, with the decline setting in earlier and the drop being steeper. According to this measure, newspaper revenues basically flatlined between 2000 and 2008, with a small drop, but have shrunk greatly since by just under $1 billion – or 17%. This is the most clear cut case of a medium in decline out of the sectors of the network media economy reviewed in this post.
The results of these trends in 2012 were clear:
- Postmedia cut the Sunday edition at three of its papers (the Calgary Herald, Edmonton Journal and Ottawa Citizen) adding to those where such measures had already been taken in the past few years (e.g. the National Post);
- Postmedia also made deep cuts to journalistic staff across its chain;
- the Globe and Mail adopted a voluntary program with the hope that sixty of its journalists would take the hint and leave (and here);
- Quebecor’s Sun newspapers cut 500 jobs and centralized its printing operations in a smaller number of locations;
- Glacier and Black swapped a number of smaller papers to consolidate their own operations.
Perhaps the most significant change to take place in 2012 is the extent to which dailies were put behind paywalls in Canada. Prior to 2011 there were no dailies with paywalls; in 2011 there were 5 covering under 1/5th of daily circulation; by 2012 the number had grown to 11 dailies and more than half of daily circulation. By August 2013, the number had grown 26 dailies accounting for more than two-thirds of daily circulation – a rate that is considerably higher than either the US or the UK (see Picard and Toughill). Table 8 illustrates the point.
Table 8: The Rise of the Great Paywalls of Canadian Newspapers, 2011-2013
| Newspaper | Lang | Paywall | Owner |
Weekly Total |
Daily Avg. |
| Times Colonist, Victoria | English | May 2011 | Glacier Media |
168,003 |
28,000 |
| Daily Gleaner, Fredericton | English | Nov 2011 | Brunswick News Inc. |
33,042 |
5,507 |
| Times-Transcript, Moncton | English | Nov 2011 | Brunswick News Inc. |
1,813,141 |
302,190 |
| New Brunswick Telegraph Journal | English | Nov 2011 | Brunswick News Inc. |
1,017,394 |
169,566 |
| Gazette Montreal | English | May 2011 | Postmedia |
288,639 |
48,107 |
| % Circ behind Paywall (2011) |
17.9 |
19.2 |
|||
| Vancouver Sun | English | Aug 2012 | Postmedia |
103,106 |
17,184 |
| Province, Vancouver | English | Aug 2012 | Postmedia |
184,485 |
30,747 |
| Ottawa Citizen* | English | Aug 2012 | Postmedia |
313,017 |
52,169 |
| Journal de Montréal | French | Sept 2012 | Quebecor/Sun Media |
987,040 |
164,507 |
| Journal de Québec | French | Sept 2012 | Quebecor/Sun Media |
853,800 |
142,300 |
| Globe and Mail | English | Oct 2012 | Globemedia Inc. |
1,184,530 |
169,219 |
| Ottawa Sun | English | Dec 2012 | Quebecor/Sun Media |
106,343 |
17,724 |
| Toronto Sun | English | Dec 2012 | Quebecor/Sun Media |
683,327 |
113,888 |
| Winnipeg Sun | English | Dec 2012 | Quebecor/Sun Media |
764,473 |
109,210 |
| Calgary Sun | English | Dec 2012 | Quebecor/Sun Media |
853,800 |
142,300 |
| Edmonton Sun | English | Dec 2012 | Quebecor/Sun Media |
358,018 |
51,145 |
| % of Circ behind Paywall (2012) |
52.3 |
54.4 |
|||
| National Post | English | May 2013 | Postmedia |
2,503,284 |
357,612 |
| Calgary Herald | English | May 2013 | Postmedia |
987,040 |
164,507 |
| Edmonton Journal | English | May 2013 | Postmedia |
337,021 |
56,170 |
| Windsor Star | English | May 2013 | Postmedia |
1,015,625 |
145,089 |
| Guardian, Charlottetown | English | May 2013 | TC Media |
249,589 |
41,598 |
| Leader-Post, Regina | English | May 2013 | Postmedia |
337,021 |
56,170 |
| StarPhoenix, Saskatoon | English | May 2013 | Postmedia |
358,018 |
51,145 |
| The Daily News, Truro | English | July 2013 | TC Media |
290,101 |
41,443 |
| Toronto Star | English | Aug 2013 | Torstar Corporation |
2,014,592 |
287,799 |
| Chronicle-Herald, Halifax | English | Aug 2013 | Halifax Herald Ltd. |
770,132 |
110,019 |
| Total Circulation |
18,574,648 |
2,875,390 |
|||
| % of Circ behind Paywall (8/2013) |
68.8 |
68.3 |
Sources: Newspaper Canada 2012 Daily Circulation Report.
Some Concluding Comments and Observations
Several observations and conclusions stand out from this analysis.
First, the network media economy has grown immensely over time, whether we look at things in the short-, medium- or long-term. In the short- to medium-term (1-5 years), however, things have been less rosy. The effects of the economic downturn in the wake of the Euro-American centred financial crisis have hit every sector, except, it would appear, and ironically, music, which began to recover shortly afterwards. Otherwise, the effect has been to slow the rate of growth in the fastest growing sectors (wireless, ISPs, internet advertising, television) and to compound the problem in those media already under stress (newspapers, magazines and radio).
Second, while the network media economy in Canada may be small relative to the U.S., it is large relative to global standards. In fact, it is the tenth biggest media economy in the world.
Third, while most sectors of the media have grown substantially, and the network media economy has become structurally more complex on account of the rise of new segments of the media, a few segments have stagnated in the past few years (broadcast TV, radio and music, with apparent light at the end of the tunnel in the last few years with respect to the latter). It is now safe to say that two sectors appear to be in long-term decline: the traditional newspaper industry and wiredline telecoms. Magazines probably fit the latter designation but it may still be too early to tell, with some good sources suggesting that it too, like the music sector, might be poised for a turn-around.
These ambiguities give good reason for why the CMCR project will continue to update our research on these matters annually. As we have said before, we can know of few better ways to gain an intimate understanding of our objects of analysis – the network media and all of its constituent elements – than to peer deeply and systematically into the data, while providing a theoretically and historically informed analysis of the data and trends that emerge over as long a period of time as we reasonably can.
1 Brazil telecom estimated at 12.5 percent growth from 2004 to 2008, and 5 percent per annum for 2010 through 201; China’s revenue estimated for 2010-2012 based http://www.cmcrp.org/wp-content/uploads/2013/10/Sources-and-Explanatory-Notes.docxon 10 percent per annum growth rates. Internet access revenues before 2004 are estimated for each country, except Australia and Canada, based on the prevailing CAGR for this sector within each country at the time.
2 Corey Wright, Director of Global Public Policy, Netflix, guest lecture given at School of Journalism and Communication, Carleton University, September 2013.
3 The Globe and Mail’s publisher, Phillip Crawley told the World Publishing Expo in Berlin that Google takes 60% of internet advertising in Canada. Evidence for this claim do not seem to have been presented, but I am all ears if a good case can be made for revising the estimates upwards to this figure.