Media and Internet Concentration in Canada Report, 1984 – 2014
Introduction
This is the second report in an annual series that reviews current developments and long-term trends in the media, internet and telecoms industries in Canada. Building on last week’s effort, it addresses two simple but important questions:
Have telecom-internet and media markets become more or less concentrated over time? How do we know one way or another?
Answering these questions is hard. Good data is not easy to come by and the issue is highly politicized. The public policy record groans under the weight of “expert reports” typically bought and paid for by vested interests. Consequently, as McMaster University Professor Philip Savage notes, debates over media concentration in Canada “largely occur in a vacuum, lacking evidence to ground arguments or potential policy creation either way”.
This report, which is conducted independently thanks to funding from SSHRC, aims to contribute to rectifying this problem by analyzing concentration trends across a dozen-and-a-half of the largest sectors of the telecoms-internet and media industries in Canada between 1984 and 2014: wireline and mobile wireless telecoms, internet access, television distribution (cable, satellite & IPTV), specialty and pay television, broadcast television, radio, newspapers, magazines, search engines, social media, internet news sources, internet advertising, desktop and mobile browsers and desktop and smart phone operating systems. These are the core elements of what I call the network media economy. Two fundamental layers underpin the whole thing: the carriage and content.
Two common analytical tools — concentration ratios (CR) and the Herfindahl-Hirschman Index (HHI) – are used to judge if markets are concentrated or competitive, and to chart the trends one way or another over time.
Concentration trends are assessed in each of the sectors just identified. The analysis then moves upwards to analyze the carriage, content and internet industries, and then upwards one last time to get a birds’ eye view across the whole of the telecoms, media and internet landscape. We call this the “scaffolding approach”. At the outset the reasons as to why any of this matters are presented, and some history offered to show how these concerns have manifested themselves in different times and places. In other words, we answer the why question, and why we think you should care about this issue too.
All of the data underlying this report is available via a downloadable Excel Workbook. Please use it as freely as you like for non-commercial and educational purposes in line with the Creative Commons license. A downloadable PDF of the full report can be found here. Earlier incarnations can be found here, here and here. A poster laying out “who owns what” for the top 20 or so “media companies” in Canada to help create a picture of where things currently stand.
Contentious Debates, Main Issues: Four Schools of Thought
To some, studying media concentration in an age of the internet and information abundance is anachronistic.
One hundred hours of video are uploaded to Youtube every minute; there were about 3 million Netflix subscribers in Canada in 2014; over six times as many Canadians had a Facebook account and many of them rely on the social networking site to get and share “the news”; expert blogs abound; pro-am journalists and whiste-blowers can set the news agenda; millions of websites are a click away; 695 TV channels were licensed for service in Canada in 2014, and there were 1107 radio stations and ninety-two paid daily newspapers;[1] most Canadians have a smartphone; access to a world of information is easy. On the demand side, Canadians are very extensive users of all kinds of information and communications technologies. How can concentration be a problem in this context?
If there was ever a golden media age, this is it (Thierer & Eskelen, 2008). MIT media economics professor, Ben Compaine (2005) has a terse one-word retort for anyone who thinks otherwise: Internet. Ken Goldstein agrees (see here and here). The problem is not media concentration but media fragmentation, these writers argue. The digital media giants’ walled gardens, to the extent that they exist, according to this view of the world, bring order to chaos (cacaphony), and consumers benefit from the ‘structured internet’ they are helping to bring about.
These views are shared by Canada’s largest telecom and media companies as a matter of course. As BCE said in 2013, critics allege that media concentration in Canada is high, but the evidence “regardless of the metric employed – proves otherwise” (Bell, para 46).
Furthermore, any attempt to shackle traditional media companies with ownership restrictions will likely put them at more of a disadvantage than they already are in the face of fast growing competition from global digital media behemoths such as Google, Amazon, Netflix, Facebook, and so on (Skorup & Thierer, 2012; Dornan, 2012). Again, Bell underscores the point in its most recent Annual Report: “digital advertising revenues . . . [were] lower . . due to [the] continued shift of advertising dollars to global players like Google and Facebook” (p. 68).
As the new government takes its place, the lobbying agenda is set to heat up. The incoming government needs to stand aside and let the telecoms, media and internet giants compete amongst themselves for whatever temporary dominance they might gain, a C.D. Howe report asserts. Old laws need to be dismantled, a few new rules should be adopted to match the new technological conditions at hand, and matters would be best dealt with mainly through competition law and by having the CRTC’s sails trimmed, urges the report. Otherwise, the incumbents’ attempts to invest will be futile, the results of government intervention perverse, and short-term gains for consumers offset as the development of next generation broadband internet capabilities are put in jeopardy.
This rhetoric of futility, perversity and jeopardy, however, also sounds a lot like the “rhetoric of reaction . . . in which conservative public figures, thinkers, and polemicists have been arguing against progressive agendas and reforms for the past two hundred years” (Hirschmann).
On the other hand, critics of media concentration such as Robert McChesney (2014) argue that, although there is no doubt that the digital revolution is radically changing the world, it is also becoming clear that core elements of the internet are no less prone to concentration than traditional media. Ben Bagdikian also argues that when we look at the latter, the number of media firms in the US that account for the majority of revenues plunged from fifty in 1984 to just five in the early days of the 21st Century. Canadian critics decry what they see as similar trends, and the debasement of news and the political culture of the country that has ensued as a result (here and here).
[1] Newspaper Canada redefined daily newspapers in 2014 as those that are published a minimum of four times a week and free daily papers such as the Metro papers available in large Canadian cities versus the traditional definition of every day of the week, except in some cases Sunday, as has long been the standard in the industry.
Moreover, the internet, critics argue, is draining dollars away from newspaper advertising and exposing a fundamental reality of news: most people don’t want to pay for it. Consequently, the number of newspapers and full-time journalists in the US and parts of Europe are in free fall, while under-employed journalists are turning to public relations in droves (McChesney, 2014). Similar trends apply to Canada, but have lagged behind the US by a couple of years (see the last report on this point).
A third school aims to detect the influence of changes of media ownership and consolidation by quantitatively analyzing reams of media content. They generally find that the evidence is “mixed and inconclusive” (here and here).
Such findings, however, proceed as if ‘impact on content’ is the only concern, or as Todd Gitlin put it, as if ‘no effect’ might not be better interpreted as preserving the status quo and thus a significant problem in its own right. To my mind, reducing the range of questions at hand to a focus on content is akin to trying to draw a camel through the eye of a needle.
A fourth school of thought, and one that I largely subscribe to, agrees that the shift from the industrial media of the 19th and 20th centuries to the digital, internet-centric media ecology of the 21st century does entail enormous changes. However, it also argues that these changes entail an equally momentous “battle over the institutional ecology of the digital environment” (Benkler, 2006, ch. 11).
From this perspective, the history of human communication is one of recurring ‘monopolies of knowledge” (Innis, 1951) and oscillations between consolidation and competition (John, 2010; Babe, 1990). Why should our times be any different (Noam, 2009; Benkler, 2006; Wu, 2010; Crawford, 2012)?
This approach shares some similarities with the critical school in its insistence that core elements of the digital media ecology and internet are no less prone to concentration than previous media. However, it breaks ranks on the grounds that while concentration is possible, it is not inevitable, and there are cross-cutting trends across media, over time and between countries. Moreover, outcomes turn on the specific configuration of technology, markets and politics that prevails in any given time and place. There is also more attention to empirical evidence as well as the details of specific media companies and markets in the thinking that informs this report, relative to most critical approaches and those who suggest that things are just fine.
From this perspective, the core elements of the networked digital media may actually be more prone to concentration because digitization magnifies economies of scale and network effects in many areas: mobile wireless (Rogers, BCE, Telus), search engines (Google, Bing, Yahoo, DuckDuckGo), Internet access (ISPs), music and book retailing (Apple and Amazon), social media (Facebook), browsers, operating systems, and access devices (Apple, Google, Nokia, Samsung). At the same time, however, digitization and the internet reduce barriers to entry in others areas, thereby allowing many small players to flourish. A two-tiered digital media system is emerging, with many small niche players revolving around a few enormous “integrator firms” at the centre (Noam, 2009; Wu, 2010).
Reflecting on the results of a thirty-country study, Noam (2013) finds that media concentration levels around the world are “astonishingly high” (p. 8). Insight into whether Canada ranks high, low or in between by international standards can be seen in Noam’s study, and in the discussion that follows, especially around the issue of vertical integration (also see Noam 2015).
Why Media Concentration Matters, or Who Cares?
These issues matter because the more core elements of the networked media are concentrated, the easier it is for dominant players to exercise market power, coordinate their behaviour, use tactics that aim to preserve their entrenched stakes in ‘legacy’ media sectors (e.g. television and film), lock up and leverage premium content to sell subscriptions to their more lucrative mobile phone, internet and cable services, stifle innovation, influence prices, work against market forces and subordinate the interests of consumers, citizens and the economy and society to their own interests (see here, here, here, here and here).
Large consolidated telecom, media and internet giants also make juicy targets for those who would turn them into proxies working on behalf of the copyright industries, cultural policy, efforts to block adult content, and as part of the machinery of law enforcement and national security (see here, here, here, here and here). The extent to which Google’s position at the centre of the internet has been leveraged by copyright interests and governments around the world to disable links to materials claimed to be infringing copyright, remove content, and to disclose information about its users is astounding, as its Transparency Report reveals. Indeed, such requests have soared in recent years.
In sum, the more concentrated digital media giants are, the greater their capacity to:
- turn market power into gate-keeping power and moral authority by regulating which content and apps gain access to their operating systems and online retail spaces and which cannot, as Apple’s decision to restrict adult content availability on iTunes and its removal of a fund-raising app for Wikileaks on the AppStore illustrate, for example;
- discourage the use of virtual private networks and anonymizing techniques to gird the geography and value of national media content rights markets while maximizing the identifiability and locatability of subscribers for advertising purposes;
- be used to further cultural policy goals by, for example, applying a levy on telecoms and internet access providers to be used to support Cancon and other cultural policy goals, or to use deep packet inspection technologies to discover and give priority to Canadian content while discouraging access to other kinds of “less desirable” content (Geist, 2015; Taylor, 2015);
- set the terms for owning, controlling, syndicating and selling advertising around user created content (Google, Facebook, Twitter) (van Couvering, 2011; Fuchs, 2011);
- use the media outlets they own in one area to promote their interests in another, as former Vice President Media at Bell, Kevin Crull, did on several occasions before being ousted after caught meddling in CTV’s new coverage (see Telus intervention in Bell Astral, 2.0 pages 4-6 and here, here, here and here);
- set the terms for the distribution of income to musicians, journalists and media workers, and authors (Google, Apple, Amazon);
- set de facto corporate policy norms governing the collection, retention and disclosure of personal information to commercial and government third parties.
Whilst we must adjust our analysis to new realities, long-standing concerns also remain alive. Consider, for example, the fact that in the 2011 Canadian federal election every newspaper, except the Toronto Star, that editorially endorsed a candidate for Prime Minister touted Harper. In other words, 95% of editorial opinion expressed plunked for Steven Harper – roughly three times his standing in opinion polls at the time and the results of the prior election.
In the 2015 election, similar patterns emerged. Of the ninety-two paid daily newspapers in Canada, twenty-three marshaled the energy to publish an editorial at all. Of those, seventeen newspapers representing 71% of the editorial opinion expressed lined up behind the ruling Conservatives.
The owners of the Postmedia Group, for example, directed the ten dailies that comprise its national chain of papers, and the six major Sun dailies in London, Toronto, Ottawa, Winnipeg, Calgary and Edmonton that it acquired earlier this year, to publish an editorial endorsement of Steven Harper for Prime Minister against the opposition of some of the chain’s journalists and editors (55% of expressed editorial opinion). The Globe and Mail took the peculiar stance of endorsing the Conservatives but not Harper (15.6% of expressed editorial opinion).
The wall of support was not as complete on this occasion, however. Torstar’s Toronto Star, Hamilton Spectator and Guelph Mercury (21% of expressed editorial opinion), for example, endorsed the Liberals, as did La Presse (Power Corp) (8% of expressed editorial opinion) and the Charlottetown Guardian (Transcontinental) (1% of expressed editorial opinion). No major daily endorsed the NDP, while Le Devoir cast its lot with the Bloc Québécois (representing 2% of expressed editorial opinion) (for a fuller treatment of this issue, see here).
As this discussion suggests, ultimately, talk about media concentration is a proxy for larger conversations about the shape of the mediated technological environments through which we communicate, consumer choice, freedom of the press, citizens’ communication rights and democracy. Of course, such discussions must adapt to changes in the techno-economic environment of the media, but the advent of digital media does not render them irrelevant. In fact, it may make them more relevant than ever (Baker, 2007; Noam, 2009; Peters, 1999).
Methodology: How Do We Know Whether Media Concentration is Getting Better or Worse?
Measuring media concentration begins by setting out the media industries to be studied, as done at the outset of this post. Revenue data for each of these sectors, and for each of the firms within them with over a one percent market share, is then collected and analyzed. This handy dandy list of sources and others listed here were used.
Each media sector is analyzed on its own and then grouped into three categories, before scaffolding upwards to get a birds-eye view of the entire network media ecology: (1) platform media; (2) content media: (3) online media. Results are analyzed from 1984 to 2014, with an eye to capturing changes over time. Two common tools — Concentration Ratios (CR) and the Herfindhahl – Hirschman Index (HHI) – are then used to depict and assess concentration levels and trends within each sector, the just mentioned three categories and the whole of the network media ecology.
The CR method adds the shares of each firm in a market and makes judgments based on widely accepted standards, with four firms (CR4) having more than 50 percent market share and 8 firms (CR8) more than 75 percent considered to be indicators of media concentration (see Albarran, p. 48). The Competition Bureau uses a more relaxed standard, with a CR4 of 65% or more possibly leading to a deal being reviewed to see if it “would likely . . . lessen competition substantially” (p. 19, fn 31).
The HHI method squares the market share of each firm in a given market and then totals them up to arrive at a measure of concentration. If there are 100 firms, each with 1% market share, then markets are thought to be highly competitive (shown by an HHI score of 100), whereas a monopoly prevails when one firm has 100% market share (with an HHI score of 10,000). The US Department of Justice embraced a revised set of HHI guidelines in 2010 for determining when concentration is likely to exist. The new thresholds are:
HHI < 1500 Unconcentrated
HHI > 1500 but < 2,500 Moderately Concentrated
HHI > 2,500 Highly Concentrated
At first blush, these higher thresholds seem to dilute the earlier standards that had been set back in 1992. While this may be true, the new guidelines can also be seen as being even more sensitive to reality and tougher than the ones they supersede.
This is because they give more emphasis to the degree of change in market power when ownership changes take place. For instance, “mergers resulting in highly concentrated markets that involve an increase in the HHI of more than 200 points will be presumed to be likely to enhance market power”, observes the DOJ (emphasis added, p. 19).
Second, markets are defined more precisely based on geography and the details of the good or service at hand versus loose amalgamations of things based on superficial similarities. This is critical. It distinguishes those who would define the media universe so broadly as to put photocopiers and chip makers alongside ISPs, newspapers, film and TV and call the whole thing “the media” (e.g. Skorup & Theirer; Compaine). In contrast, the scaffolding approach we use analyzes each sector before moving to higher levels of generality until reaching a birds-eye perspective on the network media as a whole.
Third, the new guidelines turn a circumspect eye on claims that enhanced market power will be good for consumers and citizens because they will benefit from the increased efficiencies that result. What is good for companies is not necessarily good for the country (see Stucke & Grunes, 2012; Mazzucato, 2014).
Lastly, the new guidelines are emphatic that decisions turn on “what will likely happen . . . and that certainty about anticompetitive effect is seldom possible and not required for a merger to be illegal” (p. 1). In practice this means the goal is to nip potential problems in the bud before they happen. It also means that experience, the best available evidence, contemporary and historical analogies as well as reasonable economic theories form the basis of judgment, not deference to impossible (and implacable) demands for infallible proof (p. 1).
These assumptions overturn three decades of Chicago School economic orthodoxy and its grip on thinking about market concentration (see Stucke & Grunes, 2012 and Posner, 2011). Freed from such orthodoxy, and the subordination of policy and politics to conservative economists, think tanks and judges, the new guidelines set a tough hurdle for those with the urge to merge. It was such thinking that killed the bid by AT&T – the second largest mobile wireless company in the US – to acquire T-Mobile, the fourth largest, in 2011, for instance (also Stucke & Grunes, 2012).
Until recently, this toughening up of the stance on concentration issues had largely passed Canadian regulators by. The CRTC’s 2008 Diversity of Voices policy, for instance, created thresholds for a broadly defined TV market whereby a proposed deal that results in a single owner having less than 35% of the total TV market will be given the green light; those that fall in the 35-45% range might be reviewed; and anything over 45% will be rejected (para 87).
The CRTC’s threshold is based on a single snapshot of a single company’s share of one broadly defined market – the total TV market –“before” and “after” a single transaction. It is a static measure that has no sense of trends over time or capacity to analyze the drift of events across media and the network media ecology as a whole.
The Competition Bureau, however, does draw selectively from the US HHI guidelines. While it does not use the HHI thresholds, it does focus on “the relative change in concentration before and after a merger” (emphasis added, p. 19, fn 31).
The CRTC began to tiptoe in a different direction in 2012 and has continued to do so ever since. Four major decisions in the past year, however, suggest that the Commission has rediscovered market power, and the will to do something about it:
- the Mobile TV decision in which it shored up common carriage (network neutrality) principles by preventing mobile wireless carriers from unjustly discriminating against television programs and other types of communications delivered over the internet in favour of some services (which can be their own but do not have to be) over others. In doing so it effectively banned the nascent practice of zero-rating whereby some content service chosen by the carriers do not count towards your data caps, but other similar types of services do. The decision is crucial because it reaffirms the principle that telecoms service and internet access providers are carriers not editors;
- the Talk TV decision requiring the adoption of skinny basic cable TV packages and the unbundling of TV channels so that they are offered fully on an ala carte basis by 2016;
- the mandated wholesale wireless framework designed to enhance competition in mobile wireless services by regulating wholesale roaming rates and other factors which affect the viability of would-be rivals such as Videotron and Wind;
- the mandated wholesale wireline decision that extends regulated wholesale access to the incumbent telecom and cable companies’ fibre-to-the-premise networks to help encourage competition in the retail high-speed, broadband internet market and ensure that competitors such as TekSavvy, Distributel, Primus and other indy ISPs can still compete as technology shifts from copper and coaxial-based networks to fibre-based facilities—moves that the incumbent telecoms and cable companies have fought tooth-and-nail, and which Bell has appealed to the incoming Liberal Cabinet to overturn.
Several fundamental principles underpin these decisions.
A key point is the CRTC’s recognition that the “incumbent carriers continu[e] to dominate the retail Internet access services market” (CRTC, 2015-326, para 125). The wholesale mobile wireless decision arrives at the same conclusion (CRTC, 2015-177, paras 35, 72-74, 86-88). Moreover, there is “limited rivalrous behaviour” between the incumbents (CRTC, 2015-326, para 123). Lastly, whatever “competition that does exist today is largely, if not entirely, a result of regulatory intervention”, states the Commission (CRTC, 2015-326, para 123).
The upshot of this recent turn of events is two-fold: first, questions of market concentration and market power are not just conjecture but legal findings of fact. Second, in the face of such realities, the regulator has stiffened its spine and acted in a manner that marks a clear break from the “regulatory hesitation” that has defined so much of the regulatory culture in Canada in the past (Berkman, 2010, p. 163).
Whether this will continue to be the case is a crucial issue. However, history and international experience teaches that in the face of intransigent and strident opposition from incumbents, only governments and regulators with a stiff spine and strong political will succeed in fostering more competition and improved developments in the communications and media fields (see, for example, Noam, 2013; Mazzucato, 2014; OECD, 2013, p. 23; Ofcom, 2012, pp. 67-68; Ofcom, 2012; Stucke & Grunes, 2012; US, DoJ, 2011; Berkman, 2010, pp. 162-168).
The Historical Record and Renewed Interest in Media Concentration in the 21st Century
While this regulatory turn around is new, a keen interest in media concentration is not. As a matter of fact, there has long been a keen interest in the subject in Canada and the world over since the late-19th and early-20th centuries, even if it such interest ebbs and wanes over time.
In 1910, for example, early concerns with vertical integration were registered when the Board of Railway Commissioners (BRC) – the distant cousin of today’s CRTC — broke up a three-way alliance between the countries’ two biggest telegraph companies — the Canadian Pacific Telegraph Company and the Great Northwestern Telegraph Co. (the latter a division of the New York-based goliath, Western Union) – and the American-based Associated Press news wire service. Why?
It did this for much the same reasons that the CRTC chose to do as it did in the Mobile TV decision discussed a moment ago. That is, because carriers should not be editors who use their control over the wires (or spectrum) to decide who gets to speak to whom on what terms.
In this historical case, and in the face of much corporate bluster, the regulator was emphatic that while allowing the dominant telegraph companies to give away the AP news service for free to the leading newspaper in one city after another across Canada might be a good way for the companies to attract subscribers to their vastly more lucrative telegraph business it would effectively “put out of business every news-gathering agency that dared to enter the field of competition with them” (1910, p. 275).
In a conscious effort to use telecommunications (railway) regulation to foster competing news agencies and newspapers, Canada’s first regulator, the BRC, forced Western Union and CP Telegraphs to unbundle the AP news wire service from their telegraph service. It was a huge victory for the Winnipeg-based Western Associated Press that pressed the case, and other ‘new entrants’ into the newspaper business as well. It was also the decisive moment when the principle of common carriage was born in Canada (Babe, 1990).
Throughout the 20th century similar questions arose and were dealt with as the situation demanded. One guiding rule of thumb of communications policy, however, was that of the “separations principle”, whereby telecoms carriers – usually two of them, e.g. telegraph vs telcos in the early 1880s, the TransCanada Telephone System (TCTS) and CNCP for three-quarters of the 20th century, the telcos vs cablecos ever since, and the telcos’ consortium Stentor versus Rogers/Cantel in the early days of mobile wireless from 1985 until the mid-1990s — competed to carry messages from all types of users, and for all types of purposes – business, personal, governmental and broadcasting – but were prevented by law from directly creating, owning or controlling the messages that flowed across the transmission paths they owned and controlled.
A general concern also hung in the air in government, business, broadcasting and reformist circles that those who made communications equipment, or operated transmission networks, should not operate broadcast stations, make movies or publish newspapers, books, software, etc. That this was so could be seen, for example, when the original equipment manufacturing consortia behind the British Broadcasting Company in the UK and the National Broadcasting Company / Radio Corporation of America in the US, respectively, were ousted from the field in the 1920s during the remaking of these entities into the stand-alone broadcasters that they eventually became. Nor should telephone companies such as AT&T play an active role in the film industry, as was the case when, after having wired movie theatres across the US and the Hollywood production studios for sound, circa 1927ff, AT&T took on a larger role by financing and vetting films during the 1930s (see Briggs, 1995; Barnouw, 1966; Danelian, 1939).
The consolidation of broadcasting under the CBC in the 1930s brought private broadcasters into the core of the Canadian ‘broadcasting system’ from the get-go. The creation of the CBC also wiped out important local, foreign and educational voices, and even a small theatrical radio club in Winnipeg who were taking live theatre from the state to the airwaves. In each case, it was the structure and organization of the communication / media system, and who owned what and in what proportions, that decided who got to talk to whom on what terms.
The separation of transmission and carriage from message creation and control was another principle that was worked out in a myriad of different ways. Aside from keeping the telegraph companies out of the news business, and telephone companies out of broadcasting and the movie business, most of the time such issues were considered tedious, boring, and tucked away in obscurity in parliamentary papers, legislation and corporate charters.
Bell’s charter, for instance, prohibited it from entering into ‘content and information publishing services’, from radio to cable TV and ‘electronic publishing’, until the early 1980s, when more and more exceptions to the general rule were adopted. The same was true for other telcos, private and public, across the country, even though Manitoba and Saskatchewan began to lay fibre rings in a few key provincial cities and offer modest cable TV services in the 1970s (Babe, 1990; Winseck, 1998).
Media concentration issues also came to a head in the 1970s, for example, and again at the beginning of the 1980s, when three inquiries were held: (1) the Special Senate Committee on Mass Media, The Uncertain Mirror (2 vols.)(Canada, 1970); (2) the Royal Commission on Corporate Concentration (1978); and (3) the Royal Commission on Newspapers (Canada, 1981). While these proceedings did not mount to much, they left a valuable historical and public record.
Things lay dormant for more than two decades before springing to life again after a wave of consolidation in the late-1990s and at the turn-of-the-21st century thrust concerns with media concentration back into the spotlight. Three inquiries between 2003 and 2008 were held as a result: (1) the Standing Committee on Canadian Heritage, Our Cultural Sovereignty (2003); (2) the Standing Senate Committee on Transport and Communications, Final Report on the Canadian News Media (2006); (3) the CRTC’s Diversity of Voices report in 2008.
Things have not let up since. Indeed, they have been on a high boil in recent years, with a non-stop series of reviews at the CRTC that will go a long way to shaping the emergent internet-centric media ecology for decades, including, for instance: (1) Bell’s take-over of Astral Media, (2) the regulated wholesale access decisions affecting both the mobile wireless and wireline telecoms markets, respectively, (3) the Mobile TV decision and (4) a series of cases now underway (or recently concluded) that test the extent to which vertically-integrated telecom-media giants such as Rogers, Bell and Videotron’s can leverage their control over networks to influence the content made available over those networks (see, for example, Videotron’s Music Unlimited case or the Rogers GamePlus and Hybrid Video-on-Demand decisions).
Competitive Openings and Three Phases of Telecom, Media and Internet Consolidation
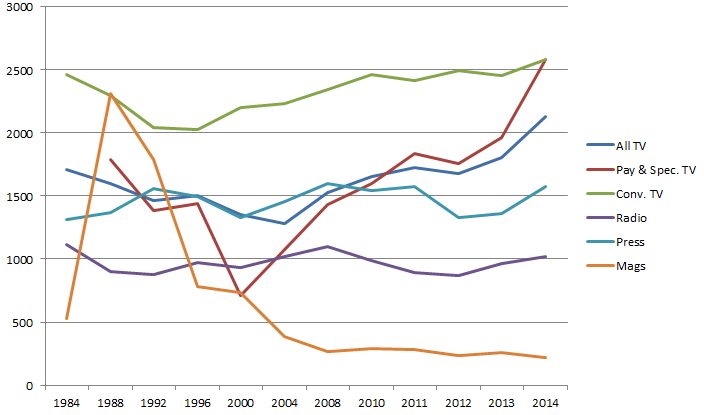
All of this is taking place, as I noted in the last report, within an ever more internet- and mobile-centric media economy that has grown immensely from $19.4 billion in 1984 to $75.4 billion last year.
The early years of that period (the decade between 1984 and 1996), was characterized by the emergence of new players across the media landscape and the growth of broadcast as well as pay and subscription television channels. In terms of ownership, existing players and a few newcomers, such as Allarcom and Netstar, cultivated the field.
During this period, television and radio broadcasters were often owned by companies whose interests lay in other, unallied areas, such as real estate, as with the BC TV and radio group Okanagan Skeena, or Molson’s Brewery, one of the founders of Netstar early in that entity’s history. These companies share of the market grew steadily until they were taken over by the larger players of their time, however, the generation direction of events was towards more players and, thus, toward more diversity in television ownership.
When consolidation did take place in the 1980s and 1990s it was mostly among individual players in single media markets. Conrad Black’s take-over of Southam newspapers in 1996 symbolized the times as did the amalgamation of local and regional television ownership groups at the end of the 1990s to create several national commercial television networks under common ownership: CTV, Global, TVA, CHUM, TQS.
While weighty in their own right, these amalgamations did not have a big impact across the media. The CBC remained prominent, but public television was being eclipsed by commercial television as the CBC’s share of all resources in the television ‘system’ slid from 44 percent in 1984 to less than half that amount today (19.6%).
Media conglomerates were not unknown (Maclean-Hunter was a good example), but they were not the norm. Bell was a diversified communications colossus, to be sure, but it was not in the media business proper, and was prevented by its charter and by law from being so.
In contrast to broadcasting any most other content media industries, concentration levels remained sky high in wired line telecoms, while new mobile wireless telecoms services were developed by two sets of competing firms: between 1983-1984, Rogers-Cantel was licensed by the Department of Communication to offer national wireless service, while 11 incumbent telephone companies (e.g. Bell Canada, Telus, MTS, Sastel) received licenses to provide competing services in their respective operating territories (Klass, 2015, pp. 58-61).
Gradual policy reforms characterized the 1980s and early-1990s, before a more concerted shift took place with the introduction of long distance competition in 1992, two new national competitors in wireless in 1995 (Clearnet and Microcell) and local telephone competition in 1997. The Chretien Liberals also gave the green light for the telephone and cable companies to compete in one another’s respective areas of dominance in 1996. Concentration rates fell across the board, except in cable television distribution.
In general, telecoms competition moved slowly from the ends of the network into services and then deeper into the network infrastructure, as it had done in one country after another around the world, aided and abetted by strong government interventions that used interconnection and network unbundling rules, access to spectrum, wholesale pricing regulation, and market liberalization to actively spur on competition. Competition gained traction in the 1990s as a result but the trend was thrown into reverse by the dot.com crash in late-2000.
Whereas gradual change defined the 1980s and early-1990s, things shifted abruptly by the mid-1990s and into the 21st century when three waves of consolidation swept across the media, telecom and internet industries. A few highlights help to illustrate the trends:
Wave 1: 1994 to 2004: Rogers’ acquisition of Maclean-Hunter (1994), but peaking from 1998 to 2001: (1) BCE acquires CTV and the Globe & Mail ($2.3b); (2) Quebecor takes over Videotron, TVA and the Sun newspaper chain ($ 7.4b) (1997-2000); (3) Canwest buys Global TV ($800m) and Hollinger newspapers papers, including National Post ($3.2b); (4) Telus acquires Clearnet ($6.6B, the largest acquisition in Canadian telecommunications history at the time) (2000).
Wave 2: 2004-2007: Rogers acquires Microcell ($1.4B) (2004). Bell Globemedia re-branded CTVglobemedia; BCE exits media business. CTVglobemedia acquires CHUM (Much Music, City TV channels and A-Channel). CRTC requires CTVglobemedia to sell City TV stations – acquired by Rogers (2007). Astral Media’s buys Standard Broadcasting. Quebecor acquires Osprey Media (mid-size newspaper chain)(2006). Canwest, with Goldman Sachs, buys Alliance Atlantis (2007) (Showcase, HGTV, BBC Canada and biggest film distributor in Canada).
Wave 3: 2010 – 2015: Canwest goes bankrupt (2009-2010), its newspapers acquired by Postmedia and TV assets by Shaw. BCE makes a comeback, buys CTV (2011) and bids for Astral Media in 2012, but fails to gain CRTC approval, before gaining the regulator’s blessing in 2013. Bell sells Teletoon (TELETOON Retro, TELETOON Retro, TELETOON / TELETOON and the Cartoon Network), Historia and Séries+ to Corus (Shaw), the Family Channel, Disney Jr. and Disney XD to DHX media, and MusiquePlus and MusiMax to V Media, as well as ten radio stations to Newcap (5), Pattison (3) and Corus (Shaw)(2) – as the Competition Bureau and CRTC required as a condition of approval of Bell’s take-over of Astral media in 2013; Telus acquires Public Mobile (2013); Rogers acquires Mobilicity ($465M)(2015); Postmedia acquires Quebecor’s English-language papers (e.g. including the six Sun dailies, 27 small dailies and 140 community weeklies) (2015) (also see Competition Bureau approval).
The massive wave of capital investment that drove consolidation across the telecom, media and Internet industries during these different phases is illustrated in Figure 1 below.
Figure 1: Mergers and Acquisitions in Media and Telecoms, 1984–2014 (Mill$)
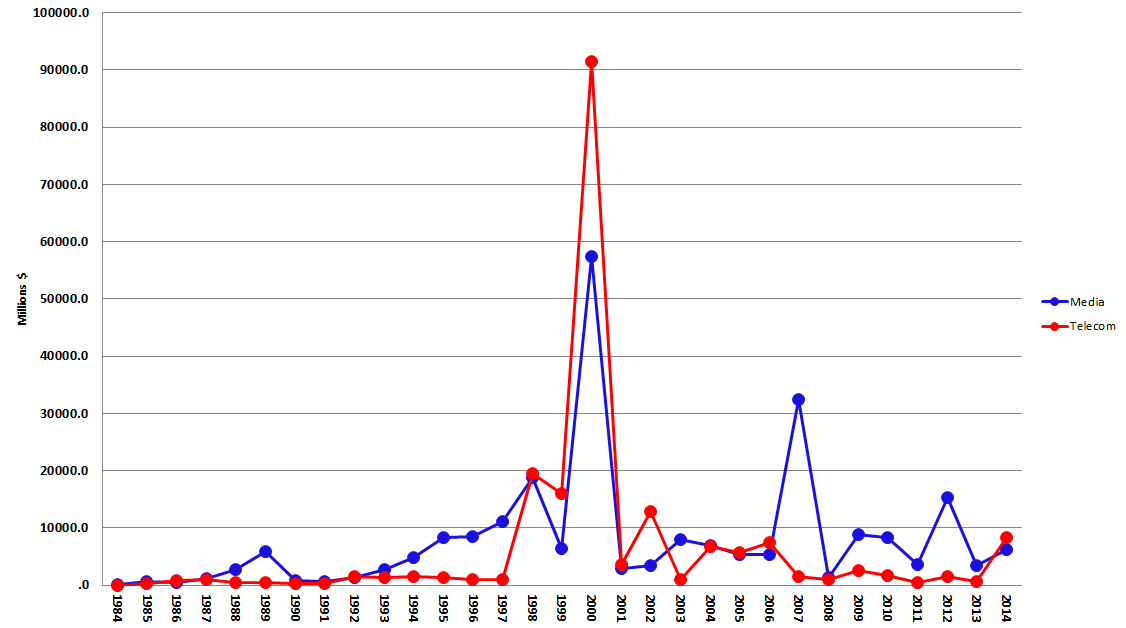
Sources: Thomson Reuters + CRTC CMR, pp. 72 & 118 (TV & Radio) and author compilation for 2014. Dataset on file with author.
Mergers and acquisitions rose between 1994-1996, spiked to unprecedented levels by 2000, and then collapsed when the bursting of the dot.com bubble brought things crashing to a halt. Consolidation regained steam between 2004 and 2007, then plunged with the onset of the Global Financial Crisis (2007ff), before rising significantly in four of the past six years. Again, trends in the network media economy swiveled on those evident in the economy at large.
Consolidation in the telecoms industry has been low for the past half-decade but a significant uptick has taken place since Telus bought Public Mobile in 2013, Bell’s acquired the stake in Bell Aliant that it did not already own last year and Rogers acquired (and then dismantled) Mobilicity in 2015. On the media side, however, as Figure 1 illustrated, things have surged.
Shaw’s take-over of Global TV in 2010, with its suite of thirty specialty and pay TV channels and nine television stations, from Canwest (2010) as well as Bell’s re-purchase of CTV (2011) and take-over of Astral two year’s ago, respectively were responsible for the trend (includes joint ownership stake in Maple Leaf Sports and Entertainment) (see Pay & Specialty Channel List, sheet 2; BCE, Annual Report, p. 29). The latter set of deals transformed Bell into the biggest TV and radio broadcaster in the country, with a suite of thirty broadcast TV stations, forty-four specialty and pay TV channels and 106 radio stations in fifty-four cities nationwide.
Consolidation in the TV industry has been the result. More importantly, though, consolidation has yielded a specific type of media company that now sits at the apex of the network media universe in Canada: i.e. the vertically-integrated telecoms, media and internet conglomerate. Vertical integration has soared and is now very high relative to the past and to conditions in the United States and internationally. Figures 2 and 3, below, illustrate the steep increase in vertical integration occurred between 2008 and 2013.
Figure 2: Vertical Integration and the Network Media Ecology, 2008
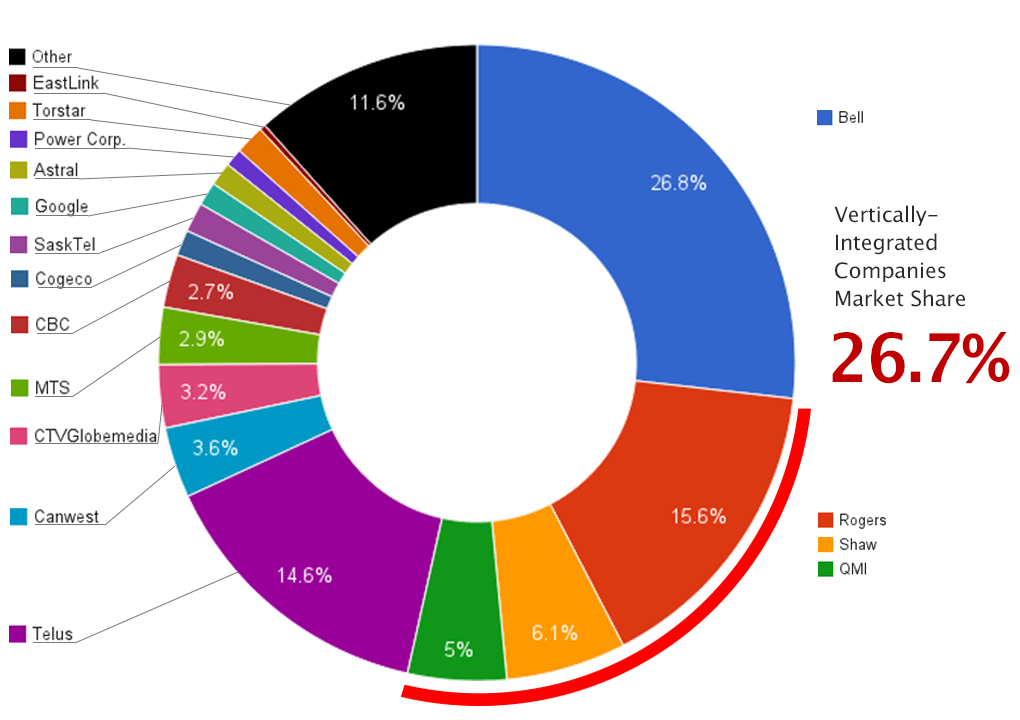
Sources: see the “Top 20 w Telecoms” sheet in the Google Docs Workbook.
Figure 3: Vertical Integration and the Network Media Ecology, 2014
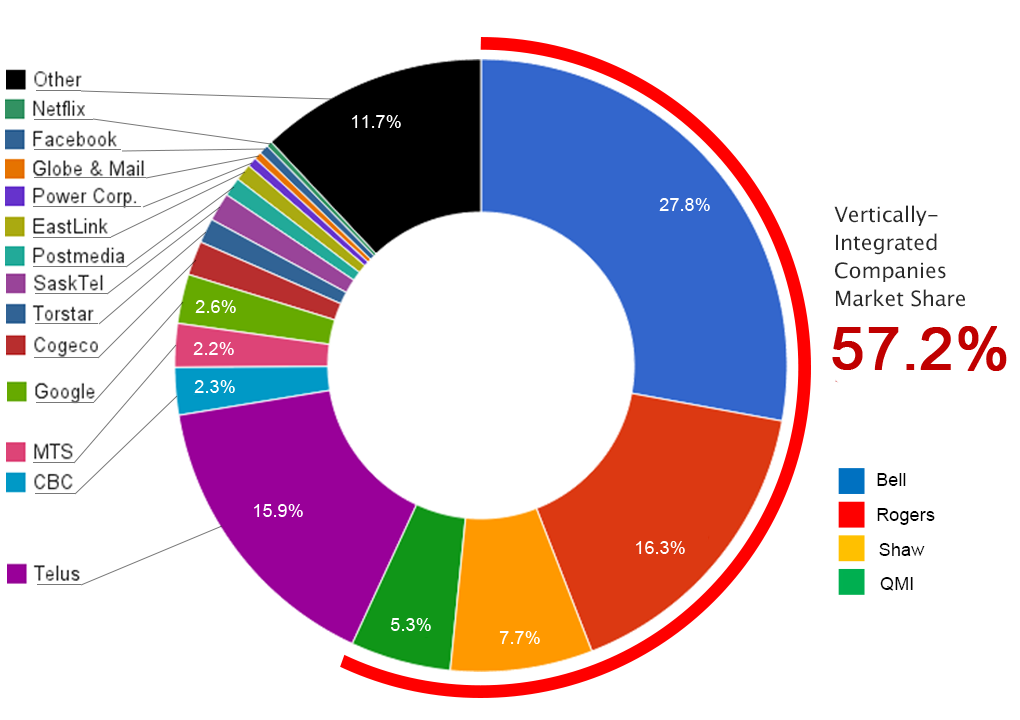
Sources: see the “Top 20 w Telecoms” sheet in the Google Docs Workbook.
As Figures 2 and 3 illustrate, in the span of six years, the share of overall network media economy revenue held by vertically integrated entities in Canada more than doubled. By 2014, four giant vertically-integrated TMI conglomerates accounted for 57.2% of all revenue across the whole of the network media economy: Bell (CTV), Rogers (CityTV), Shaw (Global) and QMI (TVA), as Figure 3 shows.
These developments are important for several reasons. First, they distinguish the past from the present. Centre stage is currently occupied by a handful of vertically-integrated telecoms, media and internet giants with a reach across the network media ecology, or five if we include Telus on account of its fast growing role in television distribution. Zero in on just telecoms and broadcasting, and the ‘big 5’ accounted for roughly two-thirds of all revenue in 2010. By 2014, that figure had soared to 83%.
Second, these five companies’ control over communications infrastructure (content delivery) is the fulcrum of their business. Their stakes in content media, while extensive, are modest; Telus is not in the content business at all beyond buying rights for its Optik IPTV and mobile TV services. For Quebecor, Shaw, Bell and Rogers, 70-90% percent of their revenues flows from their control over bandwidth and connectivity rather than from content creation and exhibition. Figure 4 below illustrates the point.
Figure 4: Connectivity vs Content within Canada’s Vertically-Integrated Telecoms and Media Companies, 2014 (Ratio by Revenue)
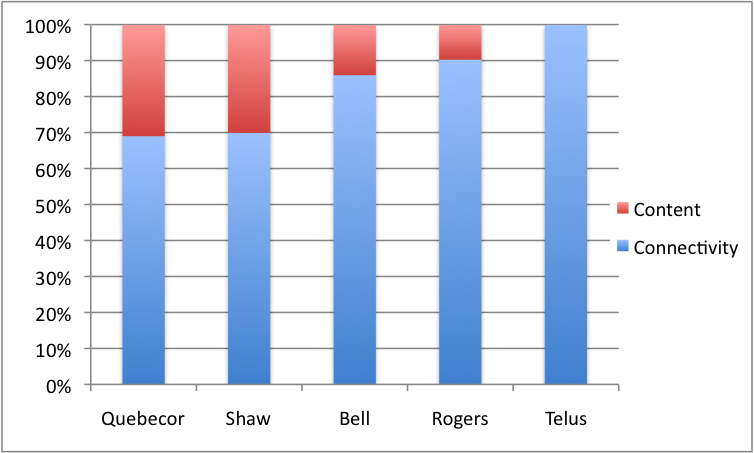
Sources: see the “Top 20 w Telecoms” sheet in the Google Docs Workbook.
Content media have largely become but ornaments on the carriers’ organizational structures. They are strategically important but subordinate to the fact that their real purpose seems to be to drive the take-up of the companies’ wireless, broadband internet, and cable, satellite and IPTV services. The fact that nearly half (e.g. 40%) of the roster of Bell’s Mobile TV service, for example, is filled with channels it owns illustrates the point: CTV, CTV News Channel, CTV Two, Business News Network, Comedy Network, Comedy Time, MTV, NBA TV, NHL Centre Ice, E!, RDS, RDS2 and TSN, TSN2.
The CRTC has already determined in the Mobile TV case that Bell was using its control over the means of delivering television programming to confer an undue preference on its services at the expense of subscribers, rivals and independent sources of content available over the internet. Yet, Bell has appealed that ruling to the Federal Court of Appeal, demonstrating the lengths to which the vertically integrated companies are willing to go to protect their ability to offer services as they please.
Other cases like Mobile TV, however, are emerging one after another in what appears to be a never ending game of regulatory whack-a-mole: see, for example, the complaint initiated by J. F. Mezei and the Public Interest Advocacy Centre against Videotron’s Music Unlimited now before the CRTC, or the Commission’s Hybrid Video-on-Demand decision, or Bell’s appeal of the wholesale vertical integration code, to name just a few. The thread connecting them all is the extent to which content is being tied to carriage in ways that raise crucial questions about the future of common carriage (“network neutrality”) and ‘the open internet’. These cases are the crux over which the “battle over the institutional ecology of the digital environment” is being waged, as Yochai Benkler once put it (pp. 383-460).
Vertical integration is not just high by historical standards in Canada, it is high relative to the United States and by international standards. Figure 4 below illustrates the point with respect to the United States.
Figure 5: Top Telecom-Internet and Media Companies in the US, 2013 (Market Share)
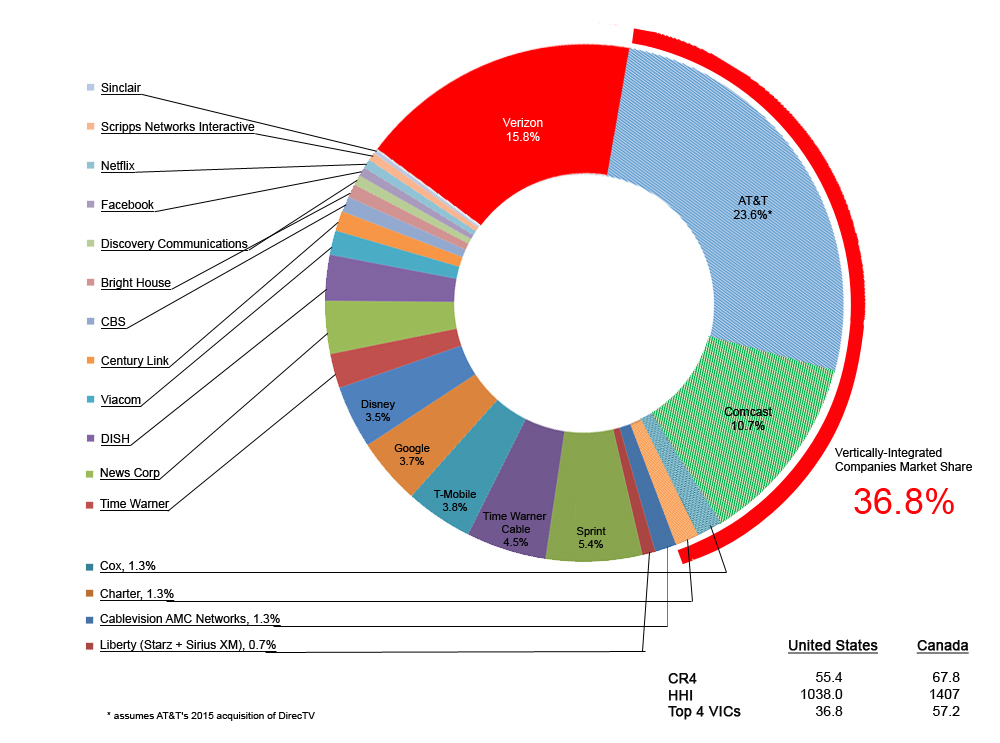
Sources: see the “Top US Telecom + Mediacos” sheet in the Google Docs Workbook.
Figure 6 below uses the most recent data available for the twenty-eight countries covered by the International Media Concentration Research Project (2009) and for Canada for the years covered by that project and 2013 in order to take account of Shaw’s acquisition of Global TV in 2010 as well as Bell’s acquisition of CTV and Astral Media in 2011 and 2013, respectively. It does so to illuminate the extent of vertical integration in Canada relative to international standards.
Figure 6: Vertical Integration and Cross-Media Ownership — Canada in a Global Context, 2004 – 2013
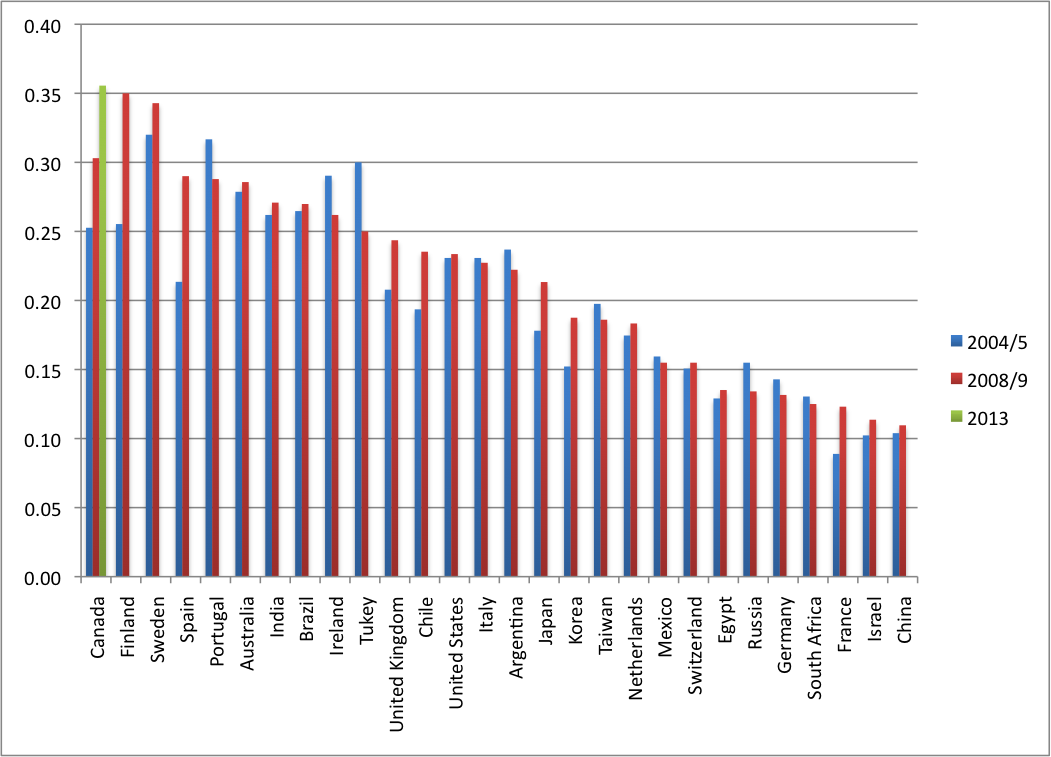
Sources: see the “Top 20 w Telecoms” sheet in the Google Docs Workbook and International Media Concentration Research Project.
Figure 5 reveals several interesting points. For one, it shows that Canada has long been closer to the high end of the scale when it comes to vertical integration and cross media ownership than to the low end. It ranked 19th out of 28 in 2004. By 2009, however, it had moved much closer to the top of the scale, with the third highest levels of vertical integration, after Finland and Sweden. In 2013, and after Shaw and BCE acquired Global TV, CTV and Astral Media, respectively, Canada had the highest levels of vertical integration and cross-media ownership out of the 28 countries studied.
While it is possible that similar processes took place in other countries after 2009, I am unaware of similar processes of such magnitude anywhere else. There has been a significant increase in vertical integration in the United States on account of Comcast’s acquisition of NBCUniversal in 2011, and this year’s acquisition of DirecTV by AT&T, but even after these transactions are accounted for, conditions in the US are still nowhere near what they are in Canada. Moreover, in most countries, the trend over the time period examined was in the opposite direction.
Indeed, as scholars from across the political spectrum have chronicled, while popular within the industry and amongst the mergers and acquisition crowd in the late-1990s, the tide toward vertical integration has by-and-large turned since the early-2000s. Since then, media conglomerates have been dismantled or failed outright (e.g. AOL Time Warner, AT&T, Vivendi, Adelphia, CBS-Viacom, News Corp, etc). Cast in this longer and broader context, Comcast’s acquisition of NBCUniversal in 2011 and AT&T’s take-over of DirecTV in 2015 in the US are exceptions to the general rule (Picard, 2011; Jin, 2013; Skorup & Thierer, 2012; Thierer & Eskelen, 2008; Waterman & Choi, 2010).
The main trend, as Dal Yong Jin observes, since the mid-2000s has been toward vertical dis-integration and de-convergence.
The following sections double back to look at developments over time sector-by-sector, and within the three main categories we use to group each of the sectors covered by the CMCR project:
- platform media (wireline & wireless, ISPs and cable, satellite, IPTV);
- ‘content’ (newspapers, tv, magazines and radio);
- ‘online media’ (search, social media, online news sources, desktop and mobile browsers as well as desktop and smart phone operating systems).
At the end, I combine these again one last time to complete the analysis and gain a bird’s eye view of the network media industries as whole.
Platform Media
All sectors of the platform media industries are highly concentrated or at the high-end of the moderately concentrated scale, although Internet Access continues to be a partial exception. This has long been the case, although with important exceptions, past and present.
Table 1: CR and HHI Scores for the Network Infrastructure Industries, 1984 – 2014
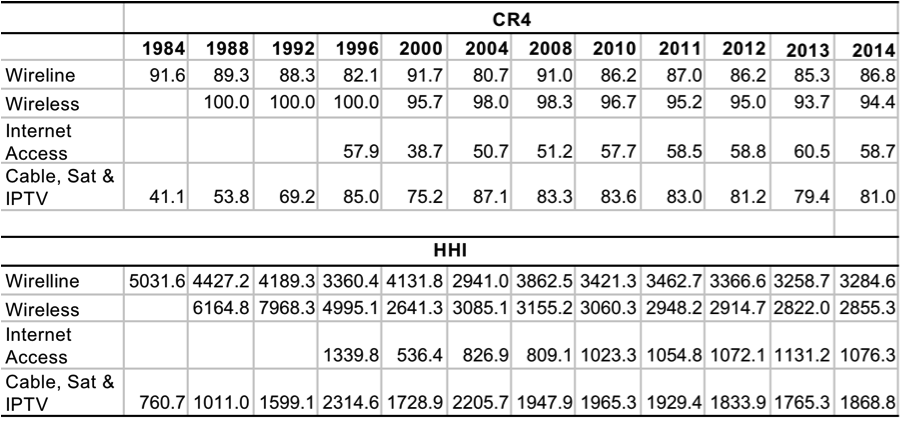
Sources: see the “CR & HHI” sheet in the Google Docs Workbook + individual sheets for each sector.
CR4 and HHI measures for wireline telecoms scores fell in the late-1990s as competition gained traction, sped along by the introduction of long distance competition in 1992 and local telephone competition five years after that. Concentration in this sector reached its lowest levels ever between 2000 and 2004 as a result before the effects of the dot.com bubble collapse wiped out many of the new rivals with it (CRTC, 2002, p. 21).
Competition waned thereafter until 2008, but has risen slightly since, albeit with a slight uptick in concentration last year. Concentration remains very high nonetheless by both the CR4 and HHI measures.
Mobile Wireless
Some recent studies argue “that there is not a competition problem in mobile wireless services in Canada” (see here, here, here).[1] They also claim that, relative to international standards, concentration levels in mobile wireless services in Canada are at the low end of the range, and have fallen in recent years. The Canadian market is actually competitive and becoming more so, they claim.
CR and HHI scores have drifted downwards since 2008 when the Conservative government began to use spectrum policy and a series of new rules to more aggressively encourage new entrants to enter the market. Following the 2008 auction of “advanced wireless services” (AWS) spectrum, in which Industry Canada reserved spectrum exclusively for new firms, four “new entrants” joined the field: Wind, Videotron (Quebecor), Public Mobile and Mobilicity. Eastlink, a subsidiary of diversified conglomerate Bragg, won spectrum in the 2008 auction, technically making it a fifth “new entrant,” but for reasons unknown it waited until 2013 to launch service in its home territories in the Maritimes.
The initial years were rocky for most of the new entrants. A challenge to Wind’s ownership was mounted by the CRTC in 2008/9 upon petition by Shaw and Telus; the Commission determined that Wind did not meet the foreign ownership criteria, creating uncertainty for the company’s future (Klass, 2015, pp. 74-76). The CRTC’s decision was overturned by the Conservative Cabinet in 2009, with the net effect being a major delay for the young wireless competitor. By the end of 2014, Wind had around 800,000 subscribers, and has recently received much needed investment from American sources, made possible by a 2012 amendment to the Telecommunications Act allowing small telecommunications companies to be completely foreign-owned.
Other new entrants have not fared well. Public Mobile failed in 2013, and was acquired by Telus. Similarly, Mobilicity was acquired by Rogers in 2015 following nearly two years spent under creditor protection.
Videotron, by contrast, appears to have fared quite well; it has struck network sharing agreements with Rogers in its home province of Québec, and in 2014 it purchased licenses for the desirable 700MHz spectrum in BC, Alberta, and Ontario, fuelling speculation that the company was preparing for a national expansion. Although Videotron has since announced that it has no such plans, its market share within Québec continues to rise, suggesting that it has found a viable space in the wireless business.
By 2014, the combined national marketshare of the remaining new entrants had crept upward to 3.1%. Include MTS and SaskTel in the group and, combined, the new entrants and smaller regional incumbents accounted for 7% of wireless revenues according to the CMCR Project’s data, or 8% according to the CRTC (see “Wireless” sheet in the Google Docs Workbook and CRTC, 2015 CMR, Figures 5.5.6).
While some modest gains have been made, Rogers (33.2%), Telus (30.2%) and Bell (28.8%) accounted for 92.2% of the market by revenue at the end of 2014, or 90% when measured by the number of subscribers (see “Wireless” sheet in the Google Docs Workbook and CRTC, 2015 CMR, Figures 5.5.5 & 5.5.6). The HHI score for mobile wireless in 2014 rose slightly to 2855 — far above the 2500 threshold that marks a highly concentrated market (see “Wireless” sheet in the Google Docs Workbook).
Moreover, national measures of concentration understate conditions in specific provinces, regions and cities. The least concentrated market in Canada is in Quebec, where Bell (33.8% share of revenues), Rogers, (29.7%), Telus (29.7%) face challenge not only between themselves but from Videotron as well. Videotron’s share of the Quebec market grew to 6.9% last year — up from 6.3% a year earlier. Compared to Ontario, Alberta, and BC, the competitive scene in Quebec appears to have resulted in price relief for certain service tiers — between 15 and 30% for high-usage plans, according to providers’ online sites — although it is worth noting that entry-level tiers across the provinces just mentioned remain similarly priced. Eastlink launched its own mobile wireless service in the Maritime Provinces in 2013 but it is still too early to see the results — an outcome made all the more difficult by the company’s tight-fisted approach to the public release of information.
In Quebec, the top two wireless companies had a combined market share of 63.4% — the lowest in the country by a large margin. The figures were in the 73-77% range in Alberta, Ontario and British Columbia in contrast, and much higher yet in Saskatchewan (81%), New Brunswick (83%), Manitoba (84%), Nova Scotia (86%), PEI (88%) and finally Newfoundland, Labrador and the Far North (99%) (CRTC, 2015).[2] The geography of competition is limited.
That being said, communications markets do not always neatly conform to economic metrics. An example of this can be found by examining the mobile wireless markets in Manitoba and Saskatchewan. Each of those provinces’ wireless markets are dominated by the incumbent local exchange carriers (ILECs), MTS and Sasktel, who controlled 50% and 66% of total subscribers in their respective territories at the end of 2014 (see unpublished CRTC data here). Although Sasktel and MTS are the two most dominant wireless providers by provincial market share, the competitive situation in the prairies evinces lower prices and a greater degree of choice amongst service offerings than found elsewhere in Canada, not just from the ILECs but from the competing national carriers as well.
For instance, both Sasktel and MTS offer mobile plans that include unlimited voice calling and unlimited mobile broadband usage on their province-wide networks, whereas ‘unlimited data’ is not to be found elsewhere in Canada, save within Wind Mobile’s footprint, which is largely limited to urban areas and does not yet feature LTE speeds. Additionally, the national carriers offer prairie customers plans that are similar to those popular in other provinces, but at deep discounts. Although CR4 scores are broadly similar across provinces, and HHI scores all fall within the “highly concentrated” range, competitive dynamics nevertheless differ from place to place, and understanding the facts behind the figures often benefits from this kind of analysis.
The limits to competition are also illustrated by the fact that two of the new entrants have failed: Public Mobile and Mobilicity. Public Mobile was acquired by Telus in 2013 and shut-down the next year. Mobilicity was taken over by Rogers this year and then dismantled in a complex series of spectrum exchanges, much to Wind’s benefit, which picked up additional spectrum in Manitoba before selling it on to MTS.
The demise of Public Mobile and Mobilicity have largely redounded to the benefit of Wind and Videotron, which both saw their share of the ‘national mobile wireless market’ rise from 1% to 1.3%, respectively, or a combined 2.6% in total. Whatever gains have been had in the past few years are still far off the high-water mark of the late 1990s when two new rivals, Clearnet and Microcell, garnered 13% of the market between themselves before being taken over by Telus and Rogers in 2000 and 2004, respectively. Plus ça change, plus c’est la meme chose, as Daniel Paré has observed.
The CRTC was forthright in the Regulatory Framework for Wholesale Mobile Wireless Services decision in summing up what all this means for today:
- there has been very little change in retail market shares (either by revenue or by number of subscribers) in Canada in the past five years, despite entry into the market by several wireless carriers (para 35);
- the barriers to entry into the retail market are very high and the likelihood of new entry in the short to medium term is low (para 72);
- Rogers, Bell and Telus collectively possess market power in the national market for GSM-based wholesale roaming (para 74);
- Bell, Rogers and Telus “collectively possess market power in the national market for GSM-based wholesale MVNO access” (para 88); and
- “there is no rivalrous behaviour between the national wireless carriers in the provision of GSM-based wholesale MVNO access at a national level” (para 86).
The CRTC’s Wireless Framework decision highlights another interesting characteristic of the Canadian wireless market: the total lack of mobile virtual network operators, or MVNOs. As demonstrated by the CMCR Project’s 2013 report, Mobile Wireless in Canada: Recognizing the Problems and Approaching Solutions, MVNOs play an important role in wireless markets around the world, both from an economic and from a policy perspective. Regulators around the globe have taken steps to foster open access to wireless networks in order to spur competition from MVNOs.
In its recent decision, the CRTC determined that the national facilities-based wireless carriers had market power over third-party access to their networks, and had denied service to would-be competitors. While it took steps to encourage the entry of MVNOs, it stopped short of mandating access to the national carriers’ networks. In the absence of such a mandate, it is unlikely that third party service providers will emerge to provide market discipline similar to the way companies like Teksavvy, Distributel, and Primus have done under the mandated access regime that applies to Canada’s wired broadband networks.
In sum, no matter how one looks at it, by city, region, province, or country, or by revenue, subscribers, or spectrum held and used, mobile wireless services are highly concentrated. While the prevailing CR and HHI levels in Canada are not especially high by international standards, the more pressing point is that concentration levels in mobile wireless markets around the world are, with few exceptions, “astonishingly high” (Noam, 2013, p. 8).
Given this, the real question is what, if anything, will be done about this state of affairs? The CRTC’s recent actions have begun to address that question.
Internet Access
As the telecoms and Internet boom gathered steam in the late 1990s new players emerged and become significant competitors. Indeed, by 1996, the incumbent telephone and cable companies’ share of the internet access market was minimal while four relative newcomers accounted for over a third of the market: AOL (12.1%), Istar, (7.2%), Hook-Up (6.3%) and Internet Direct (6.2%). As a general observation, incumbents were slow to arrive and in the meantime new players stepped into the breach to develop internet access in Canada.
The early ‘competitive ISP era’ continued up to the turn-of-the-century but subsided thereafter on account of, first, the collapse of the dot.com bubble, when many of the early ISPs went out of business and/or were absorbed by larger players, and second, the switch-over from dial-up to high speed internet access. By 2000, the big four’s (Bell, Shaw, Rogers & Telus) share of the internet access market had grown to 39%, but this was still one of the most competitive sectors of the network media economy at the time.
The industry has steadily consolidated around the incumbent telephone and cable companies since. By 2004, the top four firms accounted for roughly half of all revenues. That number grew to 58% by 2010, where it has stayed relatively stable for the last five years. The top five companies – Bell, Rogers, Shaw, Telus and Videotron, in that order – accounted for 69% of all revenues, by our measure, or 74% of the retail internet access market, according to the CRTC’s figures (p. 187).
The HHI score for internet access doubled between 2000 and 2014, but it is still low relative to most other sectors and for this measure’s standards for concentration. However, this also reflects the limits of this measure. A closer look shows that 90.6% of the residential retail internet access market is accounted for by the incumbent telcos and cable companies on the basis of revenue or 89.3% when measured on the basis of subscribers, for example (CRTC CMR, Tables 5.3.2 and 5.3.4).
Broaden the measure to include both the wholesale and retail internet access markets, and the incumbent telcos and cable companies accounted for just under four-fifths of the market by revenue: Bell (22.1%), Rogers (14.1%), Shaw (12.8%), Telus (9.9%), Videotron (9.8%), Cogeco (4.4%), Eastlink (2.3%), SaskTel (1.6%) and MTS (1.4%) (see “ISP” sheet in the Google Docs Workbook). The two biggest indy ISPs – TekSavvy (242,000 subscribers) and ExplorNet (225,000)[3] – account for 3% of revenues, in contrast.
In short, when assessed at the local level, rather than on the basis of national HHI scores, the telcos and cable companies’ dominance of local markets across the country is brought into sharper relief. The upshot is that while the national HHI standard implies a highly competitive market, a closer inspection reveals quite the opposite, with local internet access markets in cities across the country highly concentrated, with exceptions in very densely populated urban areas where wholesalers provide access.
According to the CRTC, there are about 525 independent ISPs scattered across the country, and altogether they accounted for 12% of retail internet access revenues in 2014. The indy ISP’s share of the retail internet access market has crawled upwards slightly over the past five years (CRTC CMR, Tables 5.3.2 and 5.3.3), but concentration at the local level remains stubbornly high.
Such observations underpinned the CRTC’s decision earlier this year that found that the indy ISPs will still need regulated wholesale access to the incumbents’ local Fibre-to-the-Premise networks if they are not to be left to wither on the vine as internet access migrates from copper and coaxial cables to fibre to the doorstep. The Commission’s decision did not mince words:
- “incumbent carriers continu[e] to dominate the retail Internet access services market” (para 125);
- “there is limited rivalrous behaviour to constrain upstream market power” (para 122);
- wireless Internet access is not an acceptable substitute for wireline facilities on the grounds of significant disparities in terms of price, speed, capacity and quality (para 126);
- whatever “competition that does exist today is . . . a result of regulatory intervention” (para 126).
This was much the same reasoning that underpinned the Commission’s wholesale mobile wireless decision earlier in the year. In both cases, having found that concentration was not a matter of conjecture but of fact, the regulator decided to act, in the case just discussed to help ensure that whatever minimal competition that does exist today is not washed away tomorrow by the transition to fibre-based internet access. Bell is now petitioning the incoming Liberal Government to over-turn the decision.
Cable, Satellite and IPTV
Concentration in cable and satellite distribution rose steadily from low levels in the 1980s (761) to the upper end of the moderately concentrated zone (by the new HHI guidelines) in 1996 (HHI=2315), before falling back at the turn-of-the-21st century, when the HHI reached a contemporary low of 1729. Trends swung upwards over the next half decade, but have fallen significantly over the past decade, especially since as the telcos’ roll-out of IPTV began to cut ever more deeply into the cable companies’ territory.
As noted in the last report, by the end of 2014, 15% of Canadian households got their television service from the local telephone company: e.g. Telus, Sasktel, MTS or Bell. These companies’ Internet Protocol TV (IPTV) services grew swiftly to 2,046,882 subscribers with revenues of $1.6 billion in the last year. The quick pace of growth has intensified competition between the telephone and cable companies’ TV distribution services. By the end of last year, the telcos garnered close to one-in-five cable TV subscribers (or 15% by the CRTC’s data) (see the CRTC’s CMR Table 4.3.1) (see the last report for an explanation of the differences).
While many claim that widespread cord cutting is hurting the cable television industry, almost all of the losses to cable and direct-to-home satellite TV providers have redounded to Telus, Sasktel, MTS and Bell’s IPTV services. Revenue continues to grow at a slow pace. From the time when MTS and SaskTel began to roll out IPTV services in 2004, followed later by Telus and Bell in 2008 and 2009/2010, respectively, the HHI score dropped significantly to 1765 in 2013, well into the “moderately concentrated” zone of the scale. The trend reversed direction last year, rising to 1869, but still remained in the moderately concentrated zone nonetheless (see the “CableSatIPTV” sheet in the Google Docs Workbook).
The cable, satellite and IPTV industry, however, is still largely a duopoly at the local level. The “big four” control four-fifths of the market between them: Bell (26.3%), Shaw (23.5%), Rogers (19.2%), and Quebecor (11.9%). Add the next five largest players – Telus (7.3%), Cogeco (6.6%), Eastlink (3.6%), SaskTel (.9) and MTS (.9%) – and pretty much all of the market is accounted for.[4] Again, it is local and regional cable and telephone companies that dominate the sector, replicating the pattern of limited competition in yet another area of the platform media industries.
Thus, while there is no doubt that competition has grown stronger in the television delivery business, concentration levels in the ISP market have not changed and those in the mobile wireless market are still remarkably high. Moreover, concentration levels have risen sharply across the telecoms and broadcasting landscape, as indicated earlier, over the past half decade. Whereas the “big five” – Bell, Rogers, Telus, Shaw and Quebecor — accounted for two-thirds of all telecoms and broadcasting revenue in 2010 that figure has soared to 83% in 2014. In sum, competition is growing in television distribution, but it is taking place within the context of greater concentration across the platform media overall.
The Content Media Industries
Television
From the late 1980s until 1996, concentration in broadcast television fell sharply. The rise of specialty and pay TV channels magnified the trend. The television landscape became more diverse as a result.
These trends reversed abruptly in the late-1990s, however, albeit with something of a lag before the specialty and pay TV market began to follow suit. After the turn-of-the-century concentration levels climbed steadily. The upswing since 2008 has been especially sharp. Figure 7, below, shows the trend for each of the content media industries in terms of CR scores; Figure 8 does the same in terms of the HHI.
Figure 7 CR Scores for the Content Media Industries, 1984-2014
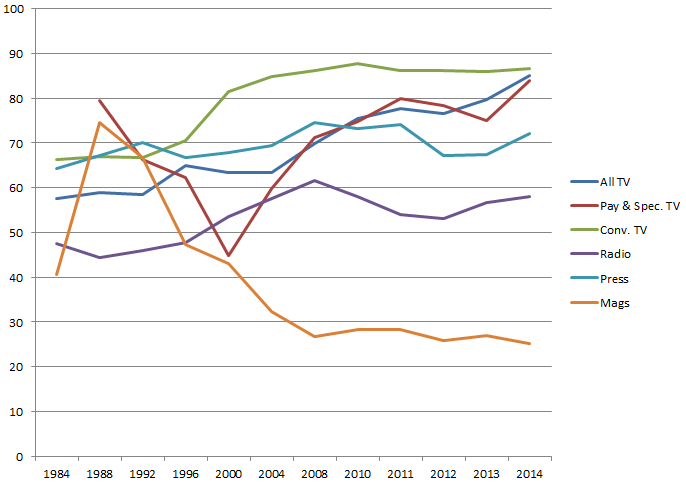
Sources: see the “CR & HHI” as well as individual sector sheets in the Google Docs Workbook.
Figure 8: HHI Scores for the Content Media Industries, 1984-2014
Sources: see the “CR & HHI” as well as individual sector sheets in the Google Docs Workbook.
During the first half-decade of the 21st century, the “big four” accounted for 63% of the TV content business at a time when a handful of mid-range players such as Alliance Atlantis and CHUM had carved out a significant place for themselves in the TV marketplace (circa 2000-2006), respectively, before being absorbed into the maw of the industry’s largest players. By 2008, the “big four” accounted for 70% of revenue. In 2014, the four largest television groups – Bell, Shaw, CBC and Rogers — controlled 85% of all television revenues. Add Quebecor into the mix, and the number rises to over 90% (see the “CR & HHI” sheet and specific sector sheets in the Google Docs Workbook as well as Television Channels by Ownership Groups).
The recent upsurge in concentration levels in the television market is due mainly to four transactions.
The first is Shaw’s take-over of Canwest’s television holdings in 2010. The second was Bell’s buy-back of CTV a year later. Given CTV’s status as the largest television company in the country, the deal pushed concentration levels up greatly. The third significant moment occurred when Bell and Rogers’ each took a 37.5% stake in Maple Leaf Sports Entertainment (i.e. NBA TV, Leaf TV and Gol TV) in 2012 (with Toronto Construction magnate Lawrence Tanenbaum’s Kilmer Sports holding the rest) (CRTC, 2012; Bell 2013 Annual Report, p. 133).
The fourth step took place with Bell’s take over of Astral Media in 2013 after the CRTC reversed course from a year earlier when it curtly dismissed the deal. The increase in concentration was significant, even though Bell divested itself of eleven TV channels, as required by the Competition Bureau and the CRTC: Teletoon (TELETOON Retro/TÉLÉTOON Rétro, TELETOON / TÉLÉTOON, Cartoon Network), Historia and Séries+ to Corus (Shaw), the Family Channel, Disney Jr. and Disney XD to children’s television programmer, DHX media, and MusiquePlus and MusiMax to V Media.
The CTV, MLSE and Astral transactions marked Bell’s return to the field after having abandoned its earlier ill-fated convergence fling in the ownership of CTV and The Globe and Mail (circa 2000-2006)(a phase in its history that is curiously missing from the company’s annual reports). These transactions put Bell at the top of the league.
Concentration levels are high in all three sub-components of the ‘total television’ measure (broadcast television as well as pay and specialty channels). In broadcast television, for example, the “big five” – CBC (41%), Bell (24.1%), Shaw (Corus) (14%), Rogers (7.5%) and Quebecor (TVA) (7.5%) – had a combined market share of 94.1%. The HHI is at the very high end of the scale: 3059.
Specialty and pay services have been the jewel in the TV crown, but over the last year both the CR4 and HHI standards shot upwards from the “moderately concentrated” zone into the “highly concentrated” zone. Bell (41.2%), Shaw (26.5%), Rogers (12.2%), the CBC (4.1%) and Quebecor (3.9%) collectively accounted for 88% of specialty and pay TV revenues in 2014 — up substantially from the 78% share they held a year earlier. Bell and Shaw alone account for two-thirds of the market.
Bell’s share of total TV industry revenues rose from 25% in 2011 to over a third last year. This makes Bell substantially larger than the second largest player in the television industry, Shaw (Corus), which had roughly 21% of market revenues in 2014. Together, however, Bell and Shaw (Corus) now dominate over half of the total television market in Canada (55%).
Add the next three largest companies and the top five possessed 219 of the 675 TV services licensed to operate in Canada: Bell (74 conventional, specialty and pay TV channels), Shaw (62), CBC (32), Rogers (26) and Quebecor (19). They also accounted for over 90% of total television revenues. For a depiction of who owns what, see the CMCR Project’s graphic, Canada’s Top Media, Internet and Telecoms Companies by Market Share
That concentration across the total TV market has been pushed to new extremes is also born out by changes in the HHI scores. The ground shifted significantly from the competitive end of the spectrum in the 2000-2008 period with HHI scores in the 1,300-1,500 range, but then shot upwards and into the moderately concentrated zone thereafter. The HHI score was 2128 in 2014, up substantially from 1,808 a year earlier.
Of course, there are several other players that round out the television landscape, some of which have been around for years, others that have come along lately: e.g. V Interactions, APN, Pemorex (the Weather Network), Radio Nord, Fairchild (Chinavision), Blue Ant, DHX, CHCH, CHEK, Channel Zero, etc. While no doubt important important sources of diversity, their impact has been modest and their future is uncertain. Collectively they account for less than five percent of total television revenues. To put this another way, the market share ofall these entities combined is substantially lower than Astral Media — the last large independent broadcaster — on the eve of its take-over by BCE in 2013.
Radio
Radio is amongst the most diverse media sectors. The shuffling of several radio stations between Shaw (Corus) and Cogeco in 2011 helped bring about the long-term decline in concentration. The presence of several mid-size radio station groups has also added to the relatively high diversity of radio station ownership: e.g. NewCap, Patttison, Rawlco, Maritime Broadcast, Golden West, etc.
The downward drift, however, of recent years, however, was reversed in 2013 when Bell acquired Astral Media, then Canada’s largest radio broadcaster. The deal catapulted Bell into the being the biggest radio broadcaster in the country, ultimately adding 77 radio stations to the existing ones it already had, for a total of 107 radio stations operating in 55 cities across Canada. Bell’s 21.8% market share in 2014 was substantially larger than the CBC’s share (15.2%) and far greater than that of closest commercial peer, Rogers (12%).
Bell’s acquisition of Astral lead to a significant increase in CR4 and HHI scores, and reversed the downward trend of the previous half decade. Even with this significant uptick, however, the radio sector is only modestly concentrated by CR4 standards in 2014, with a score of 58%. It is firmly within the competitive zone by the lights of the HHI, with a score of 1023.
Bell’s divestiture of ten radio stations in medium to large size cities across the country at the end of 2013 and into 2014 helped offset the effects of consolidation. The effect of this sell-off has also be to strengthen some of the mid-size radio station ownership groups that acquired them: Newcap (5), Pattison (3) and Corus (Shaw)(2) (see the “Radio” sheet in the Google Docs Workbook).
Newspapers
With some twists and turns along the way, concentration in the newspaper industry rose steadily from 1984 until 2008, when it peaked. In 1984, the biggest four groups accounted for 64% of the industry’s revenues, a number that rose slowly but steadily over the intervening years to roughly two-thirds of the market in 1996 and then more sharply upwards until 2008.
By 2008, the four largest newspaper ownership groups accounted for three-quarters of the market: Canwest (23.9%), Quebecor (21.7%), Torstar (18.1%) and Power Corp / Gesca Media (10.8%) (see the “Newspaper” sheet in the Google Docs Workbook). Levels declined considerably thereafter until the CR4 fell to 67% in 2013 and the HHI from 1596 to 1,358 – well within the ‘competitive’ range of the HHI standards. The new conditions likely reflected Postmedia’s decision to sell some of its newspapers (e.g. Victoria Times Colonist) and to cut publishing schedules at others.
Indeed, Postmedia’s market share has fallen steeply from 24% in 2008 when the papers were still in the hands of Canwest to 17% last year, and within a rapidly shrinking market. A few new publishers have emerged by picking up some of the smaller dailies hived off from the larger chains and generally amidst the tough times facing the newspaper industry, notably Black Publishing and Glacier Publishing in western Canada.
Yet, as in other areas reviewed so far, the short-term decline in concentration levels within the newspaper industry reversed course last year. The CR4 rose significantly from 67% to 72% and the HHI did so by more than 200 points to 1571 and into the “moderately concentrated” zone in 2014 – not accounting for this year’s completed sale of Quebecor’s Sun newspaper chain (6 major dailies, 27 small dailies and 140 community weeklies) to Postmedia. Since the Competition Bureau only gave the green light to the deal in 2015, the results of that deal will be taken up in next year’s version of this report.
Magazines
Of all media sectors, magazines are the least concentrated. Concentration levels fell by nearly half on the basis of CR scores between 1984 and 2014, and more than half by the lights of the HHI criteria (see the “Magazine” sheet in the Google Docs Workbook). The CR4 was 25, and the HHI at the extremely low level of 218. That said, however, even the best available data for this sector is terrible and needs to be treated with caution.
Core Elements of the Internet
The internet has long been held up as an antidote to ownership concentration in the “old media”. Yet, as the earlier discussion of internet access showed, there is little reason to believe that core elements of the Internet are immune to such forces, and maybe even some good reasons to think that the opposite just might be the case.
The discussion below examines the evidence in relation to several core elements of the internet ecology: internet advertising, search engines, social media sites, browsers, operating systems and online news sites? It starts with a critical area that is remarkably unconcentrated and which appears to have become more and more diverse over time: internet news sources.
Internet News
As previous versions of this report have indicated, internet news sites have always been an exception to the high levels of concentration found elsewhere in both the online and ‘old’ media environments.
The diversity of online news services did fall between 2003 and 2008 when the amount of time people spent on the top 10 online news sites nearly doubled from 20 to 38 percent of people’s time spent online. Moreover, it was also the case at the time, and still is, as we will see immediately below, that most of the increase in time that people spent on a dwindling number of sites went to sources that were extensions of well-known media outlets: CBC / Radio Canada, Quebecor, CTV, the Globe & Mail, Toronto Star, Post Media and Power Corp, as well CNN, BBC, Reuters, MSN, Google and Yahoo! (Zamaria & Fletcher, 2008, p. 176). However, even though there was a “pooling of attention” on the top 10 or so news sites, it was also the case that concentration levels were always at the lower end of the scale and drifted downward until 2011, the last point for which I had data (see the “Online News” sheet in the Google Docs Workbook).
This year I have obtained a new dataset that brings us up-to-date. While the new dataset and the old one use very different measures and are, thus, not directly comparable, the downward drift in concentration levels seen in the past has continued. Internet news sources are, in fact, amongst the most diverse of all the sectors reviewed in this report, except magazines. Table 2 below illustrates the point.
Table 2: Internet News Sources, 2013-2014
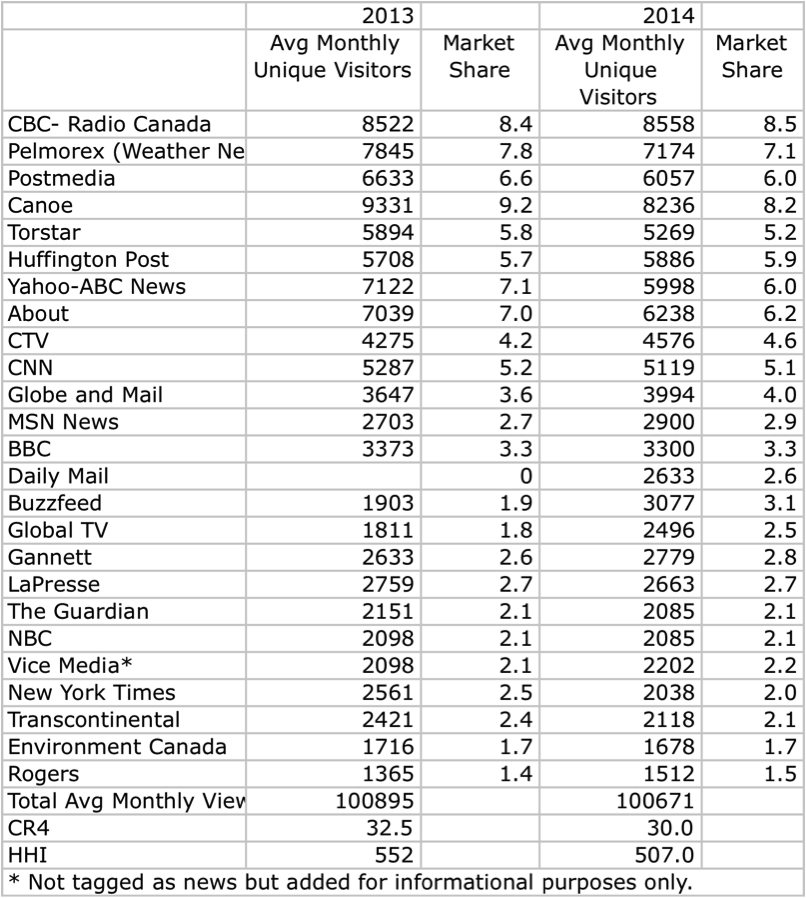
Source: ComScore Long Term Trend, September 2012 — September 2015, Total Canada, News and Information Category.
Canadians get their news from a wide range of sources on the internet. The CBC is at the top of the heap, while other familiar media enterprises also continue to loom large. It is also clear the new online sources of journalism have climbed up the ranks (Huffington Post, Buzzfeed). There’s also a significant number of quality US and UK news sources near the top of the list (e.g. New York Times, the BBC, the Guardian). The importance of the Weather Channel also stands out.
Internet Advertising
Internet advertising revenues have soared from a relatively small $141 million in 2000 to $3,793 million last year. The internet surpassed television as the largest advertising sector in 2013, and maintained that distinction last year. By 2014, it advertising accounted for over a third of advertising revenue across all media (IAB, 2014, p. 13).
The data, however, are not without their problems, and buried in the footnotes to the reports tallying up the numbers are cautionary words about the double-counting that takes place between the ‘online advertising revenue’ reported by traditional media companies’ revenues, notably newspapers, under their conventional areas of operation and under the umbrella of internet advertising in the surveys conducted by TVB and the Internet Advertising Bureau (see TVB Net Advertising Volume report, footnote 2 on this point, for example).
That said, however, taking heed of these observations and building on the just-mentioned sources, company annual reports, as well as estimates of Google and Facebook’s revenue in Canada leads to a reasonable picture of current trends and recent developments in this area. In sharp contrast to internet news sources it reveals a picture of high levels of concentration. Indeed, internet advertising is highly concentrated by the standards of the CR4 and the HHI. Table 3 below illustrates the point by highlighting the revenues and market share of eight of the largest internet advertising revenue recipients in 2014.
Table 3: Internet Advertising: Revenue (millions), Market Shares and Concentration Scores, 2014
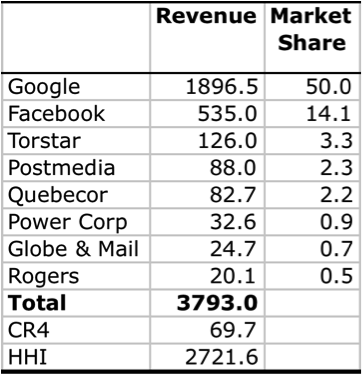
Sources: IAB, 2014 Actual + 2015 Estimated Canadian Internet Advertising Revenue Survey, p. 4, company Annual Reports, and the entries under “Internet Other” sheet n the Google Docs Workbook.
These findings are in line with the Internet Advertising Bureau (2015) findings that the top ten firms accounted for more than four-fifths of internet advertising revenue in Canada in 2014, and the top twenty for 90%. Furthermore, these levels have stayed relatively stable over the past five years, but with a slight upward trend over time (p. 3).
Table 3 also highlights the fact, when it comes to internet advertising, Google and Facebook stand in a league of their own. Indeed, the two combined account for an estimated two-thirds of internet advertising revenue in Canada. Facebook’s revenues alone are more than twice those of the entire newspaper industry’s online and mobile advertising revenue, i.e. $535 million versus $238 million (Newspaper Canada, 2015).
Search
Google’s dominance of internet advertising flows from its dominance of the search engine market. Concentration levels in the search engine market have been persistently sky-high since 2004. CR scores have been well over 90, and HHI scores have been nearly off-the-charts in the 4000-7000 range (remembering that 10,000 represents the upper limit of the HHI scale, or total monopoly). This is another core element of the internet that is far from being immune to processes of consolidation. Indeed, internet search is amongst the most concentrated of all of the different segments of the network media ecology, by far.
Google’s dominance rose sharply from the mid-2000s until the end of the decade, where it hovered in the low 80%-range. It’s share of the market dipped in 2012 but that was short-lived. As of 2014, the search engine giant dominated search in Canada with over three-quarters of the market share in 2014, with Microsoft (10.4%), Yahoo! (5.7%) and Ask.com (2.1%) trailing far behind. CR4 and HHI scores were sky-high at 94% and 5891, respectively.
Table 4 depicts the results.
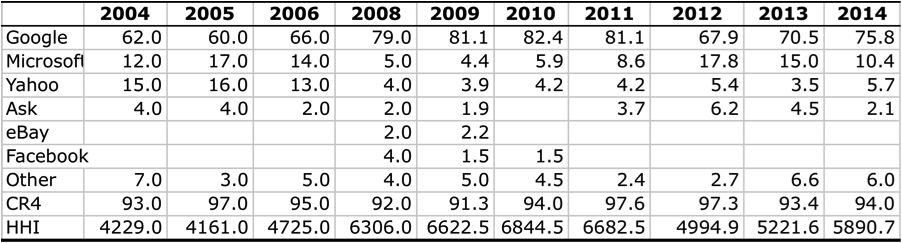
Sources: Experien Hitwise Canada. “Main Data Centre: Top 20 Sites & Engines” and “Hitwise Canada Online trends“. Last accessed October, 2015.
Social network sites display a similar but not as pronounced trend. Facebook accounted for 46% of unique visitors to such sites in March 2013 (the most recent data publicly available), followed by Twitter (15%), LinkedIn (12%), Tumbler (12%), Instagram (9%) and Pinterest (6%) (Comscore). With a CR4 score of 85% and an HHI of 2762, social networking sites are highly concentrated.
With respect to other core elements of the internet ecology, current levels of concentration can be best described as sky-high. Take desktop web browsers in Canada, for example. The top four companies — Microsoft’s Explorer (59.1%), Google Chrome (22.7%), Firefox (11.9%) and Apple’s Safari (5%) — have a combined market share of 98.7 percent and an HHI of 4176 (Netmarketshare).
Similar characteristics hold for mobile browsers, albeit with a different rank ordering of the players. Just two companies have a market share over 90% — i.e. Apple’s Safari is 48.4% and Google Android or Chrome browser is 42.6%. Opera 6.7% and Microsoft Explorer with 2.2% lag far behind. The upshot is extremely high levels of concentration on the basis of both the CR4 (99%) and HHI (4207) scores (Netmarketshare). These patterns have also persisted over time.
Similar patterns prevail once again in terms of desktop and smartphone operating systems. When it comes to desktop operating systems, three entities account for 100% of the installed base (Microsoft Windows, 91.3%; Apple OS X, 7.2% and Linux at 1.6%). The HHI is at the extreme end of the scale at 8390, given Microsoft’s control of in excess of 90% of the installed operating systems. This situation has stayed remarkably constant over the years and even trended upwards in recent years.
For smartphone operating systems, the top four players accounted for 96% of the market: Apple’s iOS (47.7%), Google’s Android OS (41.9%), Java (3.8%), Nokia’s Symbian (3%). Microsoft (1.7%), RIM (1.2%) and Kindle accounted for the rest. The HHI score was 4,059 (Netmarketshare).
The Network Media Industries as a Whole
The following paragraphs draw this report to a close by combining all the bits and pieces into a bird’s eye view of long-term trends across the network media economy as a whole. Figures 9 and 10, below, start the process by showing the trends across the network media economy over time on the basis of CR1, CR4 and CR10 scores, followed shortly afterwards by a depiction of the trends based on the HHI.
Figure 9: CR, 1, 4 and 10 Scores for the Network Media Economy, 1984-2014
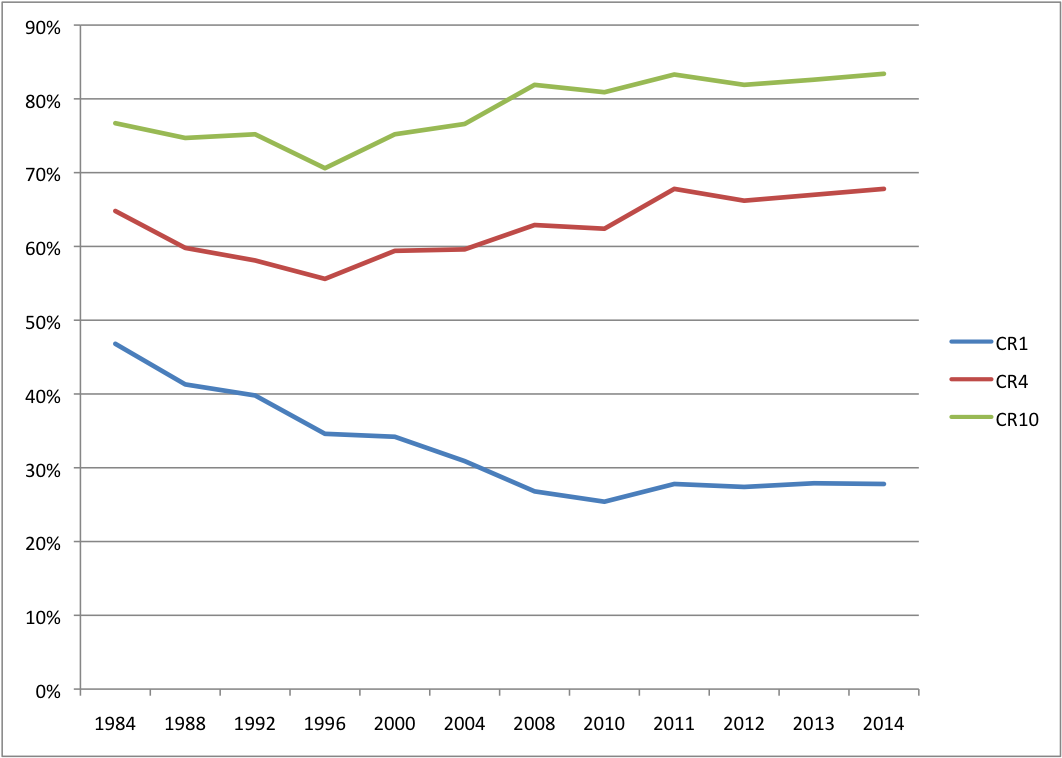
Sources: see the “CR & HHI” sheet in the Google Docs Workbook.
Looking across the entirety of the network media economy, several distinct points emerge: The biggest company’s share of revenues across the media three decades ago was 47%; in 2014, it was much less, but still a very large 28%, and within a vastly larger media universe. That company in 1984 was BCE; it still is today, and it is far larger than the second and third-ranked firms, Rogers and Shaw.
The CR4 for the whole of the network media economy in 2014 (67.8%) was roughly the same as it was three decades ago: in the mid-60% range, although up considerably from its low point in the 1990s. At present, Bell (27.8%), Rogers (16.3%), Telus (15.9%) and Shaw (7.7%) make up the ‘big four’. The most significant and far-reaching change in recent times is the ascent of four enormous vertically-integrated telecom, media and internet conglomerates that now account for 57.2% of total revenues across the network media economy: Bell, Rogers, Shaw and Quebecor. Add Telus to the fold and the market share of the top five Canadian telecom, media and internet companies swells to 73.1%.
The largest ten firms accounted for 83.4% of all revenues across the network media economy as a whole in 2014 — an all time high. This, too, is up significantly from the 1990s when the figure hovered in the mid-70% range, and modestly higher than levels in place in the early 1980s. Once again, the idea of a “u-shaped” curve fits the trends.
All-in-all, after taking account of the top four or five firms, there is a distant second tier of a dozen or so more specialized media, internet and telecoms companies that, combined with the tier one firms, account for just under 90% of all revenues in the network media economy: Google, the CBC, MTS, Cogeco, Sasktel, Torstar, Postmedia, Eastlink, Facebook, Power Corporation, and Netflix and the Globe and Mail.
Figure 10 below shows their respective rank order based on their Canadian revenues.
Figure 10: Leading Telecom, Media and Internet Companies in Canada, 2014
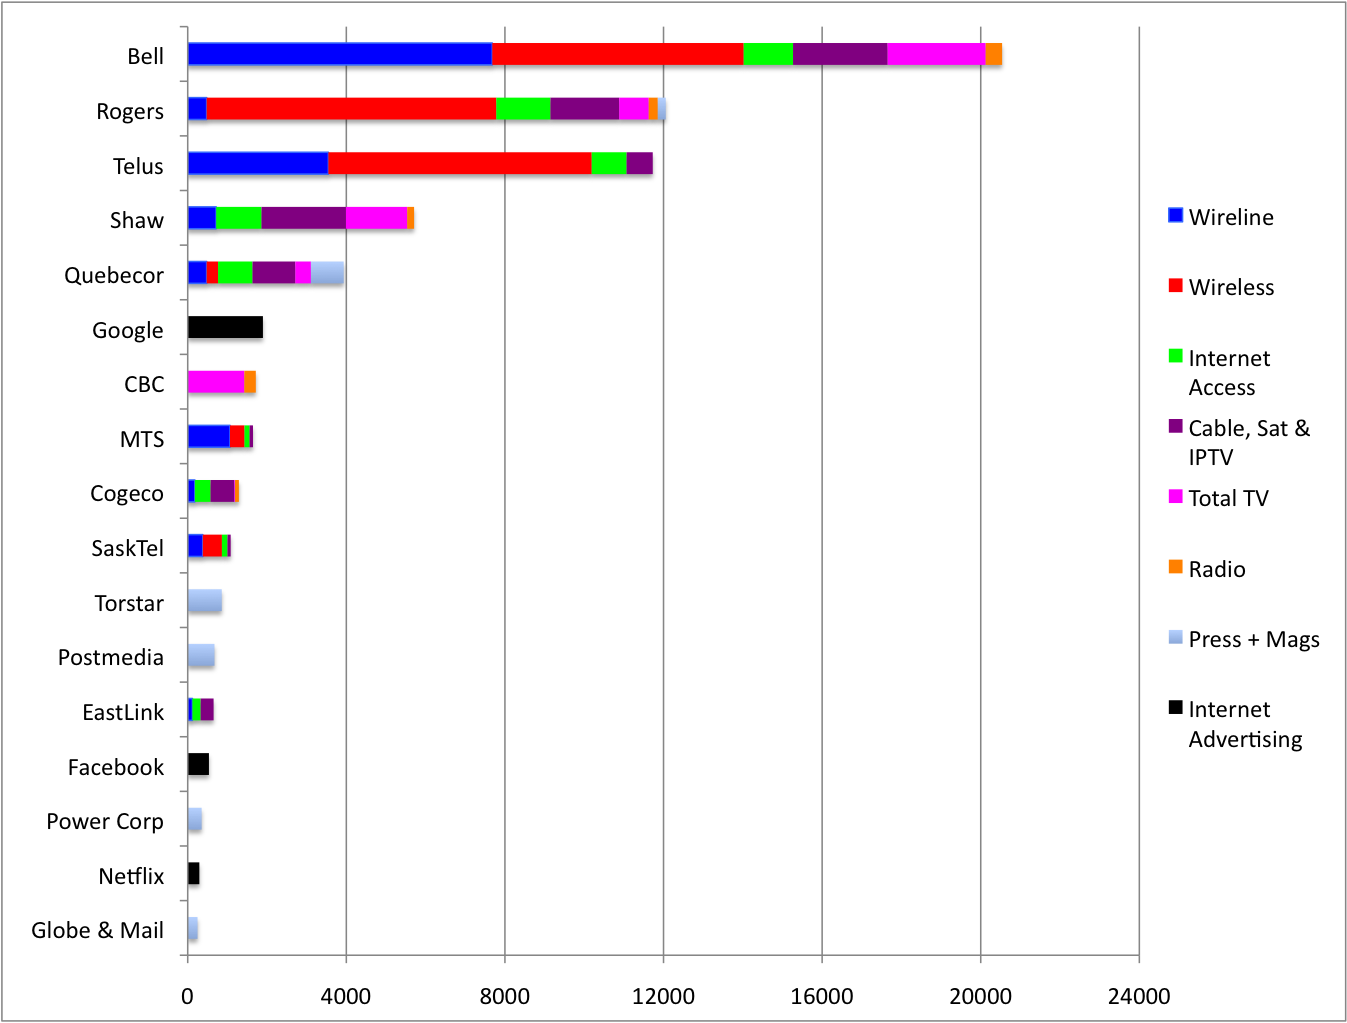
Sources: see the “Top 20 w Telecoms” sheet in the Google Docs Workbook.
A notable change in the past few years is the fast rise of internet companies up the ranks of the leading media, internet and telecoms companies in Canada. Google’s fast ascent through the ranks to 6th place by 2013 and remaining there this year stands out in particular. It is now second only to the tier one players – Bell, Rogers, Telus, Shaw and QMI – but with a greater share of the media economy then traditional mainstays on the media landscape in Canada such as the CBC, Globe and Mail, Torstar and so on.
Facebook and Netflix also cut significant figures but are still modest in their standing within the overall media economy, although not in their respective areas of specialization. Netflix’s estimated revenues of $293 million represented about 4% of total TV revenues in 2014, a substantial amount that place it just behind Quebecor’s TVA in the television sector, and ahead of all the main independent television groups combined, i.e. V Interactions, APN, Pelmorex/the Weather Channel, Radio Nord, Blue Ant and Fairchild.
For its part, Facebook’s estimated Canadian revenues of $535 million accounts for 14.1% of internet advertising revenues in Canada. While modest within the overall media economy, a better sense of the scale of Facebook’s impact is gained by looking at those areas where it is mostly likely having a significant impact on existing media players, for instance, newspapers who see themselves as battling with digital media giants for advertising revenue. As indicated earlier Facebook’s estimated advertising revenue was more than double the entire newspaper industry’s online and mobile advertising revenue in 2014 (Newspaper Canada, 2015).
Figure 11 below offers another portrait of concentration trends for the network media industry as a whole, but this time using HHI rather than CR scores.
Figure 11: HHI Scores for the Network Media Economy, 1984-2014
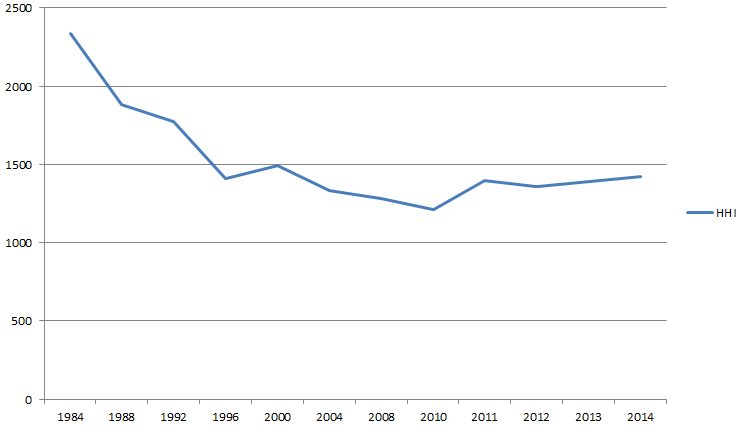
Sources: see the “CR & HHI” sheet in the Google Docs Workbook.
As with the CR scores shown earlier, Figure 11 also shows a ‘u-shape’ pattern. If we take HHI scores for the ‘total media universe’ as the beginning and endpoint of our analysis, this is our conclusion: concentration levels have fallen substantially over time across the overall media economy. They are much lower than they were at the turn-of-the-21st century and a far from cry from what they were in 1984. This is exactly what observers who argue that any continued concern with media and internet concentration is both wrong and wrong-headed, such as Ben Compaine, Ken Goldstein and Brent Skorup and Adam Theirer, tend to do.
That conclusion is problematic for several reasons. First, the long–term decline that it implies has been thrown into reverse since 2010. While the overall decline since 1984 brought the overall HHI firmly into the competitive zone of that measures standards, the sharp reversal in the past five years is now close to crossing over into the moderately concentrated zone. This represents a very significant change over a very short period of time.
Second, by taking the “bird’s eye” view as the beginning and end of the story the conclusion of those who argue that things are just fine obscures trends at the sector-by-sector and category level analysis – platform media, content media and online media. We use the “scaffolding method” precisely to pick up on such dynamics, whereas starting at the opposite, high-end view, and sticking within it the whole way through, dulls the sensitivity of the HHI method in relation to sector- and category-specific changes. Moreover, given the reversal of long-term trends within many sectors and across the media economy as a whole drawing conclusions about the ‘fiercely competitive’ state of the telecoms, media and internet industries at this time would be to prematurely foreclose the end of the story.
In contrast, the ‘scaffolding approach’ reveals a more variegated portrait that is sensitive to changes in specific sectors, categories and the network media as a whole. Figure 12 below gives a snapshot of the network media in 2013, listing sectors where concentration was low, those that were moderately concentrated, and those that were highly concentrated by HHI standards.
Figure 12: Concentration Rankings on the basis of HHI Scores, 2014
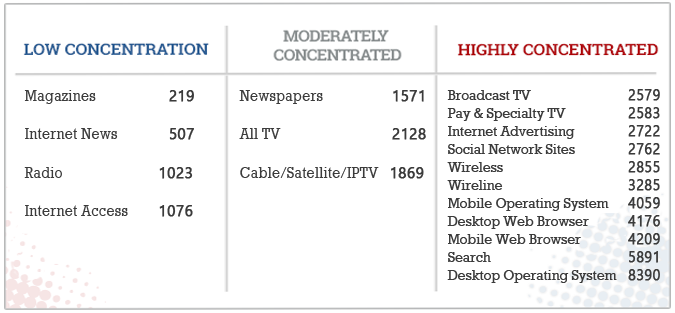
Concluding Thoughts
Several things stand out from this exercise. First, we are far from a time when studies of media, telecoms and internet concentration are passé. Indeed, theoretically- and historically informed and empirically-driven research is badly needed because there is a dearth of quality data and disinterested research available.
The concerns addressed in this report do not belong to a distant past rendered obsolete by new technological and economic realities but are intimately intertwined with the events of the day. The trends observed above are similar to those seen in the US and many other countries around the world.
Concentration levels fell sharply in the 1980s and part way through the 1990s, but were followed by a great reversal and steep rise in the second half of the 1990s. Of course, details differ from one medium to the next, and from country to country, but the general trend in Canada, like the US, was similar, with the steep upward rise of the late 1990s peaking by 2000, followed by relatively constant levels at this high point for the decade that followed.
The last five years have once again seen a slight uptick in most of the ‘platform media industries’ and a very sharp rise within each of the segments of television covered by this report. The overall effect has been a substantial rise in concentration levels. The platform media industries and most of the core elements of the internet, including internet advertising, search, browsers, operating systems and social network sites, are the most concentrated. Concentration levels in these sectors are “astonishingly high”, as Eli Noam has stated (p. 8). This is certainly true of Canada. These realities undergird the towering role that digital media giants like Google, Facebook and Netflix now play in Canada.
Of course, these trends are not all to one side and the case is more varied in the content media industries. As we have seen, internet news sources frequented by Canadians are defined by “astonishingly high” levels of diversity, and not just from within the country, but reaching beyond national borders to pick up highly-respected journalistic organizations from the U.S. and U.K. in sizeable numbers.
Magazines and radio also fall at the high end of the diversity spectrum as well. Some new players such as Wind (mobile wireless), TekSavvy (internet access), Blue Ant (TV) and iPolitics (online news) have added diversity to the media landscape as well, but their impact has been modest and, for some, their future uncertain.
While there are important cross-cutting trends and areas where diversity rules, the evidence is clear: there are high levels of concentration within most sectors of the telecoms, media and internet industries, and across the network media economy as a whole.
Moreover, media, telecoms and internet concentration are not mere allegations but established legal facts. The CRTC appears to have rediscovered media concentration in the past year, and taken bold steps by the standards of the past to do something about it in a series of landmark rulings: e.g. the Mobile TV, Talk TV as well as regulated wholesale mobile wireless and wireline decisions.
On each occasion, the Commission’s message was clear: “Incumbent carriers continu[e] to dominate the retail Internet access services market” (para 125). There has been little change in such realities over time. New technologies, whether 4G LTE mobile wireless services or the next generation fibre broadband internet access networks that are now being brought to more and more Canadians’ doorsteps do not obviate such concerns one iota but demand a firm hand at the tiller to ensure that the same kinds of problems that exist today do not become those of tomorrow.
Yet, as this report has shown, it is not just high levels of concentration that is at issue but the specific form it has taken in Canada, i.e. vertical integration. Vertical Integration in Canada is extremely high by historical standards, and has soared over the past five years. It is also high in comparison to US and international standards as well.
While regulators have countenanced these developments in the past, they have recently begun to reject the North American “free market model” orthodoxy that brought about these conditions to begin with. The sensibility now appears to be as much market as possible, but regulation when necessary.
The incumbents have fought the current drift of events tooth-and-nail. Bell, for instance, has done so by flooding the courts with appeals of several CRT decisions in the last year (see here, here and here) and landing a petition to Cabinet on the desks of the incoming Liberal Government before it was even in office.
The lobbying front also appears to be in full swing in support of the companies’ stance on these matters and against any more attempts “to achieve greater competition”, with the C.D. Howe Institute calling on the new government to specifically change course in line with the incumbents’ view of the world. The Globe and Mail has published the Institute’s call in its op-ed pages. The Institute itself has hastily pulled together a “conference” at month’s end to expound on such views further.
This push to restore the incumbents’ preferred view of the world is nothing new for the Institute, having promoted similar views for years (see here and here). What is of the moment, however, is the speed with which this bastion of the well-connected has laid these views at the feet of the new government and the fact that the chairman of the C.D. Howe Institute until he announced his run for federal public office in February was Bill Morneau, the new Liberal Government’s Minister of Finance.
The connections between governments and industry, and especially the telecoms and media industries, have been a perennial feature of the political economy of media in Canada in the past and have not served us well. The new government will be wise to avoid being captured by such forces during its time in office and the conflicts of interest, perceived and real, that these relationships foster.
In short, high levels of media, telecoms and internet concentration are reality. What is to be done, if anything, about this state of affairs is a political question. On that, we will have to wait while also taking steps to help bring about what we want. The new government will also have to resist temptation and would be wise to double-down on the course initially charted by the Conservatives, but in ways the reflect even more ambition and a broader role of the internet, media and telecoms in Canadian society, business, politics, culture and everyday life.
To close, it’s important to keep in mind that we are living in what historians call a “constitutive moments” when decisions taken now will influence the course of events and the shape of the media environment we inhabit for years, even decades, to come. Once such decisions are made, the structures of the new medium of human communication that we are still struggling to come to grips with now – the internet- and mobile-centric media ecology — will become part of the woodwork, and stay that way for a long time to come.
[1] Two of these studies, Church and Wilkins (2013) and Navigant (2013), were funded, at least in part, by incumbent wireless carriers, by Rogers in the first case and Telus in the latter. See footnote 7, Winseck, D. (2014). Mobile Wireless in Canada. Wolter Lemstra and William Melody’s (eds)(2014). The Dynamics of Broadband Markets in Europe and Christopher Yoo’s (2014) U.S. vs. European Broadband Deployment: What do the data say? are two new promising additions to the literature that take a similar tack but which, I have heard, take a more scholarly versus “hired gun” approach.
[2] The figures for the Atlantic provinces are based on last the CRTC’s CMR 2014, Table 5.5.6 because this year’s equivalent to that table has not been released due to concerns with the confidentiality of information raised by the new entrant in the region, Eastlink. See here, p. 216). The numbers that the CRTC can disclose upon request but which are not included in this year’s CMR can be seen here.
[3] The number of subscribers just reported is the average between the number of subscribers at the end of the previous year and at the end of the current year.
[4] The sum exceeds 100% by a small amount because the revenue figures that I have arrived at for the telcos’ IPTV services are based on the companies’ audited annual reports at year end and higher than those they report to the CRTC, and for reasons explained in the last post.