Media and Internet Concentration in Canada, 1984-2012
This is the second post in a series (for a downloadable pdf version of this report please click here). Building on last week’s post that analyzed the growth of the media economy between 1984 and 2012, this post addresses a deceptively simple yet profound question: have telecom, media and internet (TMI) markets become more or less concentrated over the same period of time?
In Media Ownership and Concentration in America, Eli Noam (2009; also see 2013) notes that creating a coherent portrait of media concentration is difficult. Strong views are plentiful, but good evidence is not. Canadian scholar Philip Savage makes much the same observation, noting that debates over media concentration in Canada “largely occur in a vacuum, lacking evidence to ground arguments or potential policy creation either way”.
This post addresses that gap by providing a long-term, systematic, data-driven analysis of concentration trends across a dozen or so sectors in Canada for the years between 1984 and 2012: wireline and wireless telecoms, internet access, BDUs (cable, satellite & IPTV), specialty and pay TV, broadcast TV, radio, newspapers, magazines, search engines, social media sites, online news sources, browsers and smart phone operating systems. These are the essential elements of the network media economy.
Concentration trends are assessed sector-by-sector and then across the network media as a whole using two common analytical tools — concentration ratios (CR) and the Herfindahl – Hirschman Index (HHI). While we cite our sources below, by and large, the following documents and data sets underpin the analysis in this post: Media Industry Data, Sources and Explanatory Notes and the CMCR Project’s Methodology Primary.
Media Concentration: Contentious Debates, Main Issues
Some consider discussions of media concentration in the age of the internet to be ridiculous. Leonard Asper, the former CEO of bankrupt Canwest, quipped, “the media have become more fragmented than ever. People who think otherwise probably believe that Elvis is still alive”. Chris Dornan points to how a Senate report that came out in 2006 was written by a bunch of Senators with their heads buried in the sand.
In Bell Astral 2.0, BCE said that while many critics allege that concentration in Canada is high, the evidence, “regardless of the metric employed – proves otherwise” (Bell Reply, para 46). When there are thousands of websites, social networking sites galore, pro-am journalists, a cacophony of blogs, 744 TV channels licensed for distribution in Canada, ninety-five daily newspapers and smartphones in every pocket, how could media concentration possibly be a problem?
If there was ever a golden media age, this is it, argue Thierer & Eskelen, 2008. Media economics professor, Ben Compaine (2005) offers a terse one-word retort to anyone who thinks otherwise: Internet.
Shackling media companies with ownership restrictions when they face global digital media giants like Google, Amazon, Netflix, Facebook, and so on is to condemn them to a slow death by strangulation (Skorup & Thierer, 2012; Dornan, 2012). Journalist’s too often share this view mostly, it seems, because they rely on industry insiders while considering balance and objectivity to be achieved when two industry insiders are shown to disagree with one another.
Critics, in contrast, tend to see media concentration as steadily going from bad to worse. Ben Bagdikian, for instance, claims that the number of media firms in the US that account for the majority of revenues plunged from 50 in 1984 to just five by the mid-2000s. Canadian critics decry the debasement of news and the political climate of the country (here and here). Others see internet as another frontier of capitalist colonization and monopolization (Foster & McChesney, 2012).
A third school of scholars aims to detect the influence of changes of media ownership and consolidation by quantitatively analyzing reams of media content. They generally find that the evidence is “mixed and inconclusive” (here). The newest of such studies, Cross-Media Ownership and Democratic Practice in Canada: Content-Sharing and the Impact of New Media, comes to similar conclusions (Soderlund, Brin, Miljan & Hildebrandt, 2011).
Such findings, however, proceeds as if ‘impact on content’ is the only concern, or as Todd Gitlin put in many years ago, as if ‘no effect’ might not be better interpreted as preserving the status quo and thus a significant problem in its own right.
A fourth school of thought, and one that I largely subscribe to, sees the shift from the industrial media of the 19th and 20th centuries to the online digital media of the 21st century as entailing enormous changes. However, it also argues that these changes also entail an equally enormous “battle over the institutional ecology of the digital environment” (Benkler, 2006, ch. 11). The history of human communication is one of recurring ‘monopolies of knowledge” (Innis, 1951) and oscillations between consolidation and competition (John, 2010; Babe, 1990), so why should we expect this to be any less true today (Noam, 2009; Benkler, 2006; Wu, 2010; Crawford, 2012)?
As Noam (2013) states after reflecting on the results of a thirty-country study, concentration around the world is “astonishingly high”. Whether Canada ranks high by international standards, low or in between will be dealt with in a subsequent post.
The core elements of the networked digital media – e.g. wireless (Rogers, BCE, Telus), search engines (Google), Internet access (ISPs), music and book retailing (Apple and Amazon), social media (Facebook) and access devices (Apple, Google, Nokia, Samsung) – may actually be more prone to concentration because digitization magnifies economies of scale and network effects in some areas, while reducing barriers in others, thereby allowing many small players to flourish. A two-tiered digital media system may be emerging as a result, with numerous small niche players revolving around a few enormous “integrator firms” at the centre (Noam, 2009; Wu, 2010).
All this matters because the more core elements of the networked media are concentrated, the easier it is for dominant players to exercise market power, coordinate behaviour, preserve their entrenched stakes in ‘legacy’ media sectors (e.g. television and film), stifle innovation, influence prices and work against market forces and the needs of consumers and citizens (see here, here, here, here and here). Large consolidated telecom, media and internet giants also make juicy targets for those who would turn them into proxies working on behalf of the copyright industries, efforts to block pornography, and as part of the machinery of law enforcement and national security (see here, here and here).
In sum, the more concentrated the digital media giants are, the greater their power to:
- set the terms for the distribution of income to musicians, journalists and media workers, and authors (Google, Apple, Amazon);
- turn market power into moral authority by regulating what content can be distributed via their ‘walled gardens’ (Apple);
- set the terms for owning, controlling, syndicating and selling advertising around user created content (Google, Facebook, Twitter) (van Couvering, 2011; Fuchs, 2011);
- use media outlets they own in one area to promote their interests in another (see Telus intervention in Bell Astral, 2.0 pages 4-6 and here);
- and set defacto corporate policy norms governing the collection, retention and disclosure of personal information to commercial and government third parties.
Whilst we must adjust our analysis to new realities, long-standing concerns remain as well. Consider, for example, the fact that every newspaper in Canada, except the Toronto Star, that editorially endorsed a candidate for Prime Minister in the 2011 federal election touted Harper –three times his standing in opinion polls at the time and the results of the prior election.
Ultimately, talk about media concentration is really a proxy for conversations about consumer choice, freedom of the press and democracy. Of course, such discussions must adapt to changes in the techno-economic environment of the media but the advent of digital media does not render them irrelevant (Baker, 2007; Noam, 2009; Peters, 1999).
Methodology
Measuring media concentration begins by defining the media studied, as noted at the outset. I then collected revenue data for each of these sectors and for each of the firms within them with over a one percent market share. This handy dandy list of sources and others listed here were used.
Each media is analyzed on its own and then grouped into three categories, before scaffolding upward to get a birds-eye view of the entire network media ecology: (1) platform media; (2) content media: (3) online media. The results are analyzed over time from 1984 to 2012. Lastly, two common tools — Concentration Ratios (CR) and the Herfindhahl – Hirschman Index (HHI) – are used to depict levels of concentration and trends over time within each sector and across the network media ecology as a whole.
The CR method adds the shares of each firm in a market and makes judgments based on widely accepted standards, with four firms (CR4) having more than 50 percent market share and 8 firms (CR8) more than 75 percent considered to be indicators of media concentration (see Albarran, p. 48). The Competition Bureau uses a more relaxed standard, with a CR4 of 65% or more possibly leading to a deal being reviewed to see if it “would likely . . . lessen competition substantially” (p. 19, fn 31).
The HHI method squares and sums the market share of each firm in a market to arrive at a total. If there are 100 firms, each with a 1% market share, then markets are highly competitive, while a monopoly prevails when a single firm has 100% market share. The US Department of Justice set out new guidelines in 2010 for determining when concentration is likely to exist, with the new thresholds set as follow:
HHI < 1500 Unconcentrated
HHI > 1500 but < 2,500 Moderately Concentrated
HHI > 2,500 Highly Concentrated
At first blush, these higher thresholds seem to water down the earlier standards that had been set at lower levels and used since 1992. The new guidelines, however, are probably even more sensitive to reality and tougher than the ones they supersede.
This is because they go beyond setting thresholds to give more emphasis to the degree of change in market power. For instance, “mergers resulting in highly concentrated markets that involve an increase in the HHI of more than 200 points will be presumed to be likely to enhance market power”, observes the DOJ (emphasis added, p. 19).
Second, markets are defined precisely based on geography and the relevant details of the good at hand versus loose amalgamations of things that are based only on superficially similarities. This is critical, and it distinguishes those who would define the media universe so broadly as to put photocopiers and chip makers alongside ISPs, newspapers, film and TV and call the whole thing “the media” versus the ‘scaffolding approach’ we use that starts by analyzing each sector before moving up to higher levels of generality from there until reaching a birds-eye perspective on the network media as a whole.
Third, the new guidelines also turn a circumspect eye on claims that enhanced market power will be good for consumers and citizens because they will benefit from the increased efficiencies that result. What is good for companies is not necessarily good for the country (see Stucke & Grunes, 2012).
Lastly, the new guidelines are emphatic that decisions turn on “what will likely happen . . . and that certainty about anticompetitive effect is seldom possible and not required for a merger to be illegal” (p. 1). In practice this means that the goal is to nip potential problems in the bud before they occur; to “interdict competitive problems in their incipiency”, as the guidelines say (p. 1). Crucially, this means that experience, the best available evidence, contemporary and historical analogies as well as reasonable economic theories are the basis of judgment, not deference to impossible (and implacable) demands for infallible proof (p. 1).
These assumptions overturn a quarter-century of economic orthodoxy and its grip on thinking about market concentration (see Stucke & Grunes, 2012 and Posner). Freed from the straight-jacket of Chicago School economic orthodoxy, and the subordination of policies and politics to economists and judges, the new guidelines set a tough hurdle for those with the urge to merge. It was precisely this kind of thinking that killed the bid by AT&T – the second largest mobile wireless company in the US – to acquire the fourth largest, T-Mobile, in 2011, for instance (also Stucke & Grunes, 2012).
In Canada, in contrast, the CRTC Diversity of Voices sets up thresholds for a broadly defined TV market in which a proposed deal that results in a single owner having less than 35% of the total TV market will be given the green light; those that fall in the 35-45% range might be reviewed; anything over 45% will be rejected (para 87). Unlike the Competition Bureau that uses the CR4 method whereby a deal that result in a CR4 over 65% may be reviewed to determine whether it will substantially lessen competition, the CRTC has no such guidelines, although a recent accord between the two regulators might change this.
The CRTC’s threshold for TV, instead, is based on a single snapshot of a single company’s share of one broadly defined market – the total TV market –“before” and “after” a single transaction. It is a static measure that has no sense of trends over time, the relational structure of markets or any capacity to analyze the drift of events across media and the network media ecology as a whole.
The Competition Bureau draws selectively from the US HHI guidelines. It does not use the HHI thresholds. Instead, it focuses on “the relative change in concentration before and after a merger” (emphasis added, p. 19, fn 31). How faithful it is to either its CR4 guidelines or the HHI criteria for judging relative changes in market power is open to question, however, in light of its decision earlier this year to bless Bell-Astral 2.0 (here). In Canada regulators appear to mostly make it up as they go along rather than consistently follow a coherent set of guidelines.
The Historical Record and Renewed Interest in Media Concentration in the 21st Century
There has always been keen interest in media ownership and concentration in Canada and the world since the late-19th and early-20th centuries.
In 1910, for example, the Board of Railway Commissioners (BRC) broke up the three-way alliance between the two biggest telegraph companies — Canadian Pacific Telegraph Co. and the Great Northwestern Telegraph Co. (the latter an arm of the New York-based goliath, Western Union) – and the American-based Associated Press news wire service. Why?
The BRC did this because, it argued, in the face of much corporate bluster, that allowing the telegraph companies to give away the AP news service for free to the leading newspaper in one city after another might be good for the companies but it would “put out of business every news-gathering agency that dared to enter the field of competition with them” (1910, p. 275). In a conscious bid to use telecoms regulation to foster the development of rival news agencies and newspapers, the BRC forced Western Union and CP Telegraphs to unbundle the AP news wire service from the underlying telegraph service. It was a huge victory for the Winnipeg-based Western Associated Press – which initiated the case – and other ‘new entrants’ into the daily newspaper business (Babe, 1990).
Media concentration issues came to a head again in the 1970s and beginning of the 1980s, when three inquiries were held: (1) the Special Senate Committee on Mass Media, The Uncertain Mirror (2 vols.)(Canada, 1970); (2) the Royal Commission on Corporate Concentration (1978); and (3) the Royal Commission on Newspapers (Canada, 1981).
Things lay dormant for more than two decades thereafter before springing to life again after a huge wave of consolidation in the late-1990s and turn-of-the-21st century thrust concerns with media concentration back into the spotlight. Three inquiries between 2003 and 2008 were held as a result: (1) the Standing Committee on Canadian Heritage, Our Cultural Sovereignty (2003); (2) the Standing Senate Committee on Transport and Communications, Final Report on the Canadian News Media (2006); (3) the CRTC’s Diversity of Voices report in 2008.
Competitive Openings and Two (three?) Waves of TMI Consolidation
As I noted in my last post, the media economy in Canada grew immensely from $39 billion in 1984 to $73.3 billion last year (in inflation-adjusted “2012 real dollars”). Between 1984 and 1996, new players meant more diversity in all sectors, except for newspapers as well as cable and satellite video distribution. Concentration climbed significantly in both of those sectors.
Conventional as well as pay and subscription television channels expanded during this time as well. In terms of ownership, incumbents and a few newcomers – e.g. Allarcom and Netstar –cultivated the field, with their share of the market growing steadily.
Concentration levels remained very high in wired line telecoms in the 1980s and early 1990s, too. Mobile wireless telecoms services were developed by two incumbents, Bell and Rogers. As had been the case in many countries, telecoms competition moved slowly from the ends of the network into services and then network infrastructure, with real competition emerging in the late-1990s before the trend was reversed and concentration levels began to climb again, notably after the dot.com crash in late-2000.
In the 1980s and early-1990s, consolidation took place mostly among players in single sectors. Conrad Black’s take-over of Southam newspapers in 1996 symbolized the times. In broadcast television, amalgamation amongst local ownership groups created the large national companies that came to single-handedly own the national commercial television networks by the end of the 1990s: CTV, Global, TVA, CHUM, TQS.
While weighty in their own right, these amalgamations did not have a big impact across the media. The CBC remained prominent, but public television was being eclipsed by commercial television as the CBC’s share of all resources in the television ‘system’ slid from 46 percent in 1984 to less than half that amount today (20.4%).
Gradual change defined the 1980s and early-1990s, but things shifted abruptly by the mid-1990s and into the 21st century as two (and maybe three) waves of consolidation swept across the TMI industries. A few highlights help to illustrate the trend:
Wave 1 – 1994 to 2000: Rogers’ acquisition of Maclean-Hunter (1994), but peaking from 1998 to 2001: (1) BCE acquires CTV and the Globe & Mail ($2.3b); (2) Quebecor takes over Videotron, TVA and the Sun newspaper chain ($ 7.4b) (1997-2000); (3) Canwest buys Global TV ($800m) and Hollinger newspapers papers, including National Post ($3.2b).
Wave 2 – 2006-2007. Bell Globe Media re-branded CTVglobemedia, as BCE exits media business. CTVglobemedia acquires CHUM assets (Much Music, City TV channels and A-Channel). CRTC requires CTVglobemedia to sell City TV stations – acquired by Rogers (2007). Astral Media’s buys Standard Broadcasting. Quebecor acquires Osprey Media (mid-size newspaper chain)(2006). Canwest, with Goldman Sachs, buys Alliance Atlantis (2007) (Showcase, National Geographic, HGTV, BBC Canada, etc) – and the biggest film distributor in Canada.
Wave 3 – 2010 – ? Canwest bankrupt. Newspapers acquired by Postmedia, TV assets by Shaw. BCE makes a comeback, buys CTV (2011) and bids for Astral Media in 2012, but fails to gain CRTC approval.
The massive influx of capital investment that drove these waves of consolidation across the telecom, media and Internet industries is illustrated in Figure 1 below.
Figure 1: Mergers and Acquisitions in Media and Telecoms, 1984–2012 (Mill$)
[visualizer id=”700″]
Sources: Thomson Reuters. Dataset on file with author.
Mergers and acquisitions rose sharply between 1994-1996, and spiked to unprecedented levels by 2000. The collapse of the TMT bubble ended such trends, until they restarted again between 2003 and 2007 before being ground to a halt by the Global Financial Crisis (2007ff), and with only a tentative step up since. These patterns reveal that trends in the network media economy parallel the state of the economy in near lockstep fashion; they also closely track those in the US and globally.
Consolidation has yielded a specific type of media company at the centre of the network media ecology in Canada: i.e. the integrated media conglomerate. While popular in the late-1990s in many countries, many media conglomerates have since collapsed or been broken up (AOL Time Warner, AT&T, Vivendi, CBS-Viacom, and parts of NewsCorp, etc)(see, for example, Jin, 2011; Jin, 2013; Skorup & Thierer, 2012; Thierer & Eskelen, 2008; Waterman & Choi, 2010).
Despite deconvergence trends elsewhere, in Canada media-telecom and internet conglomerates are still all the rage. Figures 2 and 3, in fact, illustrate the acceleration of the trend toward vertical integration from 2008 to 2012, largely due to Shaw’s acquisition of the Global TV and a suite of specialty and pay TV channels from Canwest (2010) and Bells re-purchase of CTV (2011).
Figure 2:
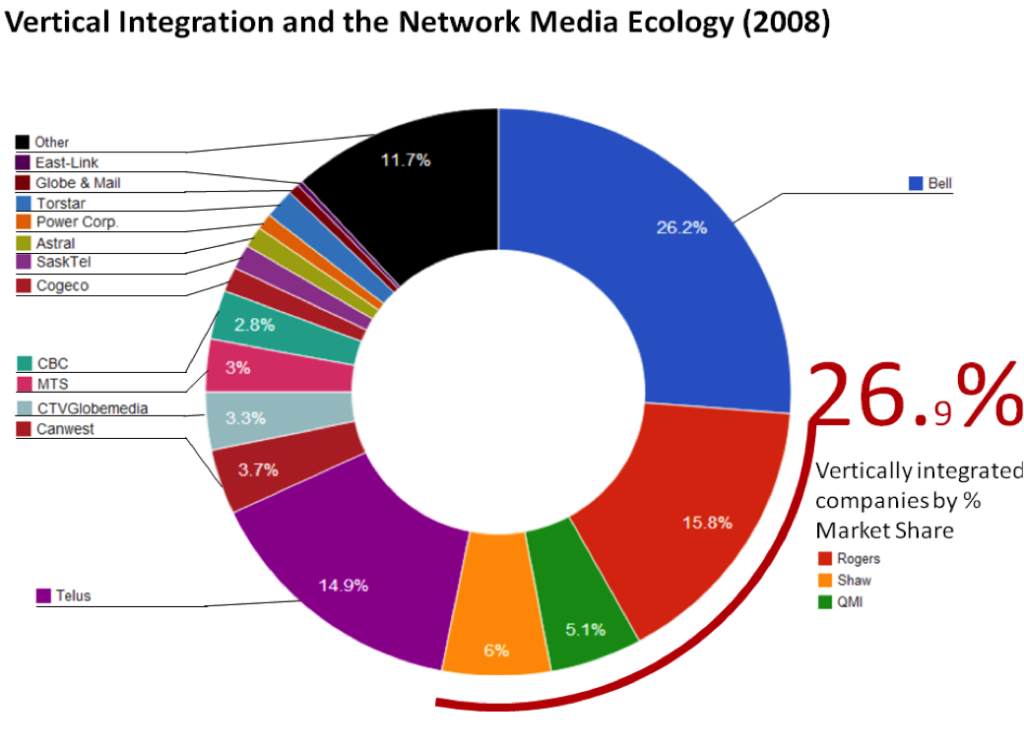
Figure 3:
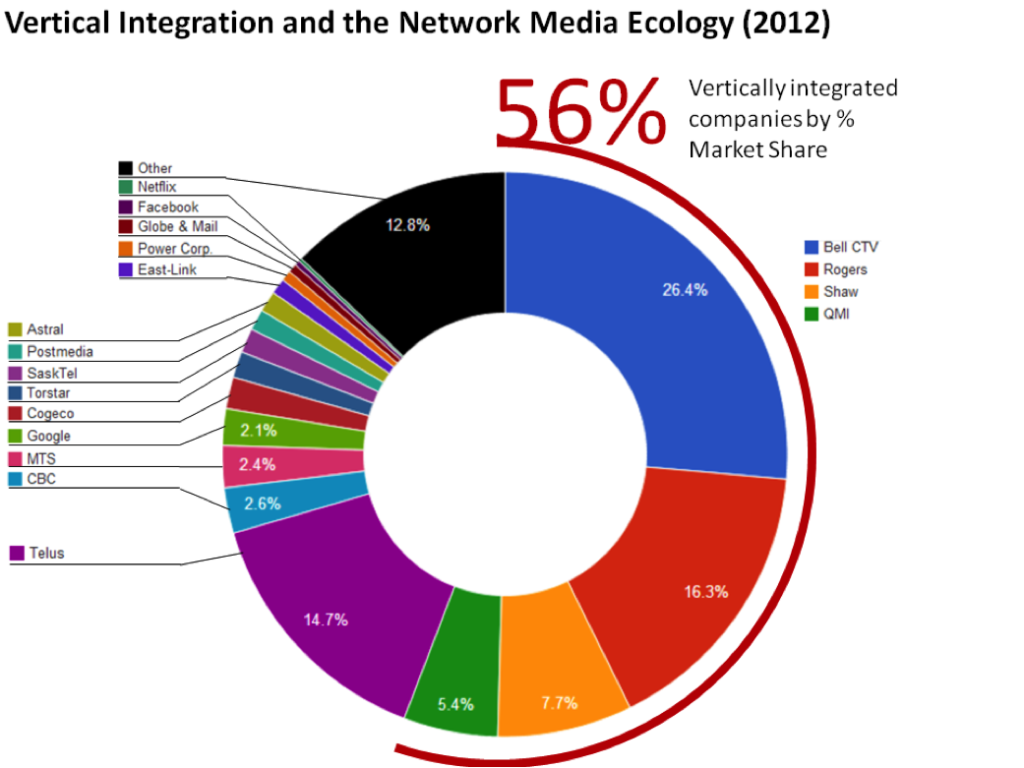
Sources: Media Industry Data, Sources and Explanatory Notes
By 2012, four giant vertically integrated TMI conglomerates accounted for 56% of all revenue across the network media economy: Bell (CTV), Rogers (CityTV), Shaw (Global) and QMI (TVA). Add Telus to the fold and the number swells to 71 percent. The ‘Big 5’ are joined by a second tier of a dozen or so more focused entities: the CBC, MTS, Google, Cogeco, Torstar, Sasktel, Postmedia, Astral, Eastlink, Power Corporation, the Globe and Mail, Facebook and Netflix, ranked on the basis of Canadian revenues.
Strip out the wireline and wireless telecoms sectors and we get a more sensitive view of what is going on across the rest of the media universe because those two sectors are so big that they cast a shadow over everything else. From this vantage point, the big ten’s share of revenue reached it’s low point in 1996 (51.7%), before reversing course to reach 58% in 2000. By 2004, the big ten’s share of all revenues (without telecoms) soared to 70%, where things have stayed basically flat since. The big 10’s market share in 2012 was 69%: Bell, Shaw, Rogers, QMI CBC, Google, Cogeco, Torstar, Postmedia and Telus, in that order.
The big four’s share of the network media economy rose significantly to 48% in 2010 (after Shaw’s acquisition of Global) and rose again to 51% in 2011 (when Bell re-acquired CTV), where it has basically stayed since — an all-time high and well above the low point CR4 score of 24% in 1996. Media concentration in Canada is currently more than twice as high as in the US based on Noam’s analysis in Media Ownership and Concentration in America.
Figure 4 below depicts the relative share of the major players in the network media economy as things stood in 2012, without the telecommunications sectors.
Figure 4:
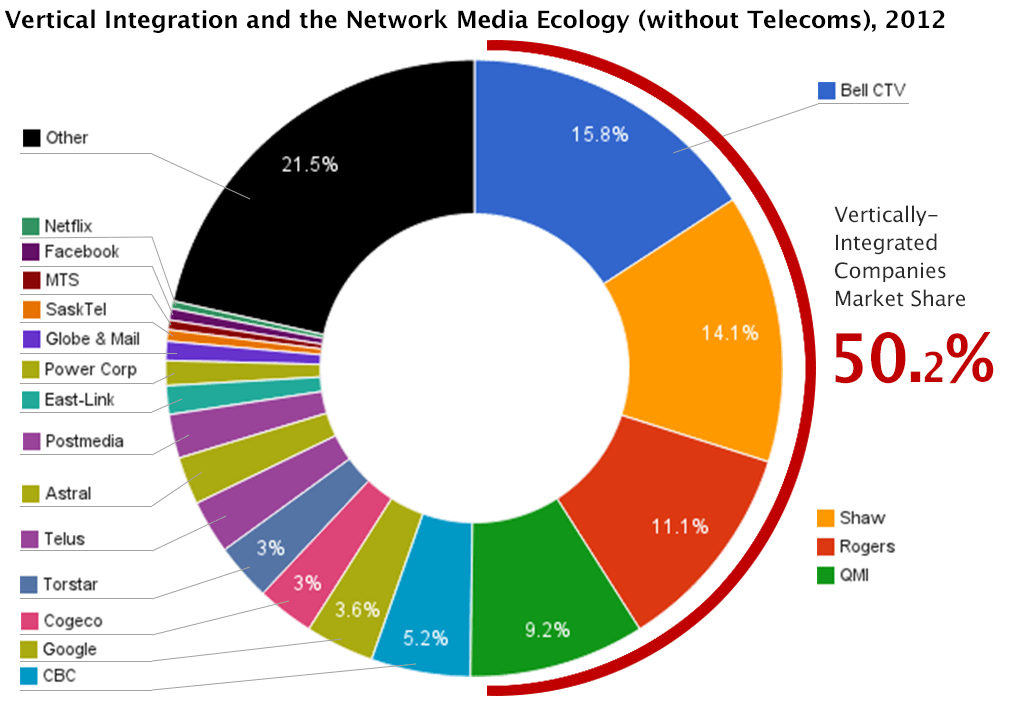
Sources: Media Industry Data, Sources and Explanatory Notes
The next section doubles back to look at things sector-by-sector, and within the three main categories in which we group these sectors:
- platform media (wireline & wireless, ISPs, cable, satellite, IPTV);
- ‘content’ (newspapers, tv, magazines, radio);
- ‘online media’ (search, social, operating systems).
At the end, I combine these again one last time to complete the analysis of the network media industries as whole.
Platform Media
All sectors of the platform media industries are highly concentrated or at the high-end of the moderately concentrated scale, and pretty much always have been, although Internet Access is a partial exception.
Table 1: CR and HHI Scores for the Platform Industries, 1984 – 2012
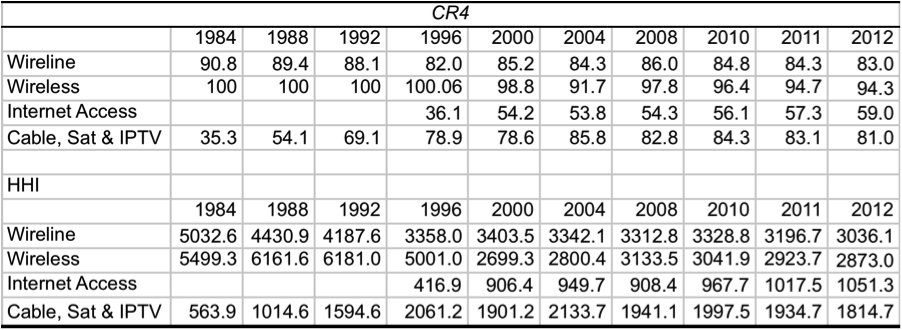
Sources: Media Industry Data and Sources and Explanatory Notes.
CR4 and HHI measures for wireline telecoms scores fell in the late-1990s as some competition took hold. They reached their lowest level ever at the time between 2000 and 2004 before the the dot.com bubble collapse took out many of the new rivals with it (CRTC, 2002, p. 21). Competition waned thereafter until 2008, but has risen since. Levels of concentration for this sector are very high nonetheless by both the CR4 and HHI measures.
Mobile Wireless
Much the same can be said with respect to wireless services. They have consistently been highly concentrated, and still are, despite the advent of four new entrants since 2008: Mobilicity, Wind Mobile, Public and Quebecor.
Some recent studies argue “that there is not a competition problem in mobile wireless services in Canada” (see here and here). That conclusion rests on questionable assertions about efficiencies that are often asserted but seldom hold up under scrutiny, and contestible markets theory, in contrast to realities on the ground (see here, here and here).
Claims that there is no wireless competition problem in Canada clash with the reality that CR4 scores have been stuck in the ninety-percent range for the entire history of wireless in Canada, a level well-above the Competition Bureau’s standards. Concentration is a durable fixture in the wireless sector rather than something that will wilt over time. CR and HHI scores have drifted downwards since new rules to encourage new entrants were adopted for the spectrum auction in 2008, but in 2012 the HHI score was still 2873 – far above the 2,500 market that defines a highly concentrated market.
Two competitors – Clearnet and Microcell – emerged in the late-1990s and managed to garner 13.4 percent of the market between them, but were taken over by Telus and Rogers in 2000 and 2004, respectively. It is still too early to tell whether the new entrants will fare, but with only 7% market share in 2012 they were just half way to restoring the high-water mark of competition set a decade ago with mounting signs of trouble swirling about all of them, except Quebecor and, to a lesser extent, perhaps Wind – but these are points for next year’s post.
Internet Access
As the telecoms and Internet boom gathered steam in the latter half of the 1990s new players emerged to become significant competitors, with four companies taking over a third of the ISP market by 1996: AOL (12.1%), Istar, (7.2%), Hook-Up (7.2%) and Internet Direct (6.2 percent).
The early ‘competitive ISP era’, however, has yielded to more concentration since. Although the leading four ISPs accounted for a third of all revenues in 1996, by 2000 the big four’s (Bell, Shaw, Rogers & Quebecor) share had grown to 54 percent, where it stayed relatively steady for much of the rest of the decade. Since 2008, however, the CR4 has crawled upwards to reach 59% last year.
HHI scores for internet access doubled between 1996 and 2000, but are still low relative to most other sectors and to this measure’s standards for concentration. However, this reflects the limits of the HHI method in this case, since 93% of residential internet subscribers use one or another of the incumbent cable or telecom companies’ for internet access. The top 5 ISPs account for 76% of all residential high-speed internet access revenues (CRTC Communication Monitoring Report, pp. 143-144).
Climbing down from national measures to the local level, internet access is effectively a duopoly, with the left over 7% of the market not dominated by the incumbents scattered among 500 or so independent ISPs. TekSavvy is the biggest ISP with an estimated 180,000 subscribers in 2012 and just over 1% market share. Other small ISPs are on the wane (Primus). Indy ISPs’ market share has increased slightly from 2010, but it has stayed flat for the past two years and is nowhere near returning to the high-water mark of competitive internet access in the late-1990s.
Canada has relied on a framework of limited competition between incumbent telecom and cable companies for wireline, wireless, internet access and video distribution markets. Incumbents still dominate all of these sectors, while smaller rivals continue to eek out an existence on the margins in each.
Cable, Satellite and IPTV
Concentration in cable, satellite and IPTV distribution rose steadily from low levels in the 1980s (850) to the upper end of the moderately concentrated zone (by the new HHI guidelines) in 1996 (i.e. HHI=2300), before drifting downwards to the low 2000s by the turn-of-the-century. This is where things have stood until recently as the incumbent telcos’ IPTV services exert pressure on the incumbent cable companies.
The cable, satellite and IPTV industry is still largely a duopoly at the local level. The CR score has dropped 5% since 2004 but the big four still dominate with 81% market share: Shaw (25.1%), Rogers (22.3%), Bell (21.1%) and Quebecor (12.5%). Add the next five biggest players – Cogeco (7.5%), Eastlink (3.8%), Telus (3.6%), MTS (.9%) and SaskTel (.9) – and all but two percent of industry revenues are accounted for.
The telcos’ IPTV services are making incursions into the incumbent cable and satellite service providers’ turf, accounting for 7.5% of the TV distribution market by revenue in 2012 (based on my numbers, or about 6.7% percent using CRTC data)(see p. 110). In terms of subscribers, IPTV services account for 10% of the market (CRTC numbers are slightly lower, p. 111) (see here for partial explanation of the differences).
Since IPTV services began to be rolled out by MTS and SaskTel in 2004, followed later by Telus and Bell in 2008 and 2009, respectively, the HHI score has fallen 320 points (see Table 1 above) and now sits at the lower end of the “moderately concentrated” scale. The threat to incumbent cable companies is greatest in western Canada, where MTS, SaskTel and Telus have rolled out IPTV services faster than Bell from Ontario to the Atlantic.
Within the platform media industries as a whole, new players have emerged, but it is primarily the expansion of incumbent telcos and cable companies outside their traditional turf and into one anothers’ industries that is generating the greatest effect. There has been a modest increase in competition in all platform media sectors in recent years since except internet access. While new technologies have increased the structural complexity of platform media, they have not disrupted the long-standing trajectory of development when it comes to tv distribution: more channels, and a few new players, but with more of the whole in the hands of the old.
The Media Content Industries
Television
In the late 1980s until 1996, concentration in broadcast TV fell sharply while the specialty and pay TV channels emerging at this time displayed similarly high levels of competition. TV became much more diverse as a result.
Such trends abruptly reversed in the late-1990s, however, with something of a lag before the specialty and pay TV market began to follow suit. After the turn-of-the-century concentration levels for TV climbed steadily and substantially. The upswing since 2008 has been especially sharp. Figure 5, below, shows the trend in terms of CR scores; Figure 6, in terms of the HHI.
Figure 5 CR Scores for the Content Industries, 1984-2012
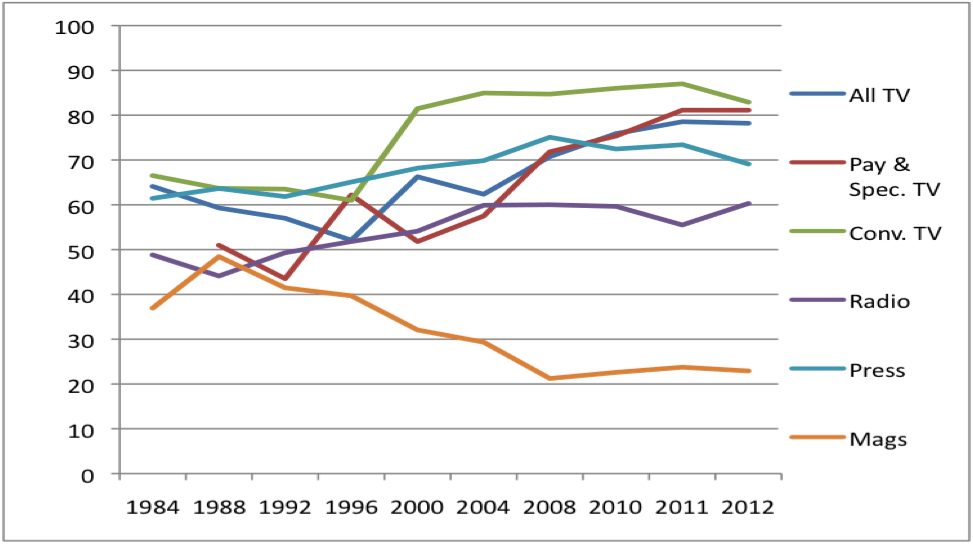
Figure 6 HHI Scores for the Content Industries, 1984-2012
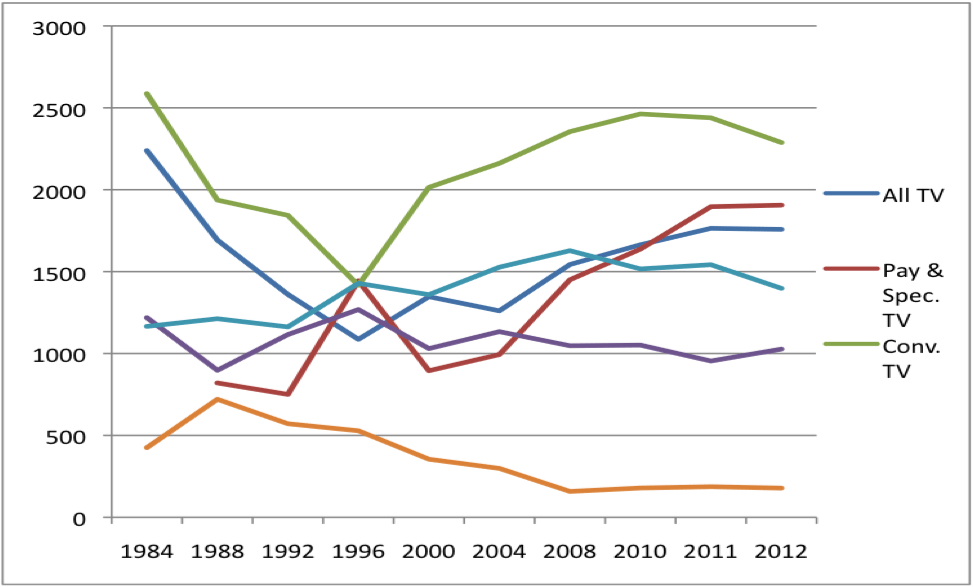
Sources: Media Industry Data and Sources and Explanatory Notes.
In 2012, the largest four television providers controlled about 78% of all television revenues, up substantially from 71% four years earlier. In terms of the 700 TV channels actually operating in Canada, the big four own 171 of them in total: Shaw (66 tv channels), Bell (61), Rogers (24) and Quebecor (20). In contrast, in 2004, the big four accounted for 62% of the TV biz, a time before major players such as Alliance Atlantis and CHUM had carved out a significant place for themselves in the TV marketplace (circa 2000-2006), respectively — and before they had been bought out by the now defunct Canwest and Bell/CTV 1 (circa 2000-2006), respectively.
Concentration across the total TV market has been pushed to new extremes in recent years, first, by Shaw’s take-over of Canwest’s television assets in 2010 and, second, by Bell’s buy-back of CTV the year after that. They would have been higher yet had the CRTC approved Bell’s acquisition of Astral Media – the fifth largest television provider – rising to about 86%. The about face on that matter in 2013 will be dealt within in next year’s version of this post.
In 2012 the largest four tv providers after Bell and Shaw were: the CBC, Rogers, Astral, and QMI, respectively, and in that order. Together, they accounted for 91% of the entire television industry last year. Similar patterns are replicated in each of the sub-components of the ‘total television’ measure (conventional television, pay and specialty channels), as the chart above illustrates.
In contrast, in 2004, the six largest players accounted for a little over three-quarters of all revenues. The run of HHI scores reinforces the view that the television industry has become markedly more concentrated in the past two years.
CR and HHI measures for tv were the lowest in the 1990s when newcomers emerged (Netstar, Allarcom), yet before the time when the multiple ownership groups that had stood behind CTV and Global for decades combined into single groups. The period was significantly more diverse because the CBC no longer stood as the central pillar in tv and radio, while specialty and pay television channels were finally making their mark. Today, the latter are the jewel in the TV crown, but they are highly concentrated by the CR4 measure, with a CR4 of 81%, yet only moderately so by HHI standards with a score of 1906.
Newspapers
Concentration in the newspaper industry rose steadily from 1984 until 2008, when it peaked. In 1984, the top four groups accounted for 61% of all revenues, a number which had risen to about two-thirds of the market in 1996 – a level that stayed fairly steady for most of the next decade before rising again to an all-time high within the time frame studied here in 2008. At that point, the four largest newspaper groups accounted for three-quarters of the market: Canwest (23.7%), Quebecor (21.5%), Torstar (19.3%) and Power Corp (10.5%).
Levels have since declined considerably by either the CR4 or HHI measure, with the former falling to 69% in 2012 and the latter dropping from 1628 in 2008 to 1,398 – well within the ‘competitive’ range by the lights of the new HHI standards or only moderately concentrated by the old standards. The new conditions likely reflect Postmedia’s decision to sell some of its newspapers (Victoria Times Colonist) and to cut publishing schedules at others. Indeed, its market share has fallen steeply from 24% in 2008 when the papers were still in the hands of Canwest to just 17% last year, and within a significantly smaller market. A few new publishers have also emerged amidst the tough times now facing the newspaper industry, notably Black Publishing and Glacier Publishing in western Canada.
Magazines
Of all media sectors, magazines are least concentrated, with concentration levels falling by nearly one half on the basis of CR scores and two-thirds for the HHI over time.
Radio
Radio is also amongst the most diverse media sectors according to HHI scores, and only slightly concentrated by the C4 measure. The shuffling of several radio stations between Shaw/Corus and Cogeco in 2011 had continued the long-term decline in concentration, but in 2012 there was an uptick as the CR4 rose from 56% to 60% and the HHI from 954 to 1027. Bell’s take-over bid for Astral – Canada’s largest radio broadcaster – would have further pushed radio along this path had it have been approved by the CRTC in 2012. Levels of concentration would have been high by the CR measure, with the CR4 rising from 60% to 68%, but with an HHI of 1371 it would still have been well within the unconcentrated zone by the revised HHI guidelines or moderately concentrated by the old ones.
Online Media
As the earlier discussion of internet access showed, there is little reason to believe that core elements of the Internet are immune to high levels of concentration. But what about other core elements of the Internet and digital media ecology: search engines, social media sites, browsers, operating systems and internet news sites?
Concentration in the search engine market grew markedly from 2004 to 2011. CR4 scores have been persistently sky-high during these years, rising from 93% in 2004 to almost 98% in 2011, while HHI scores have been off-the-charts in the 4000-7000 range. Google’s dominance seemed to be locked in the low 80%-range, with others lagging far behind, during this period.
Google’s share of search, however, tumbled in 2012 to just under 68%, although this still leaves Microsoft (17.8%), Yahoo! (5.4%), and Ask.com (6.2%) trailing far behind. The CR4 and HHI scores are still sky-high at 97% and 4995, respectively, and as Table 2 shows.
Table 2: CR4 and HHI Scores for the Search Engine Market, 2004-2012 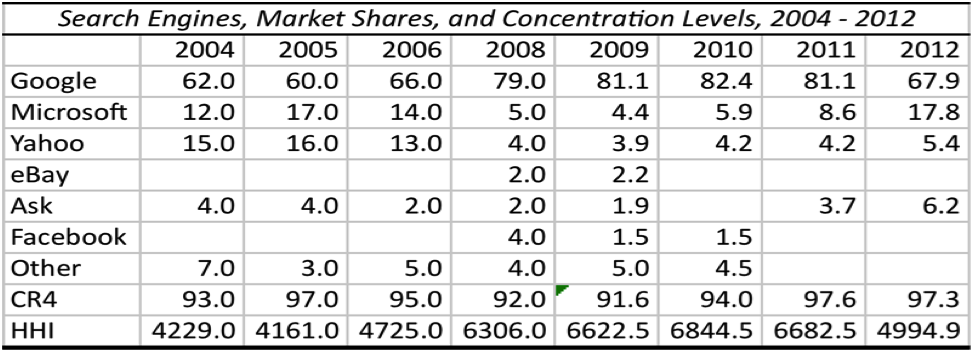
Source: Experien Hitwise Canada. “Main Data Centre: Top 20 Sites & Engines.” last Accessed May 2013.
Social media sites display a similar but not quite as pronounced trend. Facebook accounted for 46% of unique visitors to such sites in December 2012, followed by Twitter (15%), LinkedIn (12%), Tumbler (12%), Instagram (9%) and Pinterest (6%) (Comscore). Again, the CR4 score of 85% and HHI score of 2762 reveal that social networking sites are highly concentrated.
Similar patterns hold for the top four web browsers in Canada. Microsoft’s Explorer (55%), Firefox (20%), Google’s Chrome (18%), Apple’s Safari (5%) have a market share of 98 percent (Netmarketshare). In terms of smart phone operating systems, the top four players accounted for 96 percent of revenues: Apple’s iOS (55%), Google’s Android OS (29%), Java (7%), Nokia’s Symbian (5%). RIM (3%) and Microsoft (1%) accounted for the rest (Netmarketshare).
Internet news sites are an exception to the extremely high levels of concentration in the online digital media environment. Internet users time on top 10 online news sites nearly doubled from 20 to 38 percent between 2003 and 2008. Most of that increased time is spent on sites that are extensions of well-known traditional media companies: cbc.ca, Quebecor, CTV, Globe & Mail, Radio Canada, Toronto Star, Post Media, Power Corp. Other major sources included CNN, BBC, Reuters, MSN, Google and Yahoo! (Zamaria & Fletcher, 2008, p. 176).
Despite this rapid “pooling of attention” on the top 15 or so news sites, concentration levels stayed flat between 2004 and 2007. They declined thereafter until 2011 – the latest year for which good data is available. Online news sources are not concentrated by either the CR or HHI measure and are diverse relative to any of the other sectors, except magazines.
Table 3: Internet News Sources, 2004-2011
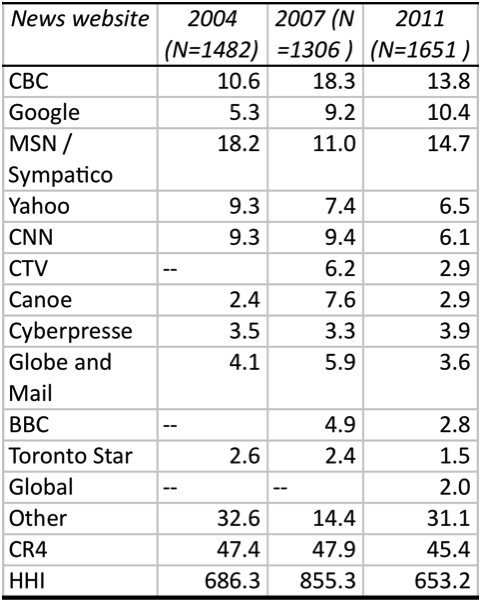
Source: Table calculated by Fred Fletcher, York University, from the Canadian Internet Project Data sets (Charles Zamaria, Director). Reports on the 2004 and 2007 surveys are available at www.ciponline.ca.
The Network Media Industries as a Whole
Combining all the elements together yields a birds-eye view of long-term trends for the network media as a whole. Figure 7 below gives a snapshot of the state of the network media economy in 2012, listing those sectors that were unconcentrated, those that were moderately concentrated and finally those that were highly concentrated by HHI standards.
Figure 7: Concentration Rankings on the basis of HHI Scores, 2012
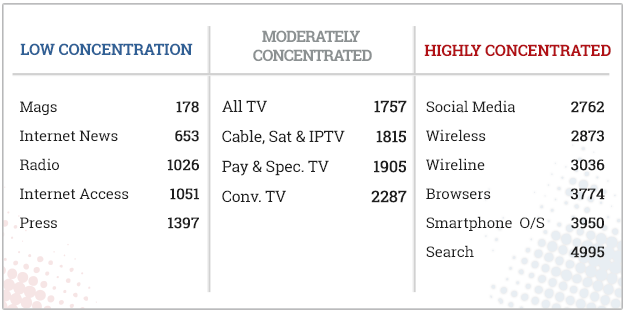
Clearly, things are not all to one side, with several sectors showing low levels of concentration. However, there is no shortage of segments where concentration is either moderately high or very high. Perhaps one of the most striking things to stand out from Figure 7 is the extent to which core elements of the internet and digital media ecology seem to be prone to very high levels of concentration.
Figures 8 and 9 show the trends over time on the basis of, first, CR1, CR4 and CR10 scores, followed by a depiction of the trends based on the HHI.
Figure 8: CR1, CR4 and CR10 Scores for the Network Media Economy, 1984-2012
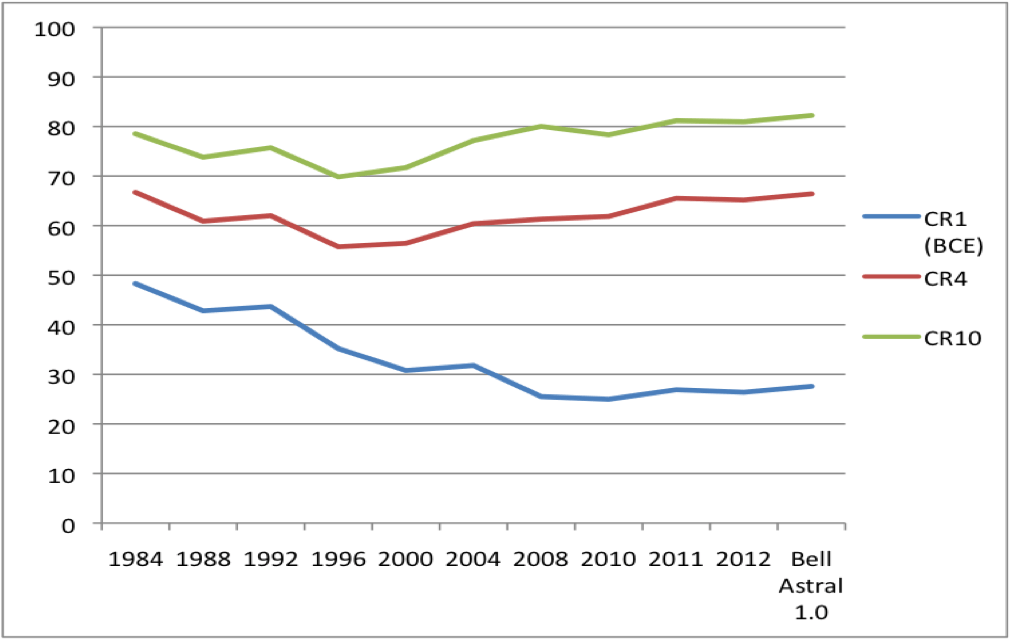
Sources: Media Industry Data and Sources and Explanatory Notes.
Looking the entirety of the network media economy, several distinct points emerge: The biggest company’s share of revenues across the whole of the media twenty-eight years ago was 48%; in 2012, it was 26.4% albeit in a vastly larger media universe. That company in 1984 was BCE; it is still the same company today, and substantially larger than the second and third ranked firms, Rogers and Shaw.
The CR4 levels today are about the same as they were twenty-eight years ago: 66.7% versus 65.1%. Today, the top 10 firms have a larger market share than they did in 1984: 81% versus 76%. These figures would have been higher had the CRTC given the green light to BCE’s first bid to acquire Astral in 2012, as Figure 8 shows.
Figure 9: HHI Scores for the Network Media Economy, 1984-2012
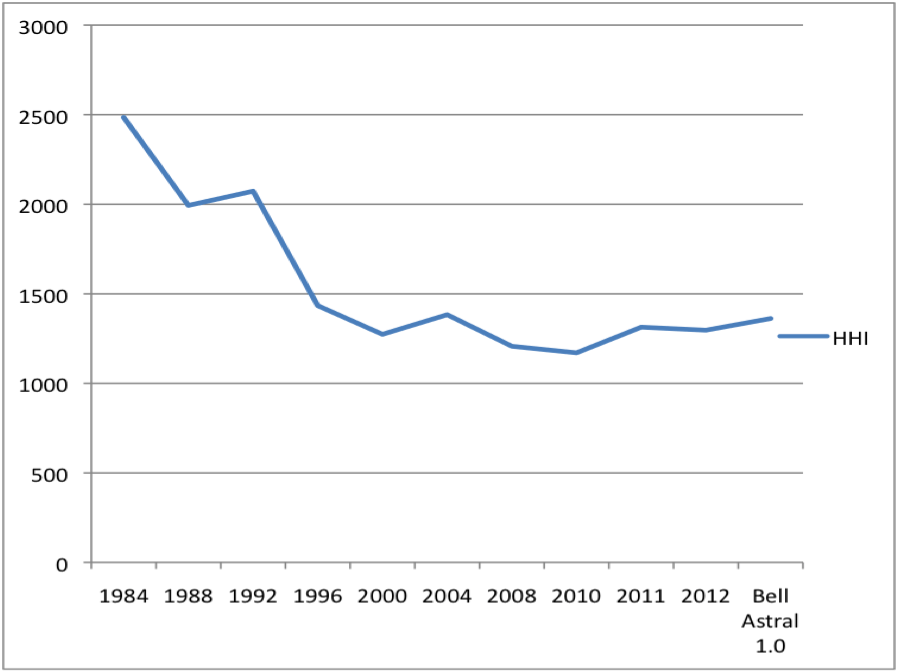
Sources: Media Industry Data and Sources and Explanatory Notes.
As Figure 9 shows, the HHI fell by half from 1984 to 2000. Trends then moved erratically for the next few years before stabilizing in the 1200 to 1300 range, before a significant step up in 2010 and with another potential step in the same direction last year before the CRTC nipped Bell’s bid to acquire Astral in the bud.
The results depict a competitive scenario by the revised 2010 HHI standards (or moderately concentrated by the old standards) – if we take the ‘total media universe’ as the beginning and endpoint of analysis (e.g. Ben Compaine, Ken Goldstein, Adam Theirer). But this is problematic for several reasons.
First, it obscures trends at lower levels of analysis, i.e. sector-by-sector and then by category – platform media, content media and online media – before moving to the total network media. We use the “scaffolding method” precisely so that we can pick up on such things.
Second, such conclusions skate over the fact that while concentration levels according to the most sensitive measure – the HHI — fell greatly between 1984 and 2000, they have basically stayed flat ever since, with a significant uptick since 2010.
Third, from the point of view of the CR4 and CR10, there is a distinct u-shape trend over the past three decades. Concentration fell steeply in the 1980s until 1996-2000, when there was a sharp reversal leading to the CR4 being pretty much the same now as it was thirty years ago. On the basis of the CR10, concentration levels were higher in 2012 than in 1984, i.e. the CR10 in 2012 was 81% vs. 76% in 1984.
From this perspective, concentration has grown significantly over time. At best, one might argue that the CR and HHI scores cut in somewhat different directions, or at least the latter are not so pronounced as the former, and thus the results must be seen as mixed. There is little reason, however, to view the current state of affairs and contemporary trends through rose-tinted glasses.
Concluding Thoughts
Several things stand out from this exercise. First, we are far from a time when studies of media and internet concentration are passé. Indeed, theoretically-informed and empirically-driven research is badly needed because there is a dearth of quality data available. Moroever, general developments and the press of specific events – Bell Astral 1.0 in 2012, the resurrected version of the Bell Astral deal that was approved earlier this year, and now the wireless wars in which some claim there is no competition problem in mobile wireless services at all versus those who argue the opposite – demand that we have a good body of long-term, comprehensive and systematic evidence ready-to-hand.
This kind of data is still very hard to come by and data collection for 2012 reconfirmed that at every step of the way. The CRTC still needs a dramatic overhaul of how it releases information and of its website. The underlying data sets included in the Communications Monitoring Report, Aggregate Annual Returns, and Financial Summaries should be made available in a downloadable, open format (also see David Ellis’ series of posts on this point).
The regulated companies themselves must also be made to be more forthcoming with data relevant to the issues, not less as they so strongly desire (see here for a recent example). The CRTC also publishes too much data that does not square with what the companies themselves state in their Annual Reports. Good decisions cannot be made poor data.
The trajectory of events in Canada is similar to patterns in the United States. Concentration levels declined in the 1980s, rose sharply in the late-1990s until peaking circa 2000 and staying mostly flat thereafter. While processes of deconsolidation and vertical dis-integration have taken hold in the US — with the exception of Comcast’s 2011 blockbuster take-over of NBC-Universal — trends in Canada are running in the opposite direction and with the forces of concentration having gained momentum since 2010.
Of course, trends are not all to one side. The assets from the bankrupt Canwest have been shuffled in recent years, and the process is ongoing with Postmedia selling off further papers in the past year, thereby allowing small newspaper publishers to grow (Black Publishing, Glacier). Some significant new entities have emerged (e.g. Blue Ant, Post Media, Remstar, Teksavvy, Netflix, Tyee, Rabble.ca, Huffington Post, a worker-owned TV station in Victoria, CHEK, and a and CHCH in Victoria and another independently owned TV station in Hamilton, CHCH).
The overall consequence is that we have a set of bigger and structurally more complicated and diverse media industries, but these industries have generally become more concentrated, not less. There is a great deal more that can and will be said about what all this means, but in my eyes it means that concentration in no less relevant in the “digital media age” of the 21st century than it was during the industrial media era of centuries’ past.
The next two posts will look at the state of media concentration in the English- and French-language regions of the network media economy, followed by another that will look at the state of media concentration in Canada relative to the US and the thirty countries studied by the International Media Concentration Research (IMCR) project, including the U.S. Germany, Japan, Australia, the UK, France, and so on. The final two posts in the series will profile the top 20 TMI companies in Canada as well as trends with respect to ownership, boards of directors, revenue, profits and debt.