Growth and Concentration Trends in the English-language Network Media Economy in Canada, 2000-2014
Introduction
This is the third in a series of reports on the state of the telecoms-internet and media industries in Canada (see here and here for the previous two).
In this and the next report I move to a finer-grained analysis of these industries in the French- and English-language speaking regions of the country, respectively, or to put it bluntly, Quebec and the “rest of Canada”. My objects of analysis are the ten largest sectors of what I refer to as the network media economy: mobile wireless, wireline telecoms, internet access, broadcast television, specialty and pay television, total TV (broadcast TV + specialty & pay TV), radio, newspapers, magazines, internet advertising and over-the-top subscription TV services (i.e. Netflix). It also examines concentration trends within each of these sectors and across the network media economy as a whole over the period from 2000 until 2014.
National measures are great for international comparisons, but they obscure the picture closer to home by painting with too broad of a brush. However, the closer one looks, the harder it is to see because much of the publicly available data tends to dry up.
In some cases, a province-by-province picture is possible, for example, as is the case for mobile wireless services as well as for the cable, satellite and IPTV market. However, the latter case is obscured by the fact that Quebec is lumped in together with New Brunswick in CRTC data to mask the specific details of Videotron the largest cable company in Quebec (53% market share based on revenue – down substantially from 72% at the turn of the 21st century; Bell has 38% — up from 10% at that time)(see next post).
Similarly, when it comes to mobile wireless, the advent of a new wireless rival in the Maritime Provinces – Eastlink – has, ironically, led to the suppression of data on market shares normally published in the CRTC’s Communications Monitoring Report in order to keep the details of the new entrant — Eastlink — “private”, an outcome that the privately-held firm does nothing to dispel through its own tight-lipped approach to releasing data about itself.
A few friendly critics have also suggested that we need a closer analysis of data on local retail and wholesale internet access markets and that by using national data for such services, as I have done, I may be concealing the extent to which such markets are highly concentrated and, worse, that such results could serve as an alibi for those who want to keep things that way: e.g. incumbent telephone and cable companies. As a matter of fact, I largely agree with these claims.
I have some ideas as to how we might get closer to the metal, so to speak, but at present the analysis that I offer at the national level, and in this and the next post, is the best that I can do based on the material available. I am all ears in terms of suggestions for how to do better, and am especially open to anyone who wants to offer access to even better data, whether this is offered by the incumbents or the consortia that represents many of the indy ISPs, i.e. CNOC.
Ultimately, the point of this exercise is to develop a good body of long-term data to get the best understanding possible of the state of the telecoms-internet and media industries in Canada. It is also to make it easier to address key questions about what kinds of regulatory and policy options are available that we might be able to choose from to make things better. As I repeatedly say, I think we are living in a constitutive moment – a critical juncture (Starr, 2004; McChesney, 2014) — when choices made now or in the near future will likely have strong cumulative effects on the type of communications and media ecology that we will get and have to live with for much of the rest of the 21st Century.
I hope that others will use and build on the data here. To further such efforts, throughout this report we cite the sources we use while also making the entire dataset underpinning available here for download and use under Creative Commons terms for non-commercial purposes with proper attribution and in line with the ShareAlike principles set out in the International License 4.0.
A PDF version of this report is available here, while a previous version from two years ago can be found here.
The Growth of the English-Language Network Media Economy, 2000-2014
Overall, the English-language markets accounts for about 79% of all revenues across the media economy in Canada as a whole — a rate slightly above their weight of the Canadian population (77%). This reflects the reality that the uptake, use of, and spending on wireless, internet access and paid television services tend to be higher in the Anglo speaking regions of the country than in Quebec.
The big picture, though, is much the same as we saw in the first report in this series: the size of the English-language media economy has expanded greatly from $35.2 billion in 2000 to $58.1 billion in 2014.
Figure 1 below shows the trends.
Figure 1: The Growth of the English-Language Network Media Economy, 2000-2014 (Millions $)
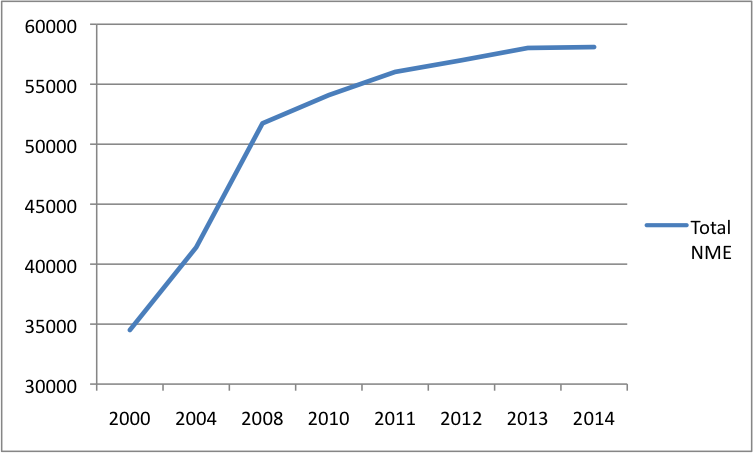
Sources: see the “English Network Media Economy” sheet in the English Media Market Excel Workbook.
A closer look at Figure 1 also reveals, however, that the pace of growth has slowed since 2008. Indeed, it has been anemic since 2012, and was essentially flat in the last year – a point we will return to immediately below.
Digging deeper reveals significant variations in the development trajectories of different sectors of the media. For example, dividing the different sectors into the “platform media” industries (mobile wireless, internet access, and cable, satellite and IPTV), “content media” industries (television, radio, newspapers, magazines, music) and “internet advertising” reveals three key points:
- the platform media industries have grown much faster than the content media industries; the platform media industries are much larger than the content media, accounting for three-quarters of all revenues in 2014;
- the platform media industries are much larger than the content media industries, accounting for three-quarters of all revenues in 2014. Carriage dominates content in an internet- and mobile-centric media world and an environment of bandwidth and information abundance;
- the impact of the economic downturn and instability since 2008 has hit the content-media industries much harder than the platform media industries.
Figure 2 below illustrates these points and the divergent development paths for the ‘platform media’ versus ‘content media’ and ‘internet advertising’ since 2000.
Figure 2: Growth and Development of Platform Media vs Content Media, 2000-2014 (Millions $)
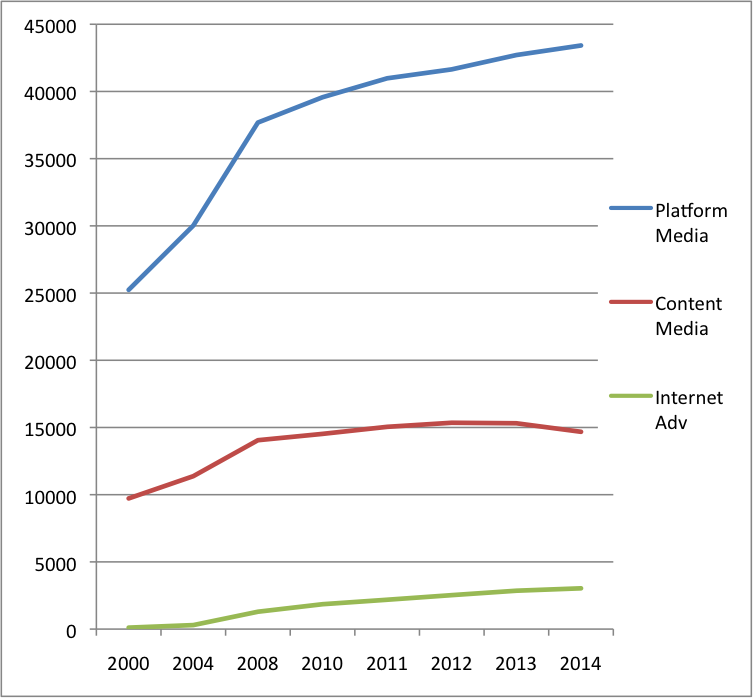
Sources: see the “English Network Media Economy” sheet in the English Media Market Excel Workbook.
Figure 3 takes the analysis a step further by separately depicting the growth for each of the sectors covered in this report. As it shows, while all segments of the telecoms-internet and media industries have grown substantially over time, there are unique differences among them.
Figure 3: Separate Media, Distinct Evolutionary Paths and the Network Media Economy, 2000–2014 (Millions $)
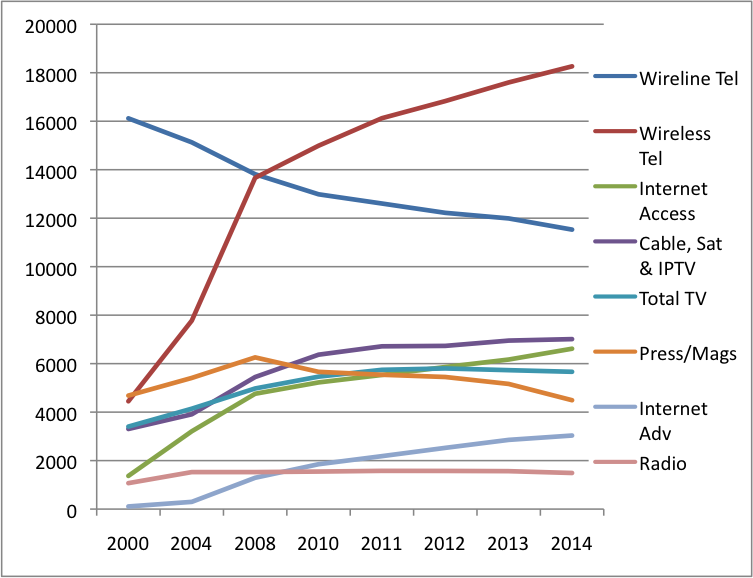
Sources: see the “English Network Media Economy” sheet in the English Media Market Excel Workbook.
The fastest growing sectors of the English-language media economy over the last decade-and-a-half have been the “platform media industries”, that is, internet access (383%), mobile wireless services (310%) as well as cable, satellite and IPTV (112%) and, less so, ‘total television (66%) (i.e. broadcast + subscription television services or 100% if only pay and specialty tv channels are examined (not shown) (see the “Pay & Specialty TV” sheet in the Excel Workbook). In sum, it is the platform media industries and TV, especially subscription-based, pay TV services, that have driven the development of the network media ecology, adding simultaneously to its size and structural complexity.
Internet advertising in the predominantly English-language media markets has been the fastest growing sector of all (+2686% since 2000) and had become a $3.03 billion industry by 2014. Indeed, by 2014, it had surpassed television for the first time as the largest advertising vehicle (see TVB, 2014).
At the same time, however, we must keep in mind that internet advertising only accounted for about 5% of all revenue across the media economy as a whole. This is less than half the amount accounted for by Internet access.
Even the fastest growing media sectors — mobile wireless, internet access and internet advertising — have broken gallop since the “great financial crisis” in 2008, however. This has been most pronounced for most sectors of the content media industries, however, as Figure 3 above shows. As a whole, revenues for the content media industries have basically stayed flat for the past two years, as Figure 2 above shows.
Table 1 below offers a snapshot of which segments of the telecoms-internet and media industries have grown, which have stagnated, and which appear to be in long-term decline within the context of the English-language media markets.
Table 1: Growth, Stagnation, Decline and Recovery in the NME, 2014
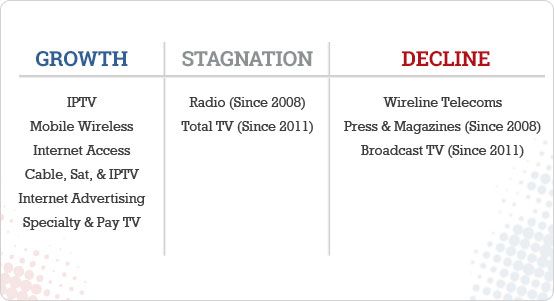
Sources: see the “English Network Media Economy” sheet in the English Media Market Excel Workbook.
The portrait that has emerged to this point strongly suggests that the economic state of the media swivels on the state of the overall economy, as I have pointed out many times in the past (also see Picard, Garnham, Miege). It also suggests that these effects vary across media. As a general rule, the more dependent on advertising a medium is, the more its fate pivots on trends in the macro economy compared to those where subscribers pay most or all of the freight directly out of their own pockets.
The Platform Media Industries: If Content is King, Carriage is Emperor
There are four pathways, or gateways, to people’s homes, hands and offices: mobile wireless (cellphones), internet access, POTS (or plain old telephone service by wireline connections) and Broadcast Distribution Undertakings (e.g. cable, satellite, IPTV). These are the networks people use to communicate with one another through a variety of screens and devices, and to gain access to the internet, media content, news, information and entertainment, and so forth.
In terms of the sheer number of connections and revenue, the ‘platform media’ industries have grown enormously over time. In 2000, total revenues for these sectors in the mainly English-language speaking media economy were $25.2 billion. By 2014, their combined value had soared to $43.4 billion. Fundamentally new sectors have been added (IPTV), emergent ones have surged (internet access) and others have grown steadily (BDUs), although some elements within this last domain have begun to recede in recent years (cable and satellite).
Table 2 below depicts the landscape and tracks the trends in terms of the development of these sectors from 2000 until last year.
Table 2: Revenues for the Platform Media Industries, 2000-2014 (Millions$)
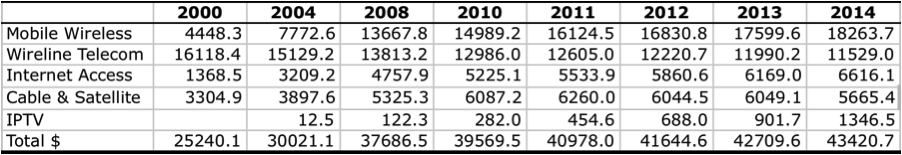
Sources: see the “English Network Media Economy” sheet in the English Media Market Excel Workbook.
The Mobile Wireless Market and the Steady Decline of Plain Old Telephone Service (POTs)
The mobile wireless (cellphone) sector has been one of the fastest growing sectors of the network media industries since the turn-of-the-21st century. It is now the largest sector by far. Revenues of $18.3 billion in 2014 were more than four times what they were in 2000.
Mobile wireless overtook plain old telephone services (POTs) in 2009 and five years later, the number of Canadian households subscribing solely to mobile services exceeded those relying entirely on landlines for the first time (CRTC, 2015, p. 1). ‘Wireless only’ households, however, tend to be amongst the least affluent in the country and where income is not a barrier, people tend to sign up for both wireless and wireline services – although there are other barriers as well (see here, here, here and here).[1]
Revenue for wireline telecoms services fell to $11.5 billion in 2014, far off the high-water mark of $16.1 billion a decade-and-half earlier. Such decreases, however, have been more than offset by strong growth in internet access, IPTV and cable revenues (see below).
The POTs market also continues to be extremely concentrated. The CR4 and HHI scores reached their lowest point a decade ago, when they were 81.4% and 2605, respectively – although such levels were still firmly in ‘highly concentrated’ territory. They have risen steadily ever since. The CR4 was 88.4% and the HHI 2930 last year.
Perhaps one could argue that when industries contract consolidation takes place as the players still standing try to expand through acquisitions rather than from a growing market. That is likely true sometimes.
At the same time, however, the fact of the matter is that consolidation is also occurring in the fastest growing sectors as well, namely mobile wireless and internet access, while in the BDU market, competition has increased somewhat, but still tends toward the moderately to highly concentrated end of the spectrum, depending on how – and where – one measures.
The mobile wireless market, for instance, is not only one of the fastest growing ones, but also the most concentrated. The CR4 fell from a high of 98.7% in 2008 to 92.5% last year, while the HHI also slipped from 3178 to 2725 over the same period of time. Nonetheless, Rogers (33.2%), Telus (29.9%) and Bell (27%) still dominated the English-language markets in 2014, with 90% of wireless revenues between them.
Three new entrants – Wind, Mobilicity and Public – have entered the market since 2008, and have gained some ground since. The largest of them – Wind – had 800,000 subscribers at the end of 2014 and estimated revenues of $280 million from its operations in Ontario, Alberta and BC, and about 1.5% market share. Altogether, the new entrants accounted for 2.5% of the market in 2014 (a little over $400 million).
Despite the modest decline in concentration and concomitant rise in competition, the more pressing reality is that the wireless market in the English-language market remains very highly concentrated by either the CR4 or HHI standard.
Drill down deeper to the provincial level, and the reality just described is even more pronounced except for in Quebec (see next report). In each province from Ontario westward, the top three wireless companies control between 92% of the market (in Ontario) and 96% (Alberta and British Columbia).
Table 3 below illustrates the point.
Table 3: Wireless Market Share (by Subscriber) by Provider and Province, 2014
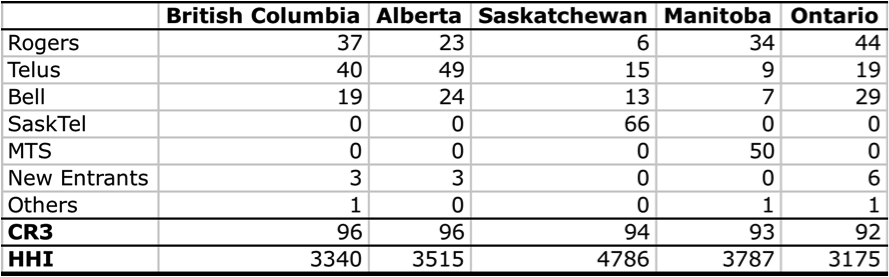
Source: CRTC, unpublished. Record on file with author.
On the basis of HHI scores, the markets in all of the mainly English-speaking provinces can best be described as sky high, and persistently so. This is exactly the conclusion the CRTC reached when arriving at its Wholesale Mobile Wireless Framework ruling earlier this year.
In addition, all of the new entrants have struggled badly. This is largely because even after gaining access to essential spectrum, they have faced major obstacles at every step when trying to gain access to three other essential resources upon which their survival hangs: i.e. capital, site towers and antennae, and reasonable wholesale roaming rates.
The loosening of limits on foreign ownership for cellphone companies with under 10% market share has benefitted Wind, which restructured itself after receiving capital investment from US firms in 2014. Public Mobile and Mobilicity, however, failed, and were acquired by Telus and Rogers in 2013 and 2015, respectively.
One other point to note, but which will be picked up on further detail in the next report, is that the English-language market is more concentrated than in Quebec. As I have noted elsewhere, however, concentration levels in wireless markets tend to be “astonishingly high”, as Eli Noam observes, in most countries around the world, so the fact that such conditions exist in Canada, in and of itself, is not all that remarkable.
The real question is whether regulators and policy-makers will do anything about this state-of-affairs? The answer to that question is that they have, and in the last two years such efforts have been ratcheted up a notch or two.
Building on the government’s use of spectrum caps and set-asides since 2008, and the loosening of restrictions on foreign ownership (2012) (both by Industry Canada), the CRTC has taken four more steps in this direction over the past two years:
- adopted the National Wireless Code (2013) which, among other things, shortened subscriber contracts from three years to two, while allowing people to unlock their phones from their carrier’s network, both of which made switching wireless companies easier and were adopted with an eye to making markets potentially more competitive;
- banned exclusive wholesale wireless roaming agreements and set a temporary wholesale rate cap on mobile wireless roaming rates as instructed to do by the Federal Government in 2014 and, most importantly;
- adopted the wholesale mobile wireless framework this year that gives new entrants mandated access to wholesale roaming at regulated rates while also tightening up on the monitoring of their ability to access tower sites and antennae;
- effectively banned the practice of zero-rating services delivered over the mobile internet and reaffirmed the application of common carrier principles to mobile wireless services, as in the Mobile TV ruling earlier this year.
The overall upshot is that market concentration is not just an empirical reality but a legally established fact and one that policy-makers and regulators have begun to address head-on . . . in the face of tooth-and-nail opposition from Bell, Telus and Rogers.
The Internet Access Market
Internet access has been the fastest growing sector over the last decade-and-a-half. Internet access revenue soared from $1.4 billion in 2000 to $6.6 billion last year. It is useful to remember, though, that it is still roughly a third the size the mobile wireless sector.
Internet access concentration in the English-speaking regions of Canada is high by the standards of the CR4 measure, and growing. The four main regional ISPs – Bell (19.7%), Rogers, (18.8%), Shaw (17.3%) and Telus (12.4%) – accounted for 68.2% of all revenues in 2014, up from 57% in 2000 and from the turn-of-the-21st Century when the same four firms’ market share was just 42%. Moreover, the big four now are the same as the big four then. In other words, their dominant position in the internet access market has not only grown substantially but also proven to be remarkably resilient for a very long period of time.
The internet access market, however, is not concentrated by the standards of the HHI measure at the national level, with a score of 1239. Yet, even on this score, the HHI score in 2014 was two-and-a-half times what it was a decade-and-a-half earlier (497).
The real test, however, emerges when we look at the facts closer to the ground, where people actually use the internet. As we just indicated, the big four are all regional players with, roughly, Bell and Rogers competing in Ontario, and Telus squaring off against Shaw in Alberta and British Columbia. In the ‘real world’ the companies compete with one another in cities and towns across these respective regions.
While it is not possible based on the publicly available data to examine each of these regions or, even better, the situation in cities, towns, villages and remote areas across the country, the CRTC’s figures do show that incumbent telephone and cable companies account for 90.6% of the residential retail internet access market based on revenue in 2014, or 89.3% on the basis of subscribers (CRTC CMR, Tables 5.3.2 and 5.3.4).
The Evolving TV Delivery System: Cable, Satellite and IPTV (or Broadcast Distribution Undertakings (BDUs))
Despite the hew and cry in many quarters, and especially as a popular trope in many (but not all) journalistic circles, the industry conference circuit, and trade press, there is no epidemic of cord-cutting killing the cable television business. In fact, revenue has soared from $3.3 billion at the turn-of-the-21st century to $7.01 billion last year.
Table 4 below depicts this growth overall and for each of the constitutive parts that make up the BDU sector.
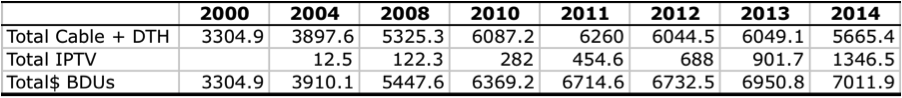
Source: see the “CableSatIPTV” and “IPTV” data sheets in the Excel Workbook.
As Table 4 shows, the TV delivery business is not in death spiral, although growth has slowed in the past few years. The more significant development is that there is a major transformation of the cable television industry underway. This has no doubt that the big cable and satellite companies such as Rogers, Shaw and Cogeco have a sense of being under siege, and for good reason: their revenues have dropped by 10% in the past five years. Why?
The explanation is not cord-cutting but the rise of IPTV. In fact, the losses to the cable and satellite companies have been entirely offset by the growth of Telus, Sasktel, MTS and Bell’s IPTV services, and then some, as Table 4 above shows.
After a lethargic start, the growth of IPTV services in the Anglo-speaking regions of Canada has soared in the past two years. Indeed, revenue more than doubled from $688 million in 2012 to $1346.5 million last year. From 2010 until 2014, the number of IPTV subscribers nearly quadrupled. Last year, there were 1,607,099 IPTV subscribers in the Anglo-speaking regions of the country. Tables 5 and 6 below show the trends.
Table 5: The Growth of IPTV Subscribers in English-Language Markets in Canada, 2004–2014 (year-over-year average)
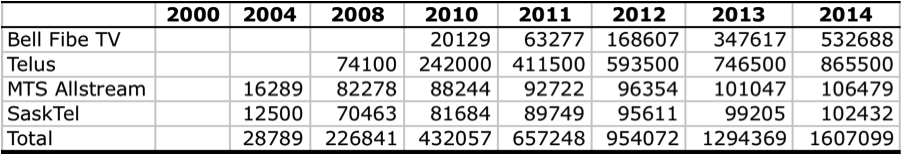
Source: see the “IPTV” data sheet in the English Media Market Excel Workbook.
Table 6: The Growth of IPTV Revenues in Predominantly English-Language Markets in Canada, 2004–2014
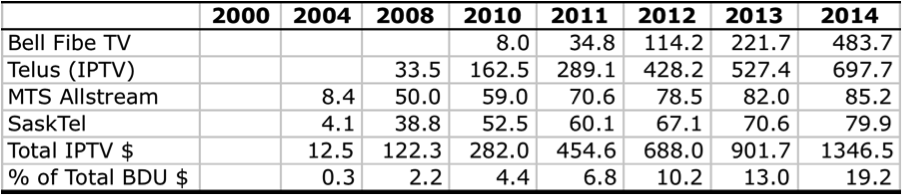
Source: see the “IPTV” data sheet in the English Media Market Excel Workbook.
By 2014, one-in-five households (20%) in the Anglo-speaking regions of the country obtained TV service from Telus, Bell, Sasktel or MTS – a figure that is high relative to Canada as a whole (15%) and by international standards.
The main reason for this recent growth spurt is Bell’s newfound resolve to build out its fibre network in the major cities of Ontario and the Atlantic provinces after years of half-hearted efforts (Quebec is dealt with in the next report). The prairie telcos, MTS and SaskTel, in contrast, launched MTS TV and Max Entertainment, respectively, in 2004, followed by Telus two years after that – as Tables 5 and 6 above also indicate.
Bell’s reticence may be due to it’s commitment to the Expressvu direct-to-home satellite TV service, a kind of path dependency born out of the fear that launching IPTV would cannibalize, and render obsolete, its existing investments. This has, in fact, begun to happen, with Bell’s revenues from its existing DTH TV service slipping close to $150 million, or 11.4%, since 2011.
Competition in the television delivery business has intensified as a result of these developments. Both the HHI and CR4 measures have declined significantly since 2004, when they were both at the upper end of the spectrum with an HHI of 2991 and a CR4 of 97.5%, respectively. Last year, the HHI had dropped to 2211, while the CR4 was 87.5%.
The results are mixed: overall, the BDU market is less concentrated today than it was a decade ago, but the CR4 measure is still firmly at the ‘highly concentrated’ end of the spectrum while the HHI figure is now in the “moderately concentrated’ zone, albeit closer to its upper bounds then the lower threshold. The structure of the market has been recomposed around the local ‘duopoly’ model characteristic of the internet access market. Two incumbent telephone companies – Bell and Telus – compete with the two largest cable companies – Rogers and Shaw – in their respective operating areas of the country. Monopoly has been replaced by duopoly.
Figure 4 depicts the main players’ market shares within the mainly English-language markets across the country.
Figure 4: Cable, DTH & IPTV English-Language Market Share, 2014
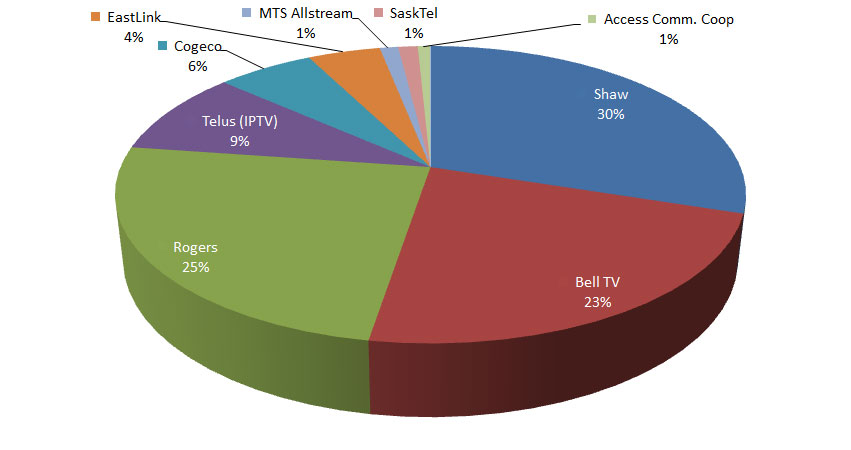
Source: see the “CableSatIPTV” data sheet in the English Media Markets Excel Workbook.
The discussion of the platform media industries so far has established two things: first, they have grown massively and that whatever losses have occurred in the well-established POTs and BDU sectors have been more than offset by the rise of crucial new kinds of carriers (networks): mobile wireless, internet access and IPTV. Overall revenue across all four segments of the platform media industries rose from $25.2 billion in 2000 to $43.4 billion last year.
Second, each of the sectors reviewed is highly concentrated and has become more so over time, except for the BDU market, where the recent trend has been in the opposite direction on account of the telcos’ incursions into the television delivery business. Even here, however, there is little reason for sanguinity given that the results are mixed at best – as the discussion immediately above and below show.
Figures 5 and 6, below, depicts the trends with respect to concentration levels over time for each of the platform media industries within the English-language media economy based on Concentration Ratios (CR4) and the Herfindhahl – Hirschman Index (HHI), respectively.
Figure 5: CR4 Scores for the Platform Media Industries in the English-language Media Economy, 2000-2014
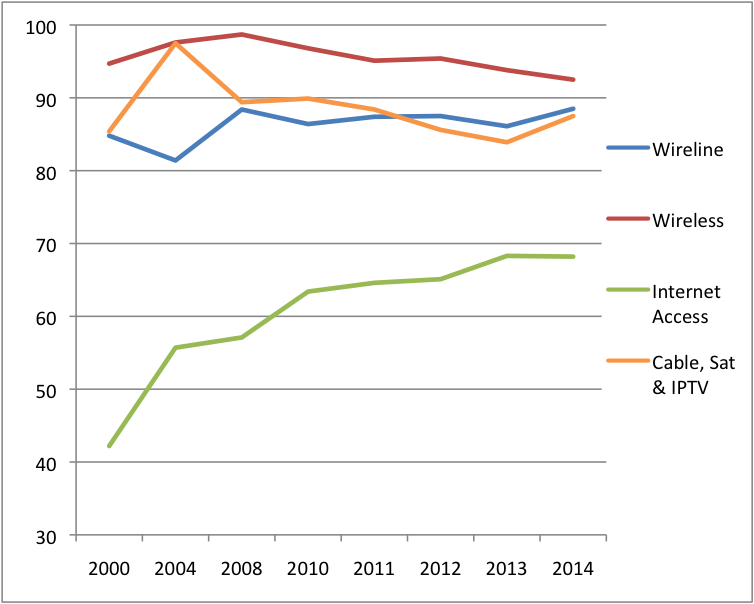
Source: see the “Top 10 Ranking” and “English CR & HHI” data sheets in English Media Market Excel Workbook.
Figure 6: HHI Scores for the Platform Media Industries in the English-language Media Economy, 2000-2014
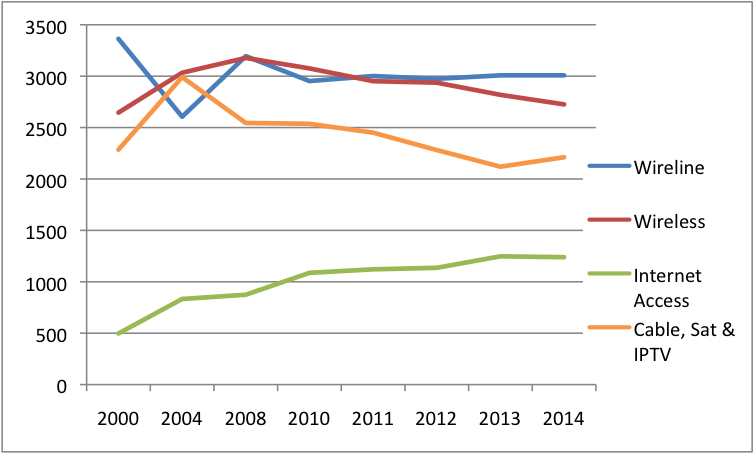
Source: see the “Top 10 Ranking” and “English CR & HHI” data sheets in English Media Market Excel Workbook.
As Figure 5 shows, all of the English-language platform media industries are highly concentrated on the basis of the CR4 measure. While there has been some fluctuation in these levels of concentration over time, and a recent dip for wireless and cable, satellite and IPTV providers, there has been no long-term, significant decline in levels of concentration across the platform media industries. Combine all four areas of the platform media industries, and the big four carriers controlled 86% of the market in the mainly Anglo-speaking regions of the country in 2014: Bell (29.8%), Telus (24.2%), Rogers (21.9%) and Shaw (9.4%).
The HHI measure in Figure 6 provides a more sensitive view, indicating that wireline and wireless are still firmly within the “highly concentrated” range. BDUs have fallen into the upper reaches of the “moderately concentrated” designation for the past four years, albeit with a bit of an uptick in 2014. In general, trends across these sectors saw a rise in concentration levels in the first decade of the 2000s, with peaks between 2004 and 2008, followed by a modest drift downward since.
From the Platform Media Industries to the Content Media Industries: the Lines of Vertically-Integrated Ownership and Control
The structure of the telecom-internet and media industries, and the largest players within them, increasingly reflect the structures of the markets they operate in. That is to say, the biggest players are those whose centre of gravity rests on their control over the platform media industries but with a reach that extends across the broadcast and content media landscape.
Figure 7 below depicts the point, while also giving a sense of the companies’ reach within each of the particular markets that make up the overall network media economy.
Figure 7: Leading Telecoms-Internet and Media Companies in English-Language Markets, 2014.
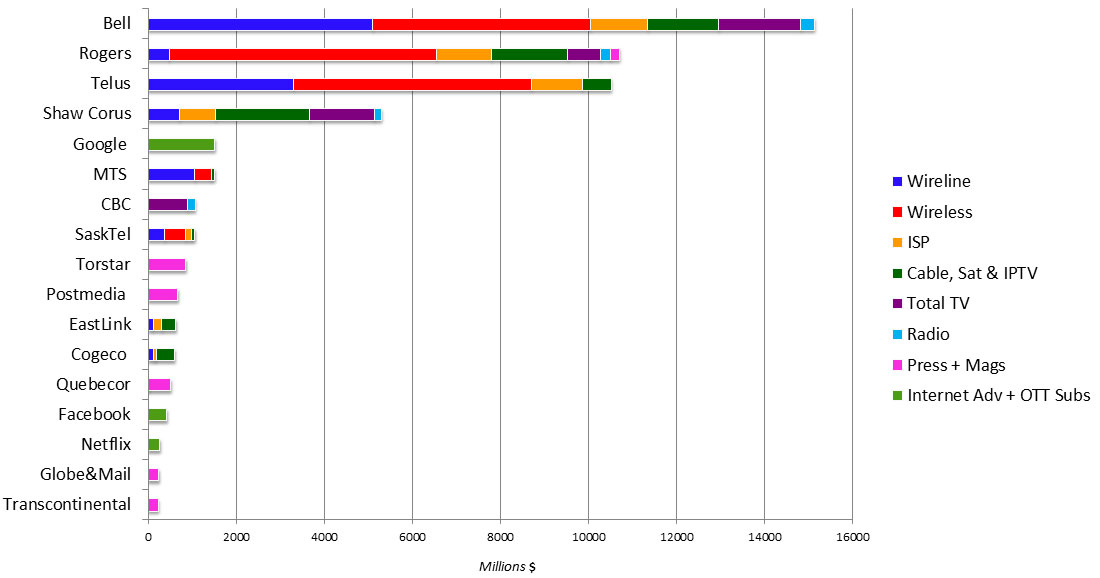
Source: see the “Top 10 Ranking” sheet in the English Media Markets Excel Workbook.
As Figure 7 shows, Bell is the biggest player by far, accounting for over a quarter of all revenue (25.9%), and with a reach that stretches across a large swathe of the different segments that make up the network media economy. Its share of the national market is 28%, in comparison, whereas in Quebec it is 41% — far more than second ranked Quebecor (24%) (see next report).
The two biggest companies in the English-language markets – Bell and Rogers — account for 44% of all revenue; the “big four” for 71%: Bell, Rogers, Shaw and Telus. Three of them — Bell, Rogers and Shaw — are vertically-integrated giants, as Figure 7 also shows. Quebecor barely registers at all, ranking 13th, with less than one percent of all revenues in the English-language markets, in sharp contrast to its place in Quebec.
While Bell, Rogers, Shaw and Telus tower over their peers, a dozen or so second tier adn smaller entities fill out the field: MTS, Google, CBC, Torstar, SaskTel, Cogeco, Postmedia, Eastlink, Quebecor, the Globe and Mail as well as newspaper and magazine publisher Transcontinental. Several things stand out from the list.
First, these smaller companies’ revenues and market shares are less than a tenth of the corresponding figures for the big four. Second, second-tier firms, except Quebecor, are either in the content delivery business or the business of owning and making content, not both. In other words, they are not vertically-integrated, and depending upon which side of the carrier/content divide they stand this leaves them vulnerable to the three vertically-integrated giants when it comes to gaining access to either content or carriage, hence the interminable disputes over access to both resources (see here, here, here, here, here and here for a sample of such disputes).
Third, with estimated revenue of $1,517.2 million from English-language markets in 2014, Google ranked fifth. Facebook ranked fourteenth, with estimated total revenues of $428 million in 2014, just ahead of Netflix, the Globe and Mail, and Transcontinental but behind Cogeco and Quebecor (see the “Top 10 Ranking” sheet in the English Media Market Workbook).
The CBC still plays a significant role in English language markets, but it is steadily losing clout. At the outset of the 21st century, it accounted for about 30% of all TV revenue; today the figure is half that amount. Instead, Bell and Shaw now stand where the CBC stood a dozen years ago, with revenues and market shares roughly double those of the public service media enterprise.
In radio the CBC has slipped precipitously. Whereas the CBC stood out within the field of radio in 2004, in 2014 it stood on an equal footing with Astral, Rogers and Shaw/Corus, each with 11 to 15% market share. In the English-language regions of Canada, it is clear that core public service media have shrunk while the role of the market has expanded enormously.
While Bell, Rogers, Shaw and Telus are top ranked players in many of the areas they operate in, none of them are dominant in all of these sectors. Table 7 below illustrates the point.
Table 7: Big 4 Company Rankings in Each of the Platform Media Sectors
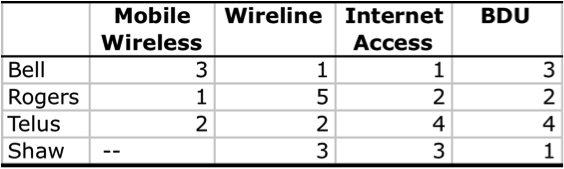
Source: see the individual sheets for each sector in the English Media Markets Excel Workbook.
In short, while there is little doubt that the “Big Four” variously compete and sometimes cooperate with one another in each sector of the platform media industries, jockeying for position at each step of the way, and that this lends itself to their contention that such vigorous competition means there is no need for regulatory interventions such as mandate wholesale access to wireline and mobile wireless facilities, regulated wholesale rates, codes of conduct and, crucially, common carriage, for example. The reality from any other vantage point other than their own, however, is clear: markets are highly concentrated. This is so on the basis of the two most widely used measures of concentration, i.e. the CR4 and HHI methods. It is also so in terms of the legal findings of fact that have underpinned a series of recent regulatory decisions (see here and here especially but also here and here, for example). They might wish it not to be so but such wishes do not make is so.
At the very core of these realities is the fact that Bell, Rogers, Shaw and Telus’ control over communications infrastructure (content delivery) functions is the fulcrum of their business. As a matter of fact, 70-100 percent of these companies’ business comes from their control over carriage and content delivery rather than content ownership and/or creation. Telus is not in the content business at all beyond acquiring rights for its IPTV service, Optik TV and mobile TV, having eschewed the idea that telephone companies must own their own broadcast programming and other content to be effective competitors.
Given the massively larger scale of carriage relative to media content it is not surprising that Bell, Rogers, Telus and Shaw rank at the top of the list in Figure 7 above. Their stakes in content media, while extensive, are still modest relative to their own size, but not within the content media markets in which they operate.
Figure 8, below, illustrates the point:
Figure 8: The Relative Weight Between Carriage and Content in the Organizational Structure of Shaw, Bell, Rogers and Telus
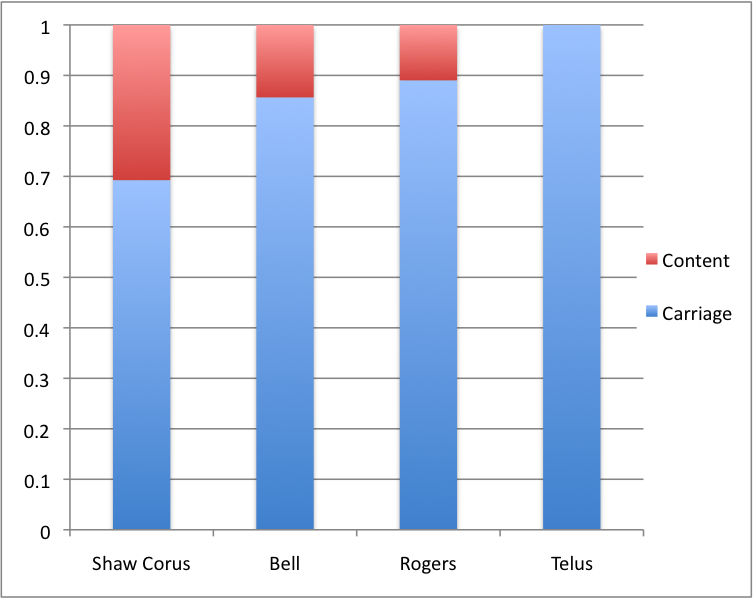
Source: see the “Top 10 Ranking” sheet in the English Media Markets Excel Workbook.
Content media are now largely ornaments on the carrier’s organizational structure, with their main purpose appearing to be to drive the take-up of the more lucrative aspects of the carriers’ main lines of business: e.g. mobile wireless services, broadband internet as well as cable, satellite and IPTV services. The fact that the companies’ operating profits are much smaller than those on the carrier side of their operations reaffirms the point. In short, the structure of the top telecom-internet and media companies reflects the economic structure of these industries where carriage, not content, is in the driver’s seat.
As telecom and internet gear makers like Cisco and Sandvine note, internet-based subscription television and online video services like Netflix and Youtube are increasingly driving the evolution and architecture of the internet and mobile wireless networks. Indeed, Netflix and Youtube alone accounted for half of all down-stream internet traffic in 2014. Netflix single-handedly accounted for a third of all downstream internet traffic in North America last year (p. 6). Another thing that stands out as the telecoms-internet companies plunge ever deeper into the television and other content-media industries, is their tendency to act more as editors than carriers, albeit not without significant push back from the CRTC.
Carriers or Editors, or Will Broadcasting Swallow the Internet?
The structure of the of the biggest players has begun to fundamentally shape their behaviour, as they increasingly act more like editors than carriers and push for a model that threatens to see the industrial era model of broadcasting swallow up the internet as we know it – at least if some of their views about the delivery of television and video over the internet as well as on principles of common carriage (i.e. old fashioned ‘net neutrality’) and dominant market power carry the day.
By 2014, just three companies – Shaw, Bell and Rogers – accounted for three quarters of all revenues across the television landscape. Add Telus into the mix, and the big four carriers accounted for just under four-fifths of all revenue across the television landscape: Shaw (28%), Bell (26%), Rogers (20%) and Telus (4%). While Telus is not a vertically-integrated broadcaster, it is increasingly acting like one, likely because of its deeper moves into the TV Delivery business through its Optik wireline and mobile TV services. In several important legal and regulatory proceedings over the past two years it has strongly expressed a desire to define these services as broadcasting and to ‘program’, ‘schedule’ and ‘edit’ them as it sees fit (see here, for example).
Figure 9, below, shows the three largest vertically-integrated carriers’ operations as a portion of the BDU and television markets as a whole, as well as the place of the other carriers in the English-language regions across the broad television landscape.
Figure 9: Vertically-Integrated BDUs and the Total Television Market by English-Language Market Share, 2014
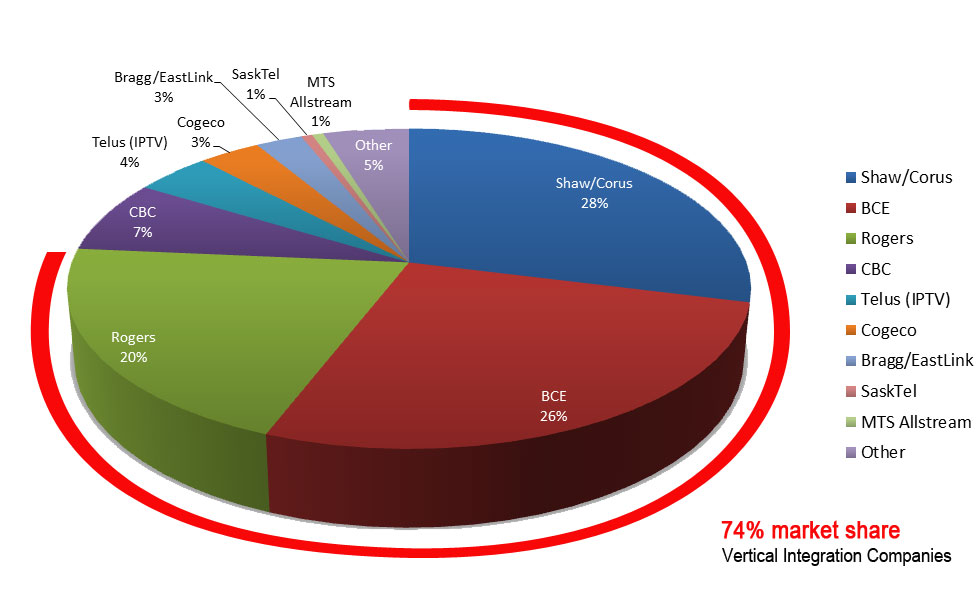
Source: see the “VI BDU + TV” data sheet in the English Media Market Excel Workbook.
These structural realities of the composition of the vertically-integrated carriers and of the telecoms-internet and media industries in Canada are leading to far-reaching efforts to redefine the internet in the image of broadcasting. Bell and Telus, in particular, claim that despite using the public internet to deliver video services to subscribers, those portions of the internet used for such purposes should be legally treated as broadcasting, but with the caveat that they get to draw the line between broadcasting and the internet wherever they see fit which, of course, means wherever is most advantageous to their own ends (see Bell’s factum to the Federal Court of Appeal its bid to over the CRTC’s ruling in the Mobile TV case, for instance, as well as the responses of the public interest advocates, Klass, Ellis and McKelvey, CNOC, the CRTC and Attorney General.
In the carriers’ view, common carriage and other allied bedrock principles such as no unjust discrimination are anachronistic hindrances that stand in the way of the companies’ ambitions to manage their networks as they desire. Indeed, in several ongoing cases – e.g. the Mobile TV case as well as Videotron’s Music Unlimited case, most notably – this is precisely what is at stake.
To accept this position, however, would basically transform the carriers into editors, and allow the industrial era model of broadcasting to swallow up the internet as we know it. It is an argument born of strategic positioning and the economic interests and structure of the companies, but it should be given a still-birth. So far this is exactly the reception it has been given by the CRTC, although the companies, true to form, are fighting tooth and nail to turn back the clock by flooding the courts with three appeals of CRTC rulings (see here, here and here) and by landing a bulky and rarely used Petition to Cabinet on the desk of the new Liberal Government before it had even been sworn in. In each, these issues are front and centre, but it is probably the Mobile TV case in which their essence is best distilled.
Ultimately, all of these cases and counter-machinations spring from the vertical integration of the carriers’ broadcast distribution operations, on the one hand, with their holdings in broadcast media, on the other, all of which sits uneasily alongside their operations in mobile wireless and internet access. As each of these areas of operation commingle across market boundaries and under the same over-arching corporate umbrella, carriage and content are becoming ever harder to disentangle from one another, and in this case the companies seek to bring about a legal regime that reflects the economic reality that they are both carriers and editors. The common carrier principle, in sharp contrast, draws a strict line between the two functions, and prevents the former from acting like the latter.
The Triumph of the “Integrated TV System” over the “Lego Land” view of Television?
While vertical integration now defines the mediascape within both the English- and French-language markets, it is still essential to focus on individual sectors, as the following paragraphs do, beginning with television.
The television landscape consists of at least three dimensions: broadcast TV, the specialty and pay channels delivered by BDUs, and the OTT sector exemplified by Netflix, shomi and, if we set aside the fact that it remains tied to an underlying BDU subscription, CraveTV (although this will end in 2016). Overall TV revenue in the mainly English-speaking regions of Canada rose rapidly from $4.1 billion in 2004 to an all-time high of $5.8 billion in 2012, but slipped to $5.7 billion in 2014.
The slippage is largely due to declining advertising revenue for broadcast TV and cuts to the CBC. Indeed, broadcast television revenues largely stagnated in the half-decade before the financial crisis (2008), fell the next year and after some fluctuation in the ensuing years, have fallen again in the past three years. In 2014, broadcast television advertising revenue fell to $2.1 billion — a drop of 10.5% since the all-time high of $2.3 billion five years earlier.
Overall, however, total TV advertising peaked in 2011 at $3.6 billion in 2011. It has basically stayed flat ever since.
The downward drift of revenue in broadcast TV in the past three years, however, has been compounded by significant cuts to the public service broadcaster, the CBC. The CBC’s English language TV budget was cut by $46.4 million in 2013 and another $52.4 million last year, for a total of just under $100 million cut over the past two years (see the CBC’s Annual Reports for 2012-2013, p. 61 and 2013-2014, p. 59 and the “CBC” worksheet in the English Media Market Workbook).
Pay and specialty services, in sharp contrast, have grown at a brisk pace. Their revenue soared from $2.4 billion in 2008 to $3.5 in 2014. It continued to grow even during the economic instability that has dogged the Canadian economy and many other sectors of the media since the ‘great financial crisis’ – reflecting the reality that pay-per media tend to be less susceptible to economic downturns than advertising supported ones (advertising revenue equaled about a third of specialty and pay TV revenues in 2014; subscriber fees for the rest). Stretch the time frame over the course of the past decade, and revenues for specialty and pay TV services have doubled.
If we throw estimated revenue for Netflix into the mix, the overall size of the TV market expanded to reach $5.93 billion last year. Netflix’ revenues were an estimated $268.2 million in 2014. In the past two years, Netflix revenue more than doubled (see the “Top 10 Ranking” sheet in the English Media Markets Workbook). The overall revenue across all three dimensions of the “Total TV” landscape are depicted in Table 8, below.
Table 8: Growth of Total TV Revenues, 2004-1014 (millions $)
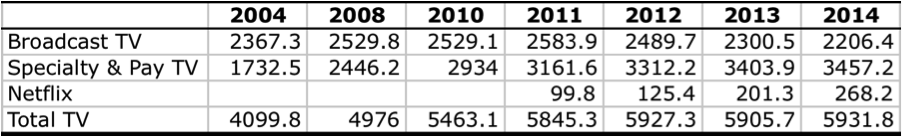
Source: see the “Broadcast TV”, “Specialty and Pay TV” and “Top 10 Ranking” data sheets in the Excel Workbook.
By the end of 2014, Netflix had an estimated 3.1 million subscribers in Canada, with about 91% of them living in the mainly English-speaking regions. Much adieu has been made of such facts in journalistic, industry and regulatory circles. However, over-and-against these public-facing statements, even Bell has struck a more upbeat tone when talking to investors. Thus, its 2013 Annual Report, Bell claimed that while services such as Netflix create new challenges, for the most part, “OTT services have largely complemented existing TV services” (p. 69). This is essentially the same as the CRTC’s conclusion three years earlier, and which it has shown little inclination to change since.
Beyond Netflix, the number of people who watch TV online has also increased considerably. Indeed, in 2014, 47% of Anglophones said they watched at least some TV online during the past month (CRTC, CMR, Table 4.3.7).
Canada’s television companies, the most of which are now fully integrated into the big four vertically integrated telecom and media giants – Bell, Shaw, Rogers and Quebecor – have generally been slow to respond to the rise of the internet, tip-toeing gingerly into the field. It was only in 2007-2008 that they began to offer sustained video offerings of their own (e.g. CBC.ca, CTV.ca, GlobalTV.com) and to offer programs through Apple’s iTunes store or on YouTube. Behind-the-scenes clips began to accompany scheduled fare by the end of the decade, but imported shows such as The O.C. (aired by CTV) were still more likely to use Facebook and YouTube pages than Canadian programs. Degrassi: The Next Generation (CTV), Star Académie (TVA) and independently produced Sanctuary were notable, but rare exceptions.
As quick points of contrast, Apple’s iTunes was expanded from its base in online music retailing into an internet television and movie downloading service in 2006, while the BBC launched its iPlayer in 2008 and the US cable companies set their TV Everywhere strategy in motion in 2009-2010.
The CBC, as has been the case with public service broadcasters in the UK, Europe and elsewhere have generally led the way in transforming themselves from public service broadcasters into public service media operations with sizeable internet-oriented activities, in the face of predictable opposition from commercial media interests and a surprising number of journalists in Canada ever since. However, commercial broadcasters have changed substantially in the past two- to three years with the launch of shomi (Rogers and Shaw), CraveTV (Bell), Rogers’ GamePlus and a few others within the English-language regions of Canada.
The Television Landscape: Growing Concentration and Greater Vertical Integration
The total English-language TV market – excluding the BDU side of things – needs to take account of a significant fact that has crystallized more clearly in the past few years: the extent to which just two firms – Bell and Shaw – have come to dominate the scene, with Rogers and the CBC falling further into their shadow with the passing of time and further consolidation.
In 2014, two companies — Bell and Shaw — controlled 59% of the total English-language TV market – after taking into account the divestitures that Bell was required to make by the Competition Bureau and the CRTC as a condition for approving the deal. Most of those divestitures went to Shaw. Prior to taking over Astral — the fifth largest TV company in English language markets — Bell single-handedly had 28% of the market; now it has 33%. Bell and Shaw’s combined market share took a sizable step forward as a result of the deal, climbing from 54% in 2012 to 59% last year.
The extent to which Bell and Shaw now stand at the commanding heights of English-language TV markets can be gleaned from a quick reprisal of their holdings. Thus, Shaw’s acquisition of Global TV and a slew of channels from bankrupt Canwest in 2010 gave Shaw/Corus a dozen conventional TV stations that comprise the Global TV network as well as broadcast stations in Oshawa, Peterborough and Kingston (Channel 12, CHEX TV and CKWS TV, respectively) (these were sold to Bell in 2015) and fifty-one pay and specialty channels – all but two of which are in English-language markets (Shaw and Corus Annual Reports). It’s share of total TV revenues in 2014? 30%.
Bell’s re-entry into the field after re-acquiring CTV in 2011 created behemoth that, at the time was equal to Shaw, with twenty-eight broadcast tv stations and thirty three specialty and pay tv stations. Its take-over, in a joint-venture with Rogers, of Maple Leaf Sports Entertainment (MLSE) and a roster of sports channels – NBA TV, LeafTV, GolTV, etc. – again with the blessing of both the Competition Bureau and CRTC’s — in 2012 only compounded the trend.
Bell’s acquisition of Astral two years later catapulted it into a league of its own, raising the number of broadcast TV stations it owned to thirty while the number of specialty and pay TV services it owned ballooned to forty, three-quarters of which are English language services. Bell’s one-third share of all TV revenue in 2014 ranked it as the largest TV provider in the English language regions of the country.
By comparison, CBC and Rogers are the distant third and fourth tv operators, with 15.8% and 13.2% share of total TV revenues – roughly half the scale of Bell and Shaw, respectively. The CBC had 5 specialty and pay TV services in 2014, while Rogers had fifteen – again, paling in comparison to either Bell or Shaw.
One wonders whether Rogers smaller commitment to vertical integration in is behind its willingness to oppose measures that would further that trend in the industry? Such as stance has been visible in its opposition to the Bell Astral transaction, it’s decision to basically fold its position in the Mobile TV decision rather than to fight a losing battle against the principles of common carriage at the heart of that decision, and its more supportive stance over the past half-decade with respect to regulating wholesale access to TV programming owned and controlled by the vertically-integrated companies through the regulator’s vertical integration and wholesale codes. In other words, this appears to be another instance in which behaviour follows form and economic incentives, and in this case, the telecoms-internet and media ecology in Canada is the better for it.
The comparison of these four companies – Bell and Shaw on the one hand, Rogers and CBC on the other — within just the pay and specialty tv domain is especially interesting because, first, this is one of the fastest growing areas of the media economy and, second, because Bell and Shaw’s respective stranglehold is greater here than in either broadcast TV or the TV market as a whole. In 2014, Bell was the biggest player in the pay and specialty channel domain with 33% market share, while Shaw followed close behind with 30%. Together, the two accounted for nearly 63% of all revenues. This looks more like a duopoly then either competition. Reference to the big four in this context wrongly lumps these two goliaths together with Rogers, the CBC or, for that matter, Quebecor. As indicated earlier in a different context, in this case, Bell and Shaw stand in a league of their own.
This is why, for instance, Rogers was not singing from the same hymn sheet as Bell in the Bell Astral hearings or the vertical integration hearings in 2011. Bell and Shaw, in contrast, sang koombaya together, trading horses essentially and supporting one anothers’ causes, as everybody else increasingly became beholden to them for access to TV program fit for both the traditional screen and the evermore internet- and mobile wireless-centric TV universe.
In short, the TV marketplace is bifurcating into a multi-tiered system, with Bell and Shaw at the apex, followed far behind by two mid-size players, Rogers and the CBC, and a smattering of small entities scattered across the rest of the dial: APTN, Blue Ant, CHEK TV, Pelmorex, Fairchild, and so forth. Together, though, the collective scale of these small players is less than half the place formerly occupied by Astral in the English-language TV market.
As a thought experiment, we can expand the lens to bring Netflix into the scene. Once we do, the picture changes in some interesting ways. For one, Netflix would be the fifth largest player in the English-language TV market, with a market share of about 4.5% after expanding the size of the pie to include its estimated revenues. This is close to Astral’s 5.5% market share on the eve of its take-over. The diversity of the market would rise modestly, while Bell and Shaw’s shares, respectively, would also slip by a similarly modest amount.
Yet, even then, the market would still be highly concentrated on the basis of the CR4, and moderately so by the measure of the HHI. Yet, taking things as they are, the wave of consolidation blessed by the Competition Bureau and the CRTC stand as testaments to diversity denied, with high concentration levels prevailing at each level of the TV marketplace, with very substantial rises taking place, first, since 2008 and then again from 2012 onwards.
In 2008, for instance, the CR4 for total TV was 77%, but by 2014 it had leaped ahead to 88%. The HHI similarly jumped from 1771 in 2008 to 2177 last year.
Figures 10 and 11, below, chart the trends over time for each segment of the TV market – broadcast, specialty and pay, and total TV – while also peering ahead to show the trends with respect to radio, newspapers and magazines, the final sectors covered in this report.
Figure 10: CR Scores for Content Media in the English-language Media Economy, 2000-2014
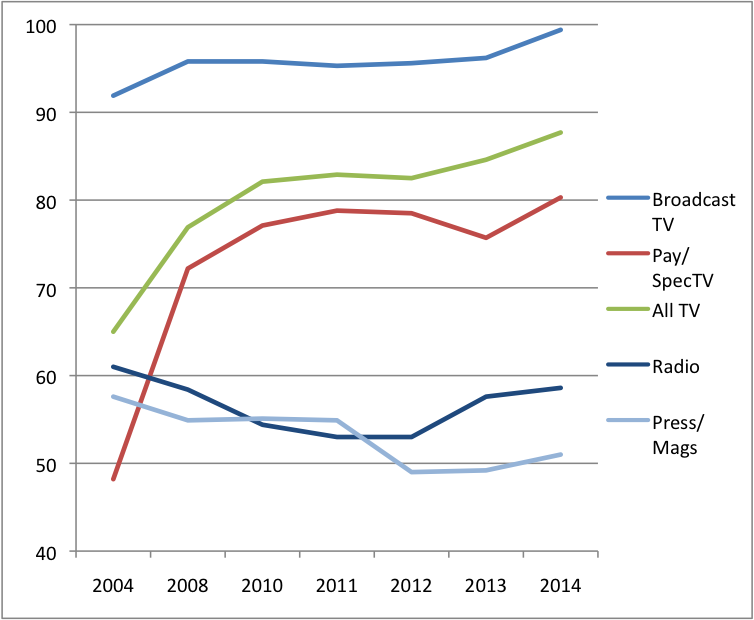
Sources: see the “Broadcast TV”, “Specialty and Pay TV” and “English Network Media Economy” data sheets in the English Media Market Excel Workbook.
Figure 11: HHI Scores for Content Media in the English-language Media Economy, 2000-2014
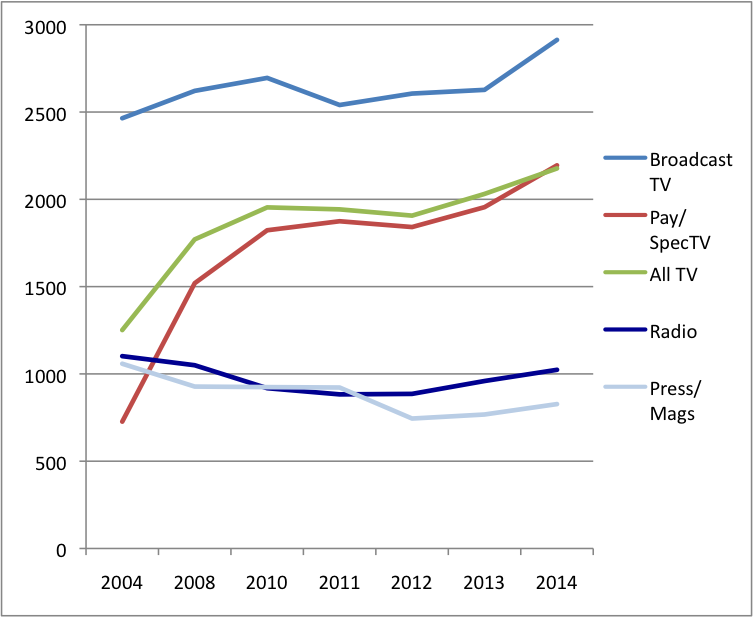
Sources: see the “Broadcast TV”, “Specialty and Pay TV” and “English Network Media Economy” data sheets in the English Media Market Excel Workbook.
Radio: Resilient as Ever or On the Ropes?
Radio continues to constitute an important medium and one that actually grew significantly between 2000 and 2011, with revenues rising from $1070 million to $1,577.6 million. However, revenues have largely stagnated since the financial crisis of 2008 and in the face of the unsteady economic conditions that have ensued ever since. In 2008, total revenue for radio in the English-language market was $1,526.3 million; in 2014 it had slipped to $1,489.6.
While the general trend is one in which revenues have remained steady, or flat, since 2008, the general trend also masks important details. For one, advertising revenue fell in the year immediately after the onset of the financial crisis, once again revealing the sensitivity of advertising to conditions in the economy as a whole. However, they have risen steadily since and in 2014 they were $1,589 million. This was pretty much exactly the same as they had been in 2008: $1,558 million (TVB 2015).
On the other hand, cut-backs to CBC radio have offset a large part of the gains made with respect to advertising revenues. Its budget for the English-language service has been clipped by $24.6 million since 2011, or about 13%. The longer-term trend is even worse, with estimated $60 million in its annual Parliamentary appropriation – a quarter of its budget – axed (see CBC funding and revenue sheet here).
In sum, radio is more resilient than many see to think. The majority of its economic woes are the result of a hostile government rather than a steep fall off in either advertising revenue (for the private sector) or audiences. The state of affairs in Canada also mirrors trends worldwide, where advertising revenues have generally grown slowly but steadily – or at least stayed stable — in the past few years, while countries with stronger traditions of public service media have seen governments either hold the line on public funding or pare them back more sparingly.
As has been the case at each other level of analysis, radio stands out as a clear contrast to trends in TV and in the platform media industries. The CR4 has been at the low end of the concentration spectrum and trending downwards throughout the 21st century. Indeed, in 2012, the “big four” accounted for just under 52% of the market — Astral (14.2%), Rogers (14.1%), CBC (12%) and Shaw (Corus) (11.4%) – and the HHI score was very low and well into the competitive and diverse range at 885.6 (see the “Radio” sheet in the English Media Market Workbook).
While the HHI score remains low, it has shot upwards and the downward trend has reversed since Bell’s acquisition of Astral, then the largest radio broadcaster in the country, and in English language markets in particular. After the deal, Bell doubled its market share from 10% to 20%, and catapulted from its fifth place rank to first. Still, however, relative to the rest of the media, radio will remain relatively diverse.
Newspapers and Magazines: No End of Misery in Sight
The last comments for this post are for the newspaper and magazine sectors which I treat together here, in contrast to separately in the Canada-wide analysis and hardly at all in the French-language media markets, mostly because of limits in the available data. Combining the two enlarges the size of the ‘relevant market’ and, consequently, diminishes the scale of specific players within either of these markets, nonetheless the analysis is still instructive (see the “Press+Mags” sheet in the English Media Markets Workbook).
The analysis shows several things. First, concentration levels are not high and have been falling for most of the past decade regardless of the measure used, either the CR4 or the HHI. Second, to the extent that we can speak of the “big four” press and magazine publishers, they are: Torstar (19%), Postmedia (15%), Quebecor (11%) and the Globe and Mail (5.5%).
To be sure, while concentration levels are not sky high, the fact that just four entities account for just over half of the market does tip this domain over into the concentrated market zone by the sights of the CR4 measure, although by the lights of the more sensitive HHI, the industry is not concentrated at all. In 2014, the newspaper and magazine sectors combined had a CR4 of 51% and an HHI of 827
At the same time, however, this needs to be set against two other realities: first, both industries have fallen on hard times, newspapers more so than magazines, and as the big players stumble, they are losing market share and, in some cases, they are being broken up, with significant divestitures leading to the emergence of a stronger second tier of newspaper publishers: e.g. Transcontinental, Glacier and Black Press, notably.
English-language newspaper and magazine revenues appear to have peaked in 2008, and have plunged since, from $6.3 billion to $4.5 billion last year – a drop of 28%. Worse, there appears to be no end in sight.
One crucial thing, however, distinguishes English-language dailies from their French counterparts: paywalls. Just two out of ten French-language dailies – Quebecor’s Le Journal de Montréal and Le Journal de Québec – that account for roughly thirty percent of the average daily circulation have paywalls that restrict their readership to paid subscribers only (albeit with a soft cap that allows several free articles per month). For the English-language daily press, in contrast, there are twenty-eight dailies accounting for half of average daily circulation behind paywalls (also see here).
Compared to the French-language counterparts, the embrace of paywalls has been faster and more all-encompassing amongst the English-language dailies. All of the major ownership groups have put such measures into place in the last three years.
Glacier Media and Brunswick News (Irvings) led the charge in 2011, and were joined by Postmedia as it erected pays walls across its dailies in stages over a two-year period between May 2011 and May 2013. Quebecor put up paywalls across the Sun group of English-language dailies in late 2012, with the Globe and Mail (October 2012) and Toronto Star (August 2013) following suit shortly thereafter. Two more mid-size, regional newspaper publishers, Transcontinental and Halifax News, joined ranks in the last half of 2013.
By the end of 2013, all of the English-language daily newspapers had paywalls in place. Unlike the role played by Power Corporation’s La Presse group of papers in Quebec, when it comes to paywalls, there were no holdouts amongst the English-language dailies at year’s end. The Toronto Star, however, has since broken ranks, dropping its paywall in late 2015 in favour of online and mobile versions of its papers developed along the lines charted by La Presse.
While it is hard to pinpoint the source of these differences, two potential explanations stand out. First, and as indicated at the outset of this report, spending per capita in Quebec on media is less than in the English-speaking regions of the country. As such, it is possible that paywalls are simply a harder sell in Quebec compared to the rest of Canada.
Another explanation, however, stems from the much more prominent role-played by Radio Canada/CBC in the French-language media ecology. As the largest player in the French-language broadcast market, both television and radio, it accounts for roughly one-third of all revenues, and has carved out a very large place for the public service model of news in the centre of the French-media ecology. In English-speaking areas, in contrast, the CBC ranks lower along side commercial rivals and has less than half the market share of its French-language counterpart (15%). Consequently, with the public media model occupying a much larger space in French-language markets it is correspondingly easier to create a bigger role for the commercial model of the news (see Picard and Toughill).
Concluding Thoughts
As I have noted in previous posts, studying the media industries and their evolution over time is not easy. It also becomes more difficult the closer one looks because so much data needed is not available. However, based on what we do know and some reasonable estimates, we can arrive at a pretty detailed and reasonable portrait of the English-language network media economy.
First of all, we can summarize the general results by sorting different sectors of the network media economy into those that rank low, moderate or high on the concentration scale according to the HHI. Figure 12 below does just that.
Figure 12: Concentration Rankings on the Basis of HHI Scores, 2014
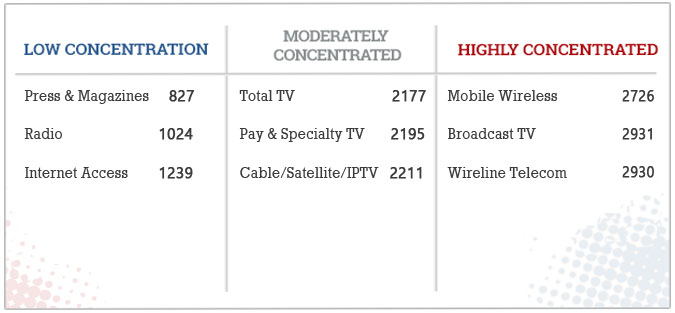
Source: see the “CR+HHI” data sheet in the English Media Market Excel Workbook.
Over and above just giving a snapshot of where things stood as of 2014, we can distill the key trends and developments over time. In this regard, several things stand out.
- the English-language media economy has grown greatly since 2000, but the course of development has been uneven and in some instances interrupted by economic instability since 2008.
- the platform media industries have grown much faster than the content media industries; the platform media industries are much larger than the content media industries, accounting for three-quarters of all revenues in 2014. They are the nucleus of an ever more internet- and mobile-centric media world. In this setting, while “Content may be King”, the reality is that “Carriage is Emperor”.
- the impact of the economic downturn since 2008 has hit the content-media industries much harder than the platform media industries. As a general rule, media that depend more on advertising suffer more during economic hard-times. These woes have particularly harsh on newspapers, magazines, radio and broadcast TV, but deep budget cuts at the CBC have played their part, as has the relatively rapid rise of Google and Facebook as significant rivals for advertising dollars.
- Google and Facebook ranked as the 5th and 14th largest media companies in the English-speaking media markets in Canada, respectively, last year. Bell was number one – by far — with over a quarter of all revenues, followed by Rogers, Telus and Shaw.
- the mobile wireless (cellphone) sector has been one of the fastest growing sectors since the turn-of-the-21st century, but it is also one of the most highly concentrated. The “big three” — Rogers, Telus and Bell – still dominated the English-language markets in 2014, with a combined 90% share of wireless revenues. New entrants are a welcome force, but two have failed in the past two years (Public and Mobilicity) and Wind Mobile’s market share is modest, with 800,000 subscribers and about 1.5% market share
- Drill down deeper to the provincial level, and the reality just described is even more pronounced except for in Quebec (see next report), where ranging from 92-96% from Ontario to British Columbia.
- high levels of concentration persist across most platform media industries, except internet access when measured across the mainly Anglo-speaking regions of Canada as a whole. Look closer, however, and it too is highly concentrated on the basis of both the CR4 and HHI measures.
- The biggest players derive the lion’s share of their revenues from their ownership and control of communications infrastructure not content. This is fundamentally shaping their behaviour, as they increasingly act more like editors than carriers and push for a model in which the industrial era model of broadcasting will swallow the internet as we know it — if they get their way.
- the top three vertically-integrated players in the TV marketplace – Shaw (28%), Bell (26%) and Rogers (20%) — accounted for three-quarters of all revenue last year. Include Telus, and the “big four” control close to four-fifths of the market.
- Cable television business revenue soared from $3.3 billion at the turn-of-the-21st century to $7.01 billion last year. By 2014, one-in-five households (20%) in the Anglo-speaking regions of the country obtained TV service from Telus, Sasktel or MTS or Bell – a figure that is high relative to Canada as a whole (15%) and by international standards. There is no cord-cutting epidemic that is killing the business.
- This has lent to a sense of being under siege amongst the biggest cable and satellite companies such as Rogers, Shaw and Cogeco, and for good reason since their revenues have plummeted by 10% since 2011. Concentration, however, is still at the upper bounds of the ‘moderately concentrated’ range by the HHI measures and in the high end of the zone using the CR4. Local and regional duopolies prevail in cities across the Anglo-speaking areas of the country, and the top four companies accounted for 88% of revenues last year.
- an emerging duopoly is also taking shape within the English-language TV landscape, where Bell and Shaw currently account for 63% of revenues in the specialty and pay TV universe. The CBC and Rogers lag far behind. The “Total TV” marketplace is very highly concentrated, with a giant step in that direction having taken place in two phases since 2008.
- smaller players such as APTN, Blue Ant, CHEK TV, Pelmorex, Fairchild, and so forth exist but collectively their share of the market is less than half that of Astral in the English-language TV market before it was taken over by Bell in 2013.
- Netflix had estimated revenues of $268.2 million in 2014, and 2.8 million subscribers in the Anglo-speaking areas of Canada. Netflix is the fifth largest player in the English-language TV market.
- English-language newspaper and magazine revenues peaked in 2008, and have plunged since, from $6.3 billion to $4.5 billion last year. Concentration levels are not high and have been falling for most of the past decade.
- English-language dailies are distinguished from their French counterparts by their extensive use of paywalls. Whereas two out of ten French-language dailies – Le Journal de Montréal and Le Journal de Québec – that account for thirty percent of average daily circulation had paywalls in 20145, twenty-eight dailies accounted for half of average daily circulation were behind pay walls at the time in the Anglophone areas of the country.
- as a result of these trends, regulatory battles over access to the three core resources of the media economy – carriage, content, audience attention – are on a high boil and central to a number of important and recent rulings by the CRTC, three of which Bell is seeking to overturn through appeals to the courts and another by way of a rarely used Petition to Cabinet that landed on the incoming Liberal Government’s desk before it was even sworn into office.
- Some call this the ‘battle over the institutional ecology’ of the information age (Benkler), and in Canada that battle for the future is in full swing.
[1] Thanks to Dr. Catherine Middleton, Ryerson University, for the tips with respect to the first three of these sources.