Growth and Upheaval in the Network Media Economy in Canada, 1984-2020
Recommended citation: Winseck, Dwayne, 2021, “Growth and Upheaval in the Network Media Economy, 1984-2020”, https://doi.org/10.22215/gmicp/2021.1. Global Media and Internet Concentration Project, Carleton University.
Contents
Summary of key findings and insights
The Network Media Economy in Canada: Contemporary Trends and Ongoing Policy Debates
The Telecoms and Internet Infrastructure Sectors: Bandwidth is King, Not Content
From Plain Old Telephone Service to Broadband Internet Access and Internet Protocol TV
Broadband Policy, Politics and Public Interests: One Step Forward, Two Steps Back?
As Internet Advertising Soars, Total Advertising Spending Slumps
The Rumoured Death of Television is Much Exaggerated
Pay and Specialty (Subscription) TV
Online Subscription and Download Audiovisual Media Services (AVMS)
The Total Television Landscape in Perspective
Remaking the Music Industry: From Ruin to Recovery
Newspapers and Magazine Publishers in Peril
ANALYSIS – Some Reflections on Journalism, Public Subsidies and Public Goods
Some Concluding Observations on the Political Economy and Power of Communication and Culture Policy
This is the tenth edition of Canadian Media Concentration Research Project’s first report in our annual two-part series on the state of the telecoms, Internet, and media industries in Canada (previous versions can be found here). It examines the development of the media economy in Canada over the past thirty-six years.
Since beginning this project a decade ago, we have focused on analyzing a comprehensive as possible selection of the biggest telecoms, Internet and media industries (based on revenue) in Canada, including: mobile wireless and wireline telecoms; Internet access; cable, satellite & IPTV; broadcast television, specialty and pay television services as well as Internet-based video subscription and download services; radio; newspapers; magazines; music; Internet advertising; social media; operating systems; browsers, etc.
In recent years, we have made some fairly dramatic changes in order to capture a broader range of audiovisual media services that are delivered over the Internet beyond online video subscription and download services and Internet advertising. The new sectors brought into our analysis since then include:
- Online gaming, gaming applications, game downloads or in-game purchases (Digital Games);
- App stores, in particular Google Play and Apple Appstore;
- Music downloads and streaming music subscriptions.
We classify these sectors as the digital audiovisual media services, or digital AVM services for short, a category that includes online video subscription and download services such as Netflix, Crave, Amazon Prime Video, Disney+, Club illico, CBC Gem, Apple iTunes and Google Youtube Premium and Youtube TV. We also distinguish these online video services from their legacy counterparts (e.g. broadcast TV, specialty and pay TV, radio, music, newspapers, and magazines) that do not rely on Internet aggregation and distribution as a core part of their business models.
Figure 1 below depicts the segments of the digital and traditional media industries that collectively comprise what we call the network media economy.
Figure I: The Network Media Economy in Canada—What the CMCR Project Covers
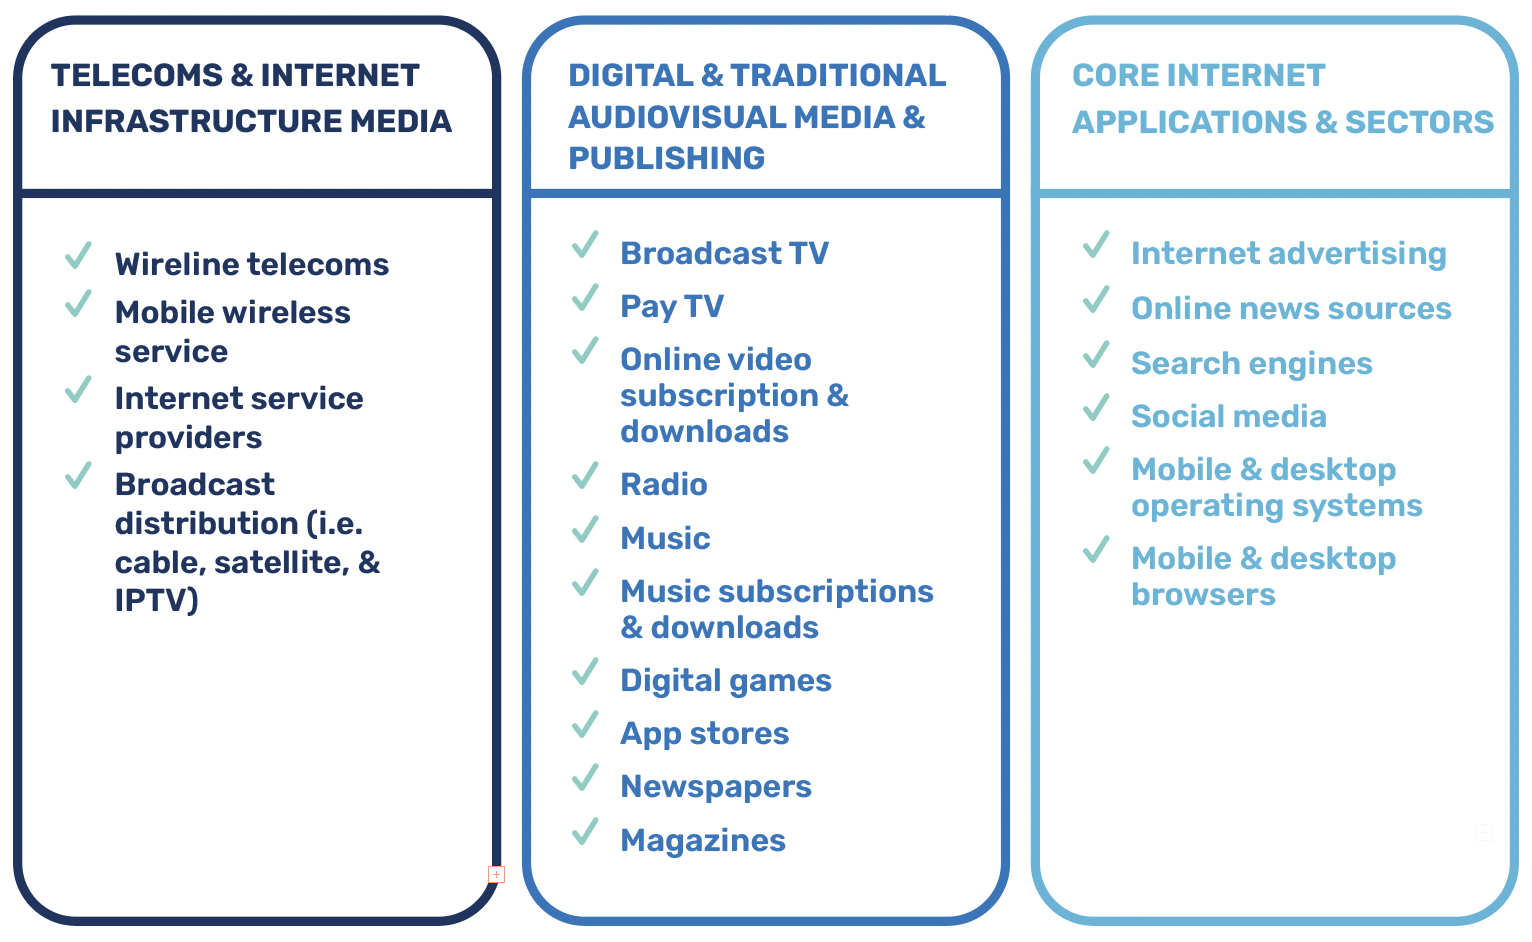
The research method that we use is simple: we begin by examining the individual components of the network media economy (i.e. the sectors indicated in Figure 1 above). This involves collecting, organizing, and publishing stand-alone data for each media industry individually. We then group related, comparable industry sectors into three more general categories: the “telecoms and Internet infrastructure media”, the “digital and traditional AVMS” and finally, “core Internet applications and sectors”. Ultimately, we combine them all together to get a bird’s-eye view of the network media economy, taking care to explain how the sectors interact with one another and fit together to form the network media economy as a whole. We call this the scaffolding approach.
Following this approach ensures that we start with a clear, precise definition of “the media” so that readers know what is included in our analysis and what is not. It also helps to ensure that apples-to-apples comparisons are being made with other studies and research reports, both within Canada and internationally. Too often, debates in this area proceed without such an explicit definition. Consequently, some researchers cast a conceptual net so wide that the defining details of specific media are difficult to discern in their analysis, while others cherry pick sections of the media that support whatever story they want to tell. The problems that this raises for public discussion and public policy formation with respect to the communications, Internet and media are enormous, especially now when these debates are on a high boil, in Canada and around the world. We will discuss the nature of those problems at length in this and the next report.
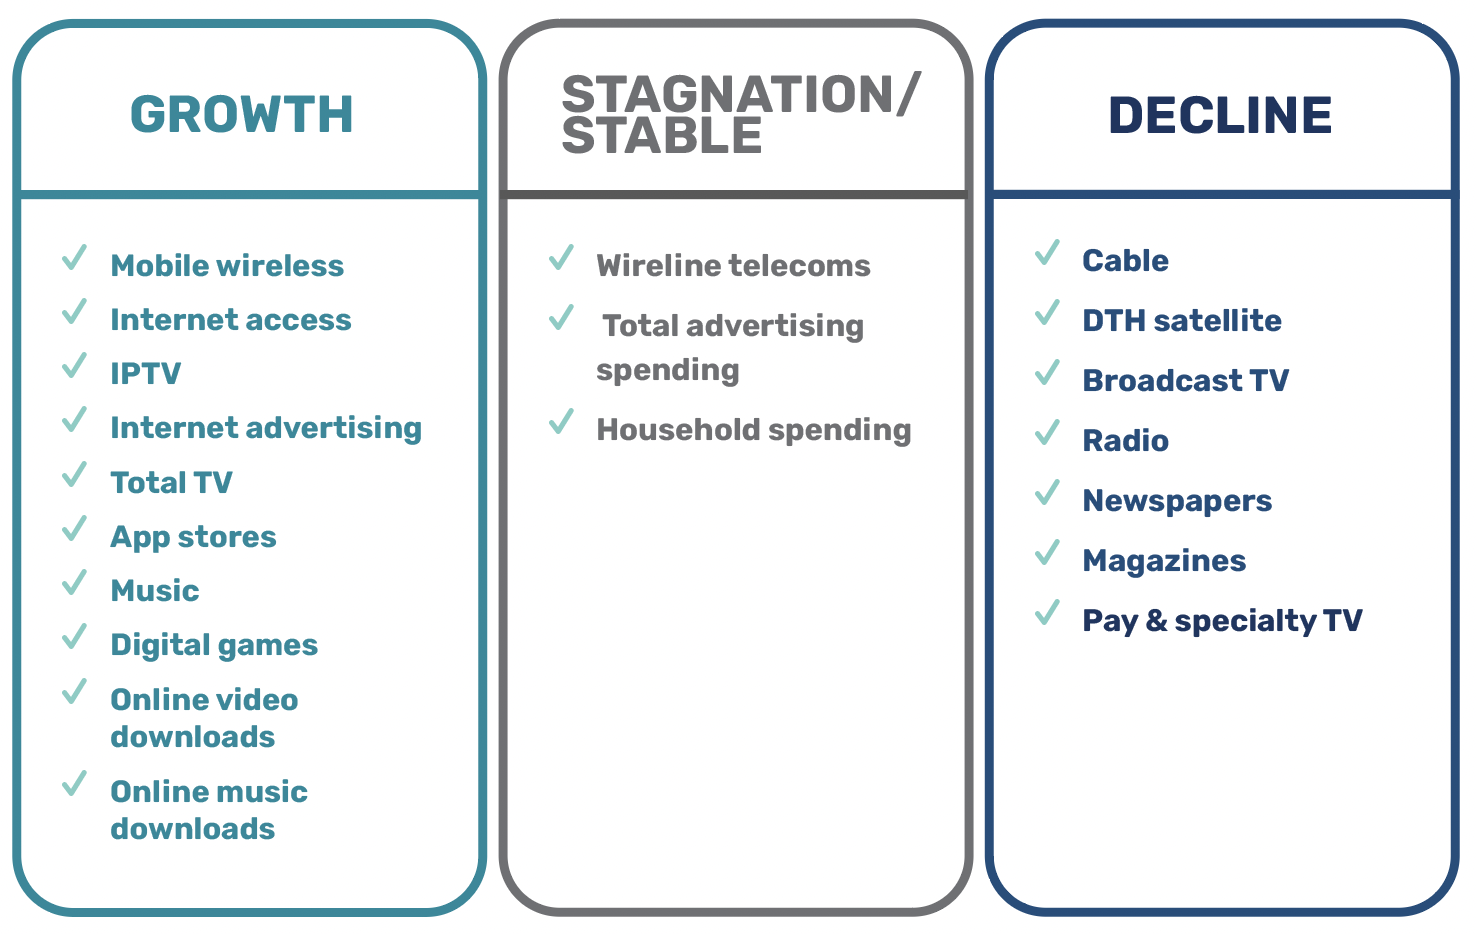
The scaffolding approach not only allows us to focus on the details and relative scale of the various individual segments of the network media economy, but it helps to see how they all fit together. In concrete terms, this allows us to see how major domestic actors stack up when measured against the activities of global players within the Canadian context. Lastly, this approach reveals which of these industries are growing, which are stagnating, which are in decline, and which appear to be recovering after years of misery. Table 1, below, offers a high-level snapshot of where things stood at the end of 2020.
Table I: The Growth, Stagnation and Decline of Media within the Network Media Economy, 2020
Beyond the overall direction of developments within specific sectors over the past year, the report identifies several major ongoing developments in Canada’s network media economy:
- Last year, the growth of the network media economy stalled in the face of the Covid-19 pandemic, with overall revenue slipping as a result. The longer run story, however, is one of growth, upheaval and increased complexity. While several sectors of the media that have historically relied predominantly on advertising funding as a core part of their business appear to be in terminal decline—i.e. broadcast television and radio, newspapers and magazines—there is no general crisis of the media in Canada.
- Despite a continued focus on advertising revenue in much communication and media scholarship, public debates and policy circles, the fact of the matter is that revenue from subscriber fees and direct purchases are at the centre of the media economy. Indeed, revenue from subscriber fees and direct purchases outstrip advertising revenue by a nearly 5 to 1 ratio. It is also critically important to note that the total scope of advertising spend for all media has been relatively fixed over time, and actually fell or stagnated for much of the last decade in inflation adjusted terms, on a per capita basis and relative to the size of the overall economy. At the same time, advertising revenue continues to shift to Internet behemoths such as Google and Facebook. Consequently, there are four sectors of the media dependent on advertising—and the firms that operate in these sectors—are battling the world’s largest Internet companies to retain a share of the relatively stagnant pool of advertising dollars.
- Contrary to narratives overly focused on broadcast television, Canada’s audiovisual media services market has continued to grow swiftly over the years, and the pandemic gave this an added boost as services like Netflix, Amazon Prime Video, Crave, Disney+ and Rogers SN Now grew even faster than they had been. This offset flagging fortunes in other segments of the TV landscape.
- The story is even stronger for investment in Canada’s film and television production sector, which has nearly doubled in the past decade. Although initially being hit hard by the collapse of production as Covid-19 public health restrictions kicked in early in 2020, over the last half of the year production returned to levels that fell just shy of the record high in the year prior.
- Rather than looking to historical approaches to broadcasting regulation, governments should heed experiences in communications regulation and antitrust to inform their policy responses to the network media challenges of today. These approaches take seriously the need for structural and conduct-based regulation of platforms, and potentially extend their public obligations to a wide range of issues central to the digital economy.
Ultimately, our goal is also to bring a wealth of historically- and theoretically-informed empirical evidence to bear on contentious claims about the media industries. Within a context where the role of policy and regulators looms large, knowing both the details and the broad sweep of the network media economy allows us to make informed contributions to the debate from an independent standpoint. This is essential given the ongoing Parliamentary and policy responses to recently concluded reviews of, for example, the Telecommunications and Broadcasting Acts, Copyright Modernization Act and the Personal Information Protection and Electronic Documents Act (PIPEDA) as well as initiatives now on the table with respect to the reform of the Broadcasting Act, news compensation and online harms.
This informed and independent view is also a key input to what could be considered the preeminent debate in this area of policy, the role of digital giants in the future of Canadian and global media markets. In fact, the tide has turned dramatically in the past few years to give rise to fundamental questions about whether the very business models and extraordinary market power of Internet giants such as Facebook and Google are inherently primed for nefarious possibilities, regardless of their owners’ best intentions to connect the world, are now on the table like never before. Consequently, in the last four to five years alone, there have been over one hundred public policy and/or regulatory examinations of the digital platforms worldwide, as governments from India and Australia to the European Union, the United States and Canada all grapple with the far-reaching implications of these new actors and their impacts on journalism, the media, economy and society (Winseck & Puppis, nd).1
Questions are also being raised about whether these entities have become too big to effectively govern—either through self-regulation or by existing democratic institutions. As a general principle, unless the rules shaping such companies’ conduct are guided by properly constituted legal and democratic oversight by parliaments, the courts, or administrative agencies—as was the case for the changes to the Canada Elections Act in late 2018—demands for the digital platforms to better govern themselves could make their “black box” character even more opaque than they already are. That Amazon, Facebook or Google could be broken up just like AT&T was in 1984 is no longer a far-fetched idea. In fact, such remedies are actively being considered in the US, UK, EU and Australia.2
We are fully supportive of concerns regarding the scale of these companies, their clout, and the threats that they pose to the Internet, some media, society and democracy. We are also fully supportive of the idea that new Internet regulations are needed for precisely these reasons. The issue is no longer if the platforms and Internet content will be regulated but when and how they will.3 Now even Facebook’s CEO, Mark Zuckerberg agrees that this is so and frequently reminds us that he has “repeatedly called for regulation . . . because I don’t think companies should be making so many of these decisions ourselves”.4
However, our analysis also suggests that claims that the Internet hypergiants’ fortunes are being made by cannibalizing the revenue that journalism and the music, movie, television and publishing industries need to survive should be met with a healthy dose of skepticism.5 There is also a need to be vigilant that the push for new Internet regulations does not just translate into harnessing the Internet-centric communications and media arrangements of today to protecting approaches to broadcasting regulation and cultural policy of the past. There is also ample reason for concern that the tough structural and conduct regulatory remedies needed to counteract problems of consolidation at every level of the communications, Internet and media ecosystem are being side-stepped by a one-dimensional focus on the global Internet giants. So, too, must the unlimited personal data harvesting models that fuel the commercial Internet services, and which are proving to be so corrosive of people’s trust, social relationships and democracy, be thoroughly addressed across the board and not just for the global Internet giants. Furthermore, all this needs to be done while avoiding the extreme tendency visible today directly regulate Internet content in a misguided gambit to solve all of society’s perceived ills by cleaning up so-called “harmful content” online.
To help understand this tangled knot of issues we need to better appraise where the Internet giants currently stand within Canada. And in so doing, our first question should be, these entities loom large, but how large and how do we know the answers to seemingly such simple but, in reality, very difficult questions?
Our data show that the US-based Internet giants are consolidating their dominance of digital advertising markets in Canada and becoming increasingly dominant across the advertising landscape as a whole. Indeed, the shift to the “mobile Internet” has helped Google and Facebook, in particular, to consolidate their lock on both online advertising and, increasingly, advertising spending across all media, as we will show later in this report. In addition, as the global Internet giants increasingly aggregate and distribute media and cultural content, existing media groups are becoming more platform-dependent, potentially jeopardizing their own economic, technological and cultural autonomy for uncertain benefits.6 All of this is critical to comprehending the bleak place in which many advertising-based media now stand.
However, while the growing clout of Internet hypergiants such as Google and Facebook is unmistakeable, it is a mistake to generalize from the digital duopoly’s dominance of the Internet advertising market to the $90 billion network media economy writ large. Treating developments in the advertising-based sectors as representative of the overall direction of the industry obscures the reality that these sectors constitute a small and receding aspect of the network media economy as a whole. Moreover, while the influence of the big five digital platforms—i.e. Google, Amazon, Facebook, Apple and Microsoft, aka GAFAM—and Netflix is significant, within countries (Canada in particular) they are still outstripped by a large margin by the biggest national telecommunications and media groups, as this and the next report in this series will show.
Ultimately, the media’s place in the economy, society and our everyday lives is changing dramatically and is currently up for grabs in ways seldom seen. Some communication historians call times like these a “critical juncture” (McChesney), or a “constitutive moment” (Starr), when decisions made will become embedded in technology, markets and institutions, and then press down on us, for perhaps a century or more if the lessons of “the industrial media age” offer any guide to the contemporary debates surrounding the “Internet” or “digital media age”. The CMCR Project does its best to engage with such realities in a bid to help secure the communication and media that we need and deserve.
- Last year, in the face of the Covid-19 pandemic, revenue across the network media economy stayed roughly the same as a year earlier, i.e. $90 billion. While online video and music services, digital games and online advertising (i.e. digital media sectors) as well as Internet access services continued to grow, all other sectors of the media economy suffered setbacks last year, some very substantial.
- Last year’s setback, however, appears to have only been temporary, with most sectors bouncing back since. Over the long run, the media economy has more than quadrupled in size.
- Even mobile wireless services stumbled for the very first time, as estimated revenue slid from $29.2 billion to $28.1 billion, last year. This loss was due in part to Covid, because lucrative international roaming charges disappeared as travel across borders ground to halt. In addition, however, ongoing albeit modest improvements in competition in many provinces have also put steady downward pressure on mobile data prices and overage charges.
- Internet access services continued to grow briskly, as revenues rose by a billion dollars to $13.9 year-over-year. This underscored the importance of broadband access as people increasing turned to the Internet for work, to go to school, obtain government services and socialize with others.
- Revenue for cable, IPTV and satellite TV declined from $8.3 billion to $8.1 billion over the year and household subscriber levels fell just below 70% last year—a significant drop from the year before, when 73.6% of Canadian households had one such subscription.
- In contrast, however, revenue for digital audiovisual media services (AVMS)—online video, music, gaming and app stores—continued to soar last year to over $5.4 billion. So, too, did revenue for Internet advertising, which rose from $8.8 billion to $9.7 billion over the year. Add all the digital AVM sectors together, and total revenue reached $15.1 billion, up from $13.1 billion a year earlier. These sectors are now defining features of the network media economy and accounted for nearly 1/5th of all revenue (17%) in 2020. These sectors also seemed to be “pandemic proof”.
- As a result of these developments, global actors like Google, Amazon, Facebook, Apple and Netflix (the so-called GAFAM+ group of Internet giants) have become significant figures on the media landscape in Canada. Combined, they had an estimated $10.9 billion in revenue last year from their Canadian operations, up from $9.4 billion the previous year.
- While GAFAM+ group’s combined market share was 12% last year, it is essential to bear in mind that the “big 5” domestic companies in Canada still accounted for 70% of the network media economy last year: Bell, Telus, Rogers, Shaw (Corus) and Quebecor.
- Total advertising spending across the media economy dropped 300 million dollars last year, from $15.5 billion in 2019. Four advertising-dependent media sectors are in crisis on account of the long-term stagnation and, on some measures, decline in advertising revenue: broadcast television, radio, newspapers and magazines. Collectively, they have lost close to $6 billion since 2008 and their combined revenue now is half what it was then. It is fashionable to blame Google and Facebook’s for this state-of-affairs, but such charges are too simplistic, for reasons we show in this report.
- There is no generalized media crisis. Most media sectors are vibrant and thriving. This applies to the digital AVM services sectors and, specifically, to the TV marketplace overall, with the addition new pay TV sectors over time, including online video services, driving total TV revenues (i.e. broadcast TV, pay & specialty TV and online video) to $9.6 billion in 2020.
- Netflix had 7.2 million subscribers (just under one-half of all households in Canada) and $1.1 billion in revenue last year. Estimated revenue for online video services reached $3.2 billion last year—a nearly twenty percent rise over the previous year but a growth rate that now appears to be slowing relative to past trends.
- Film and TV production was slammed by the onset of Covid-19 public health restrictions in the first half of the year, but recovered thereafter with $9.3 billion in investment in 2020—just shy of the all-time record a year earlier.
- Newspapers are in turmoil with revenue plunging from a high of $4.9 billion in 2008 to $1.9 billion last year and the number of full-time journalists dropping from 13,000 in 2013 to 10,500 last year. These dismal trends continued unabated even as news organizations took advantage of subsidies from the federal government’s $595 million (over five years) Journalism Support Program and as the Canada Emergency Wage Subsidy program also offered some relief during the pandemic. While independent journalism continues to flounder, the ranks of public relations, advertising and marketing professionals have swelled enormously; by 2020, they outnumbered journalists 14:1.
- The story is not entirely bleak, however, with some new news, information and public commentary sources filling in some of the gaps created by the collapse of traditional journalism, e.g. National Observer, Canadaland, The Tyee, etc.
Our 2020 annual series of reports on the state of the telecoms, Internet and media industries in Canada marks a decade since we began this effort. The first report in our annual, two-part series examines the development of the media economy since 1984, with the “media” defined broadly to include data for twenty different sectors grouped into three categories, as depicted in Figure 1 below:
Figure 1: Key Sectors of the Network Media Economy in Canada, 2020
Ultimately, we combine all of these separate sectors together to get a bird’s-eye view of the network media economy. We call this the scaffolding approach. The aim of this approach—and this report—is to get the best sense we can of how all the different sectors of the telecoms-Internet and media industries have developed over time, to understand the scale and pace of the changes that are taking place, and to see how all of the sectors that we cover fit together to form “the network media economy”.
To this end, our approach begins by assembling a multisectoral body of data for the telecoms and Internet access, audio-visual media services and core Internet applications listed in Figure 1 above that collectively comprise “the network media economy”. The objective is also to determine which of these media sectors are growing, stagnating or in decline, while also highlighting those that have discovered renewed paths to growth, such as the music industry. To this end, the report pays close attention to, for instance, whether online audiovisual media services such as Netflix, Amazon Prime Video and Crave, and online gaming, apps and app stores (digital games), are cannibalizing established media or helping to expand the size and diversity of the media economy. Other trends such as cord-cutting and cord-shaving are also examined.
Since the early 1980s when our coverage for this report starts, the rise of entirely new media sectors–e.g. mobile wireless, Internet access, pay and specialty TV, digital AVMS, and so forth—has added immensely to the size and complexity of the media economy. Over this period, total revenue for the network media economy in Canada more than quadrupled from $19.4 billion in 1984 to $90 billion last year. That said, last year the media economy was an exception; slammed by the Covid-19 pandemic, revenue across the board stalled relative to the previous year.
In contrast to those who claim that the media economy in this country is a pygmy amongst giants especially relative to the United States, it is important to highlight the fact that of the thirty countries examined in Who Owns the World’s Media, the sum total of which account for roughly 90% of the world’s media revenues, Canada ranked as having the 9th largest media economy (Noam, 2016, pp. 1018-19).
Figure 2 below illustrates the immense growth and transformations of the network media economy in Canada that has taken place over the past thirty-six years.
Figure 2: Development of Telecom & Internet Access Services vs Digital and Traditional Audiovisual Media, 1984-2020 (current $, millions)
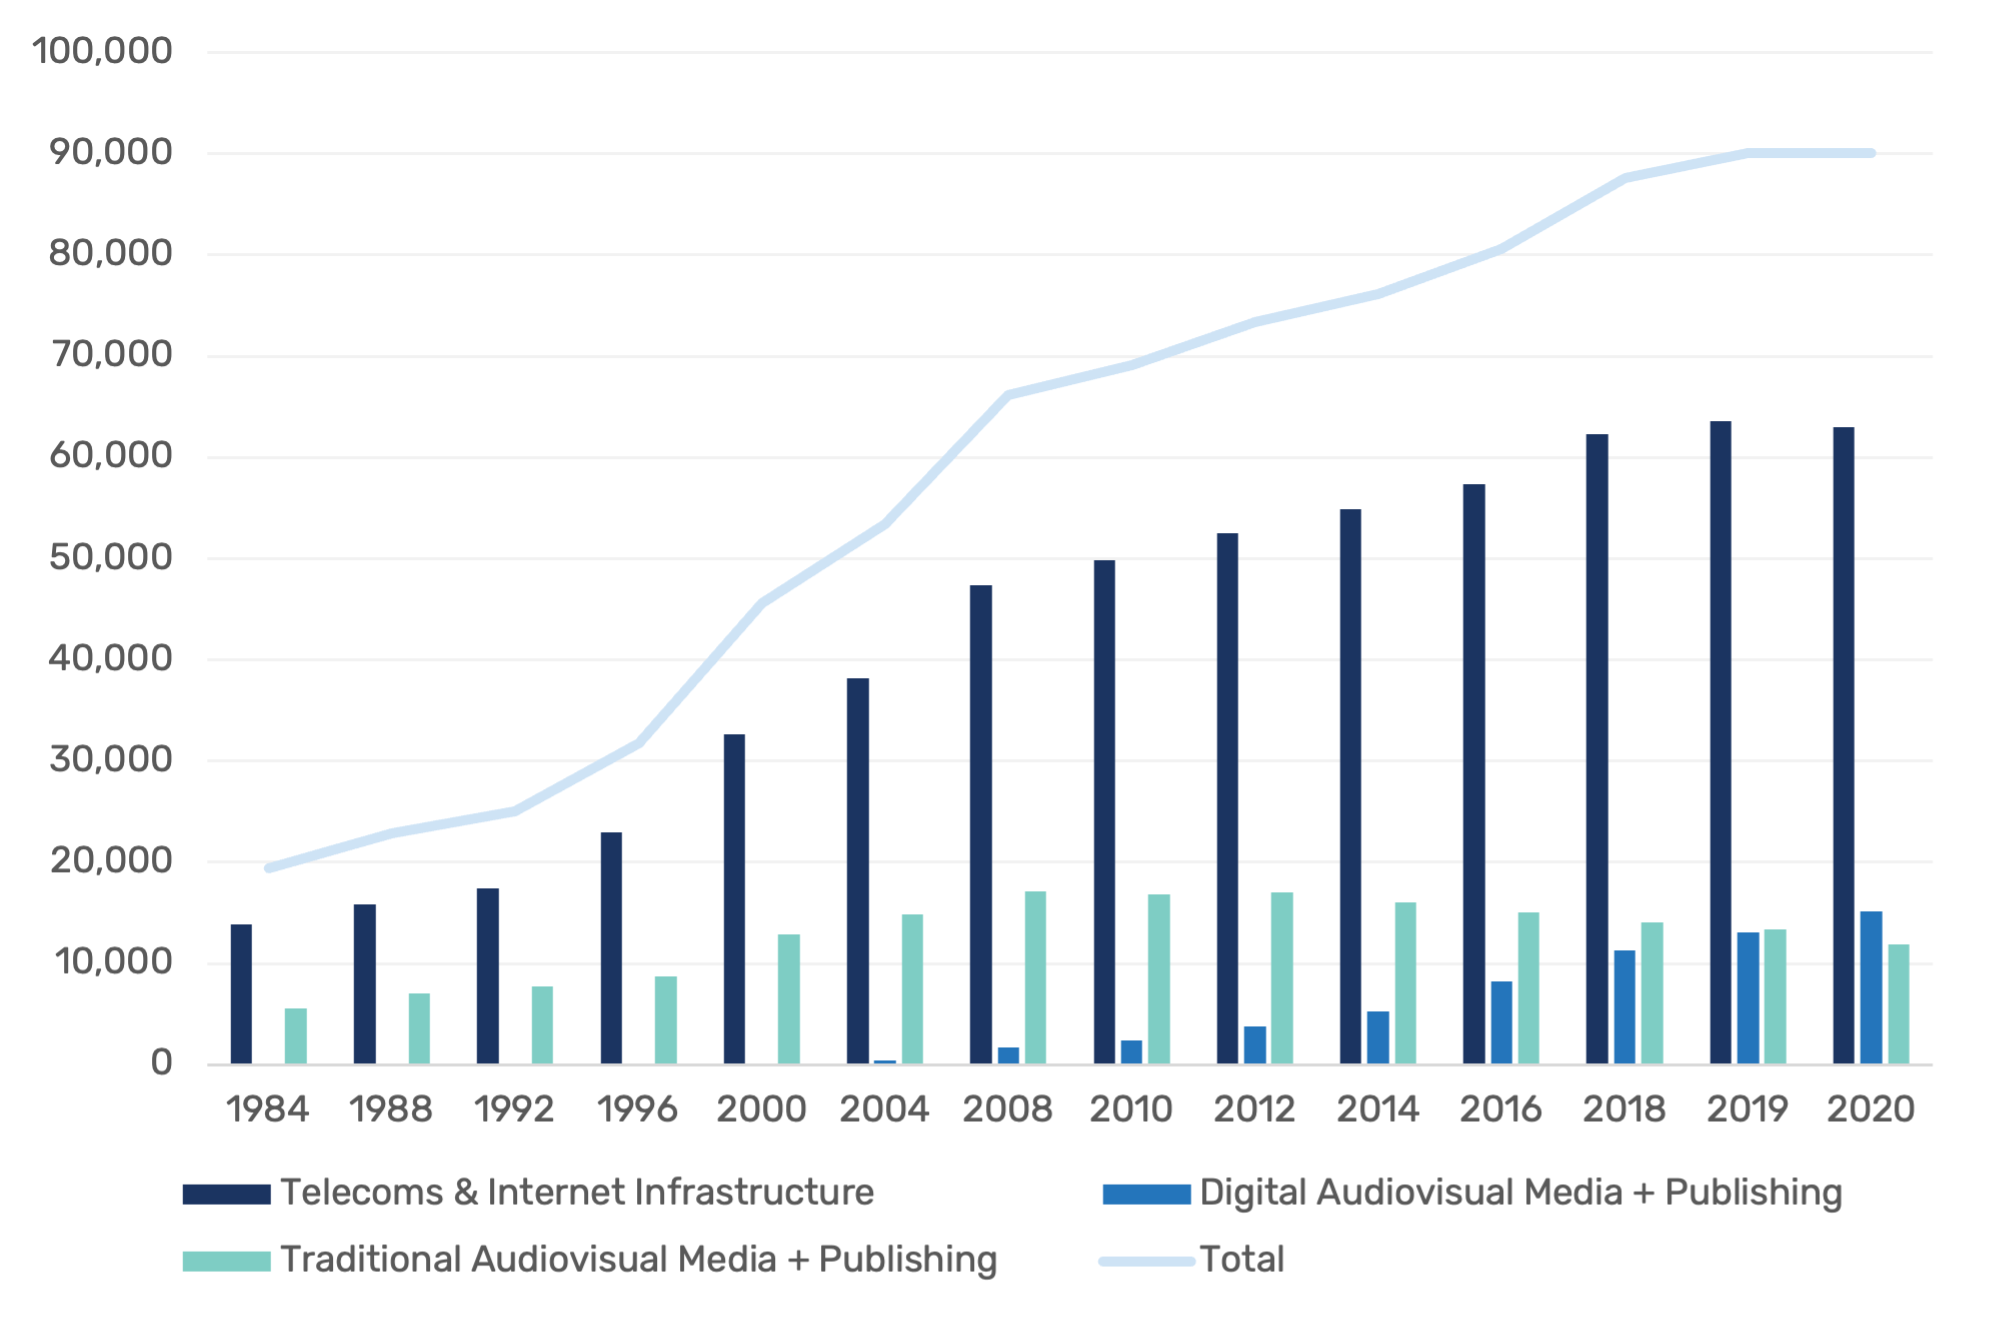
Source: see the “Total Revenue” sheet in the Excel Workbook.
While all segments of the media economy have grown substantially over the long-run, there are several trends and unique differences among them that merit closer attention. A key development identified in this report, for instance, is the fact that revenue for most communication, Internet and media sectors flat-lined or fell last year.
We also continue our previous work highlighting how media that have historically relied primarily on advertising revenue as the core of their business models continue to be caught between the pincers of stagnating, or by some measures, falling, advertising revenue while simultaneously facing the rapid rise Google and Facebook and those two companies’ fast-consolidating grip, not just on online advertising, but ad spending across all media. In this regard, four specific media sectors appear to be in terminal decline: broadcast television, radio, newspapers and magazines. Collectively, their revenue has collapsed; last year it was roughly a half what it was in 2008, when their fortunes went into tailspin from which they have never recovered (and probably won’t).
That said, there is no general crisis of the media. This is because advertising-funded media have been steadily eclipsed by the telecoms and Internet access sectors as well as “pay-per” audiovisual media services.1
Thus, while there is no doubt that advertising is and will continue to be an important part of the media economy, it only underpins a relatively small and steadily receding subset of the media. Altogether, advertising-funded media account for a modest 17% ($15.2 billion) of the $90 billion media economy.
The real centre of the network media economy consists of the communications and Internet access segments, i.e. the pipes, bandwidth, and spectrum-based –connections that are now central to effective participation in society, the economy and daily life. In 2020, they had total combined revenues of $63 billion, or 70% of all revenue generated within the network media economy, compared to the $15.2 billion in advertising-spending across all media. These sectors have grown far more quickly than others and are vastly larger than the content side of the media, although collective revenue for these sectors also fell by three-quarters of a billion dollars (a loss of 1.2%) last year as well as people cut their cable connections and pared back spending on mobile data services, including roaming fees as international travel ground to a halt.
Adding to the shift away from ad-supported media, and displaying remarkable resiliency even amidst the pandemic, the combined revenue for online video, music, digital games and app stores continued to rise last year to $5.4 billion, up by a billion dollars (or 25%) from the previous year. This was in keeping with the fast-paced growth of these sectors over the last decade.
In fact, combined revenue for communications and internet access services as well as subscription-based digital AVM services have come to outstrip that of advertising-funded media, including Internet advertising, by a five-to-one ratio. The upshot of these developments is that, in an increasingly Internet- and mobile wireless-centric world, it is network connectivity and subscriber fees, not advertising-supported media, that are king (see Odlyzko).
We also see this in household spending. In fact, such spending on communication services such as broadband Internet access and mobile wireless services as a percentage of all household outlays has doubled over the last four decades, while the percentage of income that households spend on media content, cultural goods and live entertainment services has stayed remarkably stable at an average of 1.3%, despite the advent of a vastly more complex and diverse array of such services. At the same time, spending on media, information and communication technology, in contrast, has fallen over time because even though people are buying more such equipment, the cost of such technology has plunged over time.2
Figure 3 below illustrates the point.
Figure 3: Household Spending on Communications and Media Services and ICTs, 1982-2020

Sources and note: Statistics Canada (2021). Table 203-0021 Survey of household spending (SHS), household spending, Canada, regions and provinces. See “Household Spending” sheet in Excel Workbook.3
The upshot of this is that enterprises providing media, entertainment and culture services are battling one another for a bigger slice of a relatively fixed pie. This phenomenon where household spending on such services stays fixed over such a long period of time has been called the “law of relatively constant media expenditures” by observers from a wide array of theoretical and political positions. It is compounded by the fact that much the same phenomenon applies to total advertising spending across all media, as this report shows in the pages ahead.4
What this means in practice is that different segments of the communication, Internet and media industries have distinctive characteristics and follow different evolutionary paths. this is one more reason why we need to rely on the scaffolding approach just outlined, i.e. because using this method helps to shed light on these distinctive characteristics and the different development paths of different media over time.
Figure 4 below depicts each sector covered in this report and its evolution over time separately in order to reveal the specific details and broad trends being introduced here and that we will return to over the course of the following pages in this report. The basic message of Figure 4 is this: while all areas of the telecoms-Internet and media industries have grown substantially over the long-run, and changes have been especially fast moving with respect to the digital AVMS sectors in the last five or six years, there are also unique differences among all of them that merit closer attention.
Figure 4: Separate Media, Distinct Evolutionary Paths and the Network Media Economy, 1984–2020 (current $, millions)
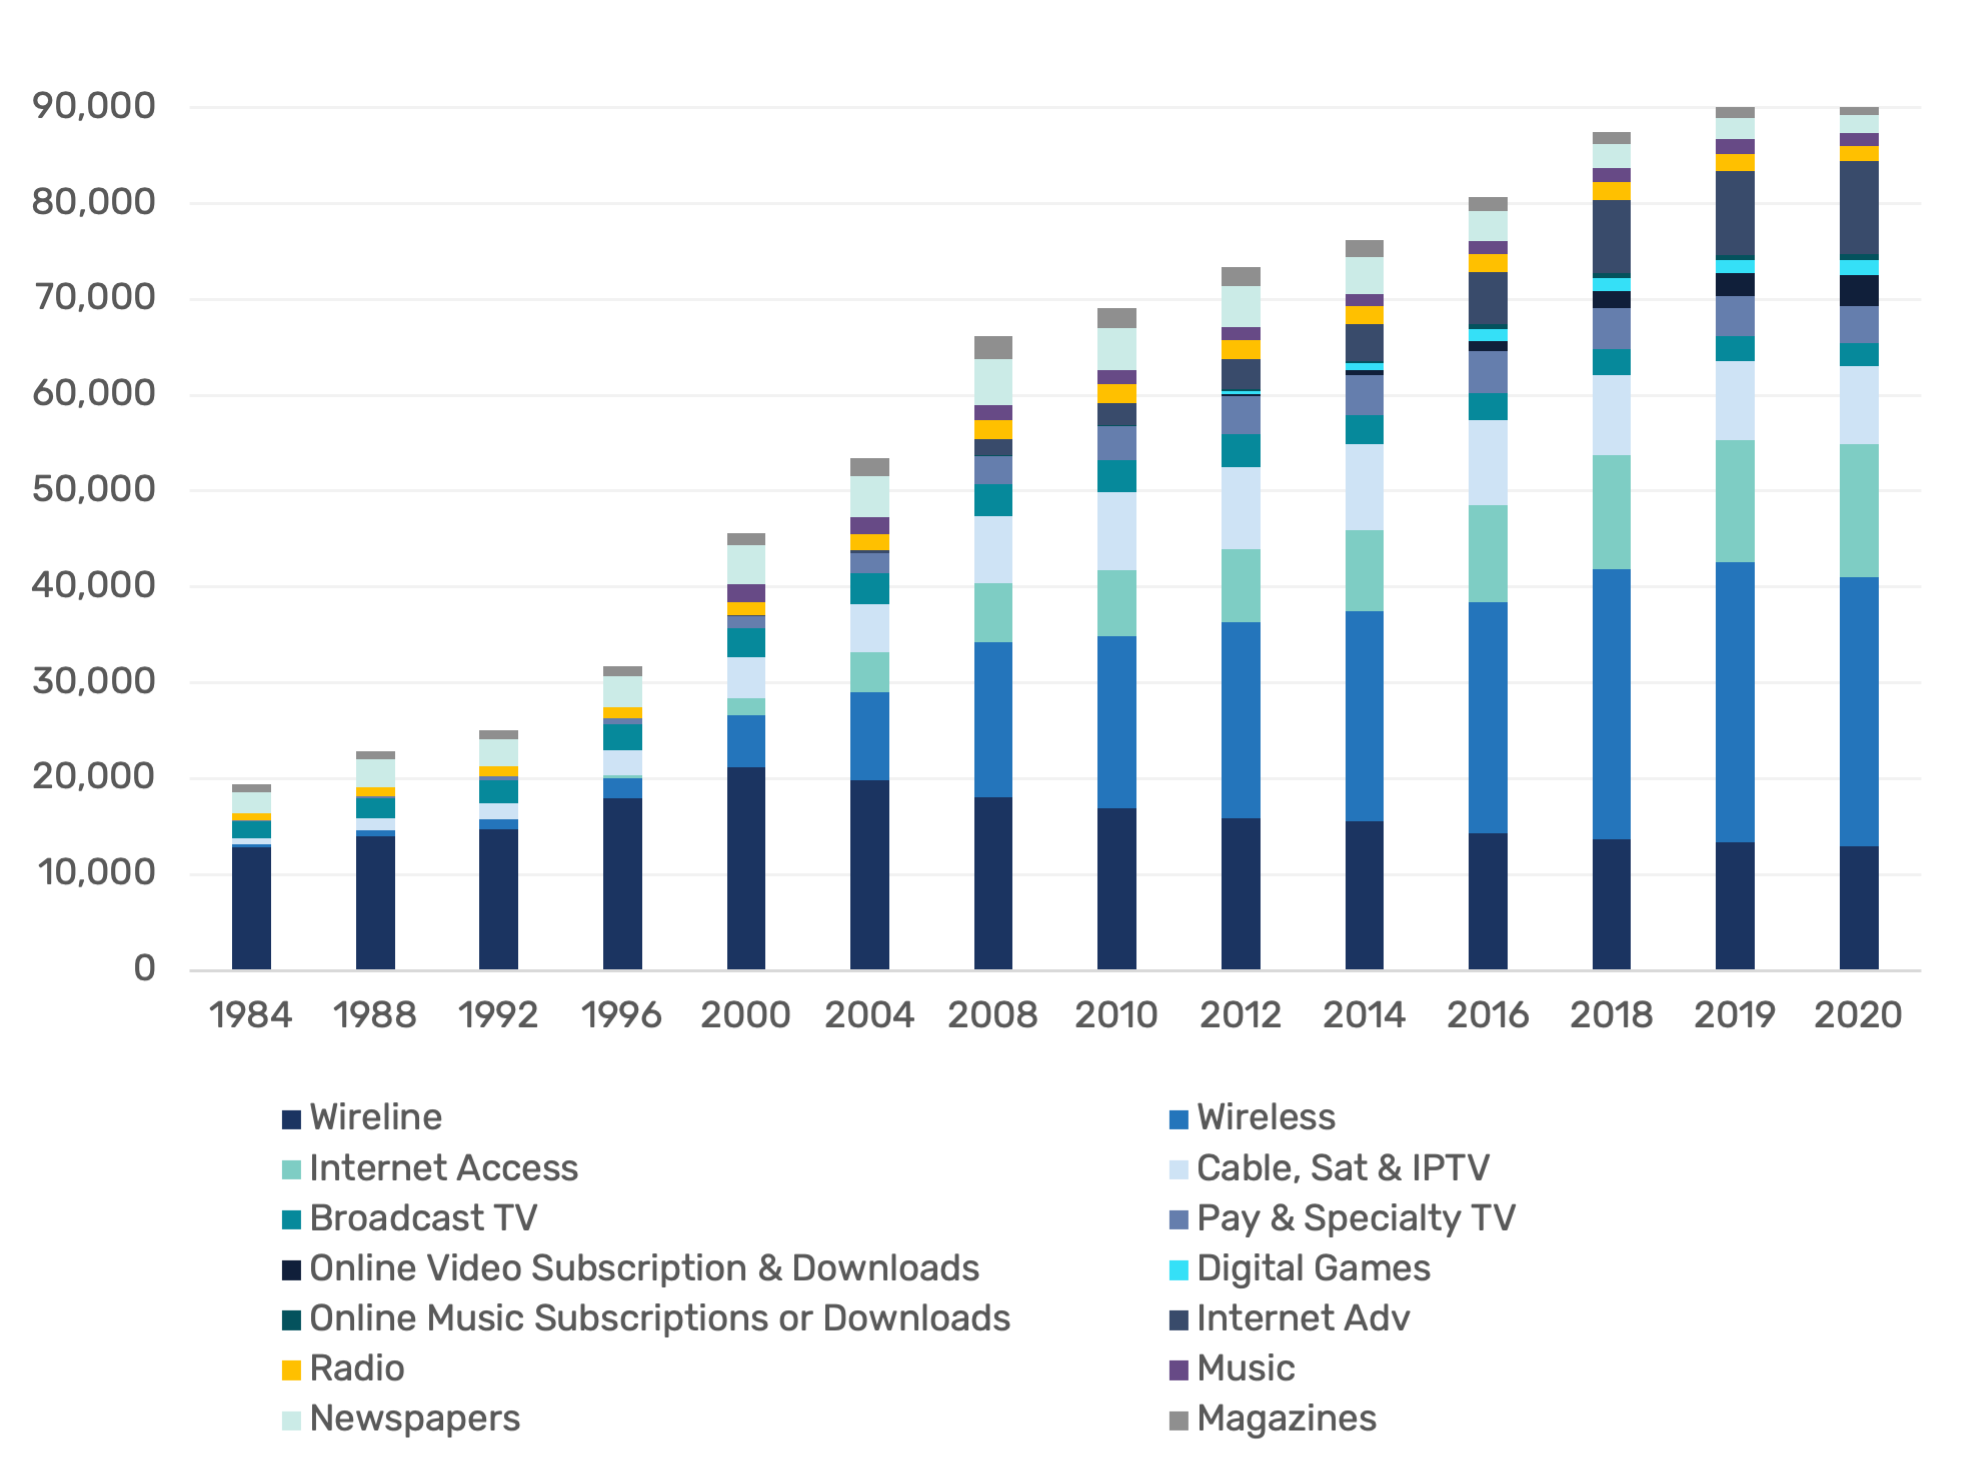
Source: see the “Total Revenue” sheet in the Excel Workbook.
To be sure, communication and media companies in Canada are facing intensifying competition with Google, Amazon, Facebook, Apple and Microsoft (the so-called GAFAM group of Internet giants) as well as Netflix as the latter move ever more deeply into media content and entertainment services sectors in Canada. In addition, as the Internet companies take on a growing role in the aggregation and distribution of media content, existing media groups are becoming more platform-dependent, at the risk of jeopardizing their own economic and cultural autonomy—and for uncertain benefits.5 Ultimately, these firms are all battling one another over a relatively “fixed pie”, given the remarkable stability of household spending on media, cultural and entertainment services, as observed above. The upshot is that the competition between these companies is intense, and becoming more so, even if the markets they operate in are still highly concentrated.
These developments have ignited fierce debates over the impact of GAFAM on the media in Canada— as well as other countries around the world—and are a key driver of calls for aggressive new forms of digital platform regulation that would have been unfathomable just a few years ago. They have also re-ignited long dormant debates over cultural nationalism and technological sovereignty that have not been seen with such intensity since the 1970s and 1980s. While these debates, regrettably, tend to be reduced to simplistic, ideologically-driven binaries between cultural nationalists, lobbyists and think tanks joined at the hip with domestic communication and media conglomerates on the one side versus free and open Internet advocates whose views, wittingly or not, line up with the interests of GAFAM, on the other, the fact of the matter is that reality and potential solutions to the intractable issues now before us are more complex than either of those positions allow. The rigidity, indeed, orthodoxy on both sides is stultifying and frustrating.
These concerns have been coming to head in the last few years as scholars and policymakers around the world intensely scrutinize a litany of problematic practices arising from the growth of the tech giants. These include: the rise of platform power and “digital dominance”; potential threats to domestic media and cultures; privacy and data protection; “fake news” and hate speech; national sovereignty; the integrity of elections; and antitrust. Consequently, governments from India and Australia to the Netherlands and Canada are all grappling with the implications of these developments. Indeed, there have been over 100 such public policy examinations in the last five years alone, as ongoing tally of these inquiries chronicles.6
The aim of this report and the next—and all of our work—is to bring out the greater complexity behind the issues at stake. It is also to provide a fairly systematic and long-term body of independent analysis that we hope others will draw to inform their positions.
Anchor Findings
• Mobile wireless and Internet access services continue to grow at a brisk pace, but Canada’s struggle to meet its targets for universal, affordable broadband internet access continues to be a significant issue.
• Canada’s adoption of IPTV is high relative to other countries, but it severely lags international peers in “fibre to the premises” access, the gold standard for communications infrastructure.
• Following favourable regulatory outcomes related to minimum service standard and net neutrality in the mid-2010s, a change in CRTC leadership since 2017 has put the future of broadband regulation and even the legitimacy of the agency itself into jeopardy.
The telecoms and Internet access industries have grown enormously, from $13.1 billion in 1984 to $63 billion last year. They account for approximately 70% of all revenue, and are thus the fulcrum upon which the media economy pivots. Figure 5 illustrates their development over time.
Figure 5: Revenues for the Telecoms and Internet Infrastructure Sectors, 1984-2020 (current $, millions)
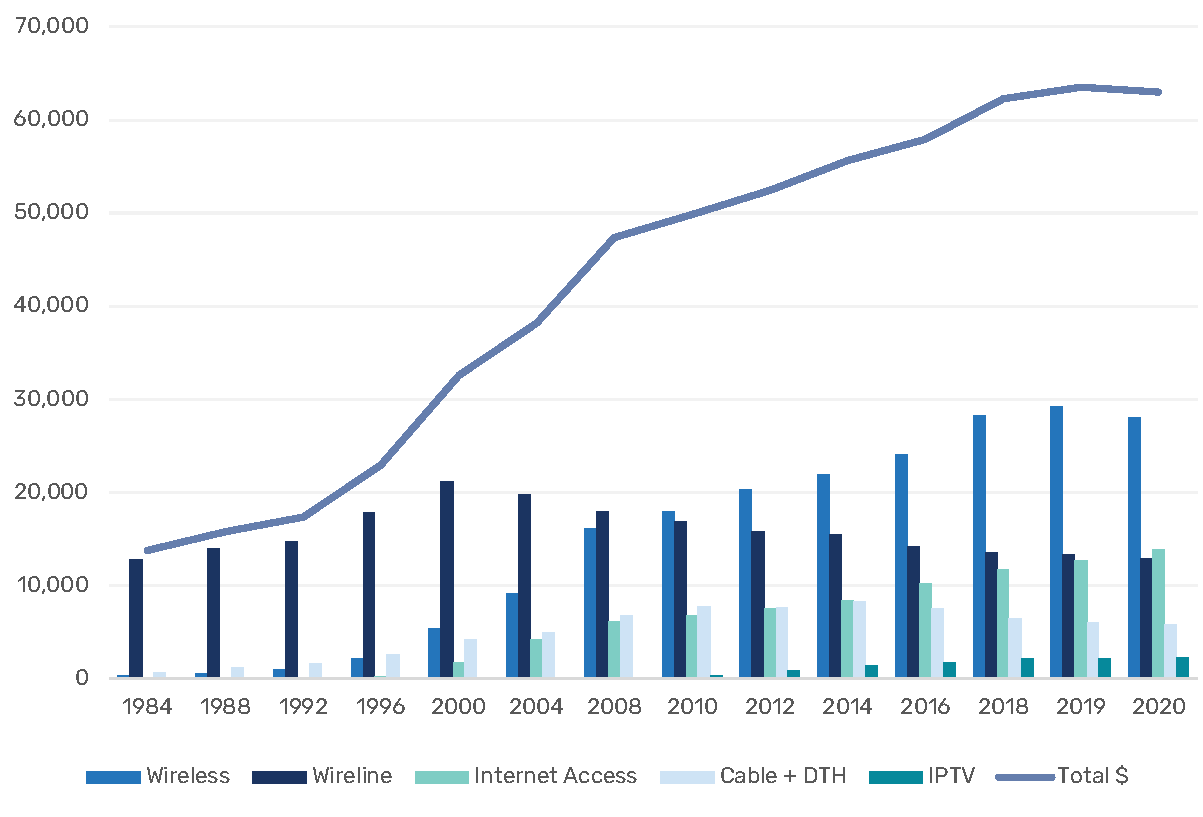
Source: see the “Wireline”, “Wireless”, “ISP” and “Cable DTH IPTV” sheets in the Excel Workbook.
Up until last year, mobile wireless services have grown tremendously since their introduction to Canada in the early 1980’s. Although they began as luxuries or business tools, the market for these services expanded quickly following the turn-of-the-21st century to become a cornerstone of the digital media ecology. Revenues from mobile wireless services overtook plain old wireline telephone services in 2009, while in 2014 the number of Canadian households subscribing exclusively to mobile services for their voice calling needs exceeded those relying exclusively on landlines for the first time (CRTC, 2015, p. 1). The centrality of mobile wireless services is also underscored by the fact that they are now the largest sector of the network media economy, by far, with revenue having grown more than five-fold from $5.4 billion in 2000 to an estimated $28.1 billion last year.
It is noteworthy that 2020 was the first year we have measured when mobile sector revenue shrunk—it was down roughly $1.1 billion from its high of $29.2 billion in 2019. This decline is likely the result of the global COVID-19 pandemic, as major operators suspended overage fees and saw international roaming fees grind to a halt overnight at the beginning of 2020. To a certain degree, it is to be expected that industry revenues will recover swiftly as the pandemic abates, especially with the rollout of 5G networks already underway, a development which sets the incumbent network operators up nicely to capture revenue from an expanding scope of customers and service applications.
It is also worth noting, however, that the revenue declines in this sector were specific to Bell, Rogers, and Telus—the three national incumbent providers—while the regional competitors Videotron, Freedom Mobile, Sasktel, Tbaytel, and Eastlink each continued to achieve revenue growth. The possibility should not be discounted that the competitive pressure brought to the markets in which regional providers operate is having an impact on the incumbents’ bottom lines. Whether or not this is the case could become more clear as life returns to normal (i.e. travel resumes, Covid relief measures are rolled back, etc), although the looming merger between Rogers and Shaw will certainly complicate the situation looking forward.
It is also worth observing that Canada mobile wireless market is the 8th largest in the world, based on revenue, as Figure 6 depicts.
Figure 6: Mobile Wireless Markets in the OECD, EU and Other Select Countries Ranked by Revenue (Millions, CDN$)
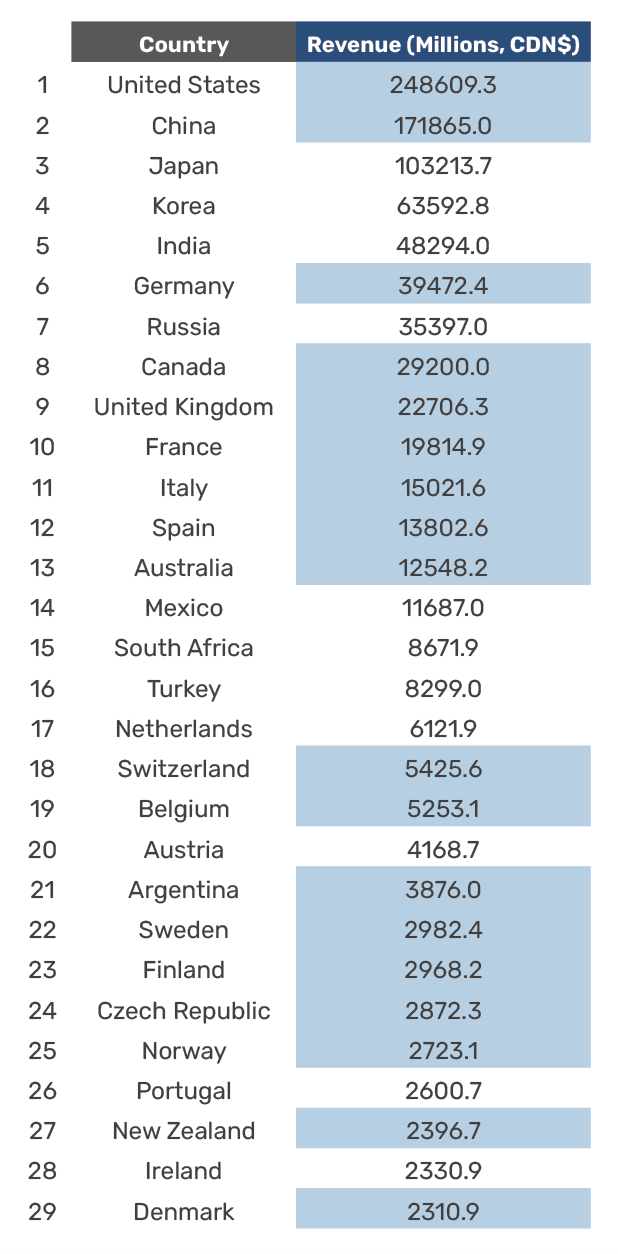
Source and Note: see “Biggest Mobile Wireless Markets” sheet in Excel Workbook. 2020 data = no highlight; 2019 data = light green shading.
The growth of mobile wireless services has tracked an expanding array of devices that people use to connect to mobile wireless networks—a sector that once primarily connected “feature phones” and pagers now provides connectivity to a constantly expanding range of different smartphones, tablets, and connected laptop PCs. As providers begin to debut “5G” networks, it is expected that this array will continue to expand in both scale and scope, with the emphasis shifting even further in the direction of data-based services, rather than the traditional voice-based services that gave mobile services their start. Consistent with this trend, mobile data traffic has roughly doubled (40-60% growth) in Canada each year over the past decade. Cisco projects that mobile data traffic will grow four-fold between 2017 and 2022.
Despite this significant growth, mobile broadband (i.e. mobile internet) adoption and usage in Canada has consistently ranked poorly when compared to other OECD countries. In 2020 Canada dropped five ranks, from an already lowly 32nd out of 37 OECD countries for broadband wireless penetration, to 37th of 38 OECD countries in 2020. Canada’s mobile service adoption has consistently been below the US, UK, Denmark, Australia, and the vast majority of other OECD countries. Figure 6, below, illustrates the point. Moreover, this is a position that Canada has languished in for a decade-and-a-half (Benkler, Faris, Glasser, Miyakawa, Schultze, 2010; OECD, 2011).
Figure 7: OECD Wireless Broadband Subscriptions per 100 inhabitants, by Technology, December 2020
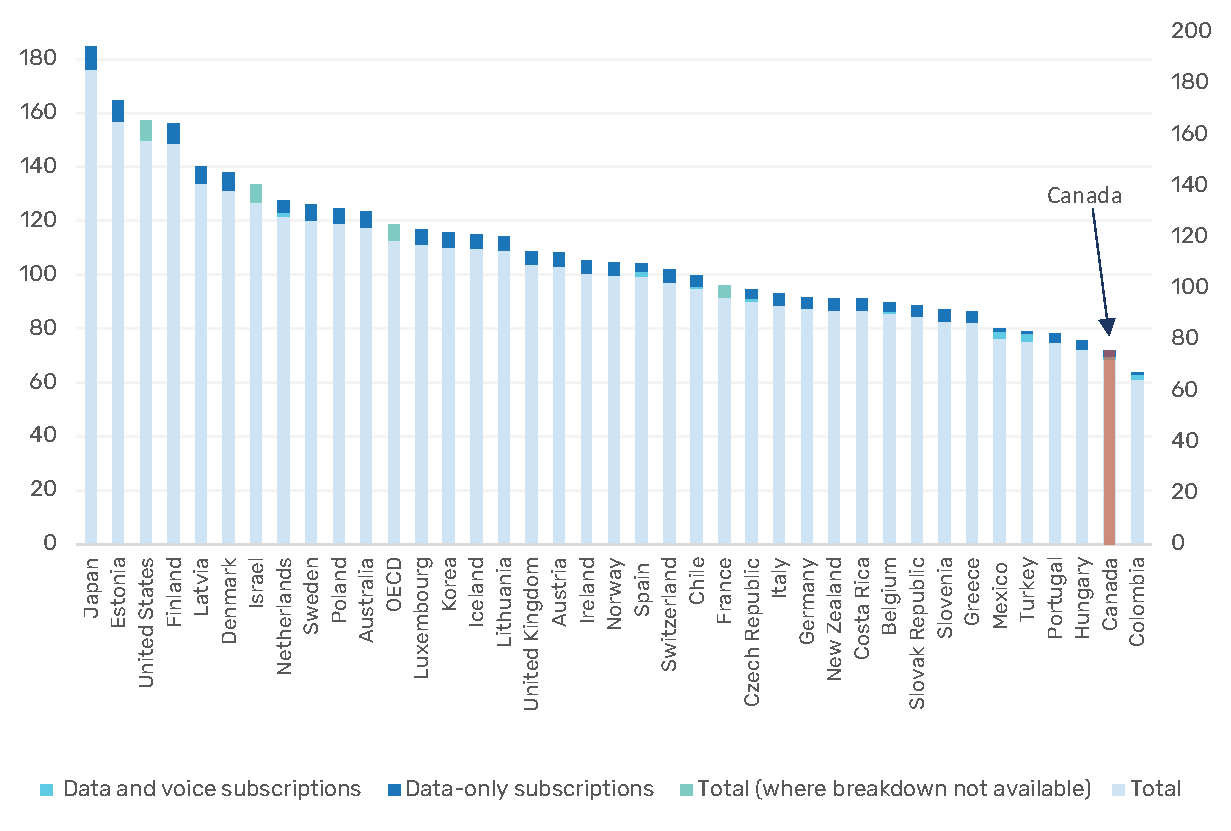
Source: OECD Broadband Portal.
Like other sectors, revenue growth in mobile wireless slowed post-2008. Already as early as 2013, some observers argued that this was the result of a maturing market (Church & Wilkins, 2013, p. 40). That explanation, however, ignores the under-development of the mobile wireless market in Canada relative to all but a few of its OECD peers. In addition, continued growth of the sector has shown this prediction to be incorrect.
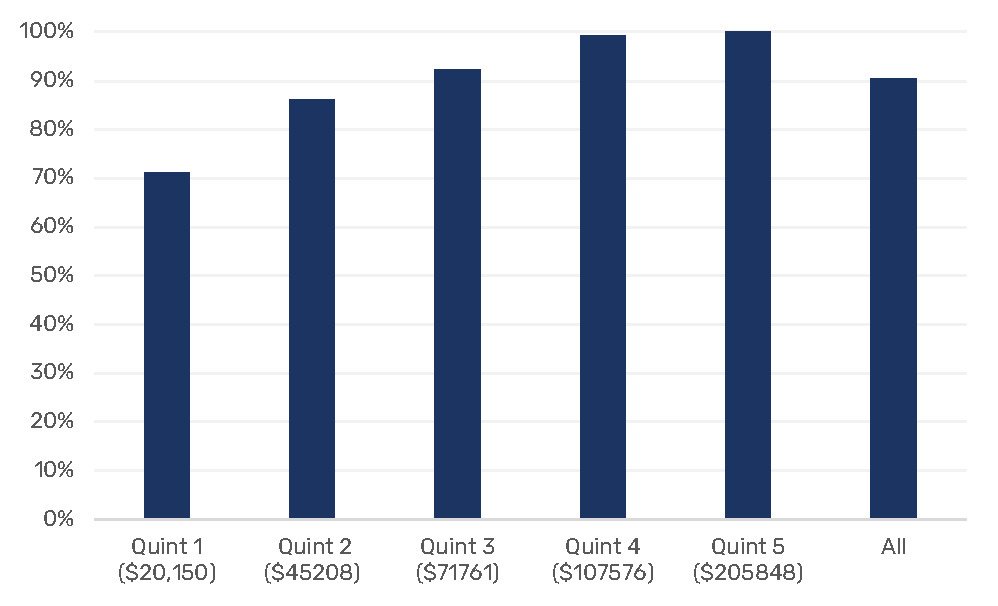
Although revenue continues to grow at a significant rate, adoption levels in Canada have lagged behind our peers, and remain stratified by income.
As of 2019 (the most recent year for which data are available), just fewer than one of four (23.6%) of households in the lowest income quintile did not subscribe to a mobile wireless service, while approximately 1 out of 10 (11%) of those on the next rung up the income ladder stand in the same position. Although these figures do represent small improvements in recent years, there is still a significant gap that remains open. At the opposite end of the income scale, for example, mobile wireless penetration is nearly universal at 98.7%.
Figure 8 illustrates the levels of adoption for mobile phones by income quintiles in Canada as of 2019, as well as for broadband Internet, home computers and cable television.
Figure 8: Household Adoption to Information and Communication Technologies by Income Quintile, 2019
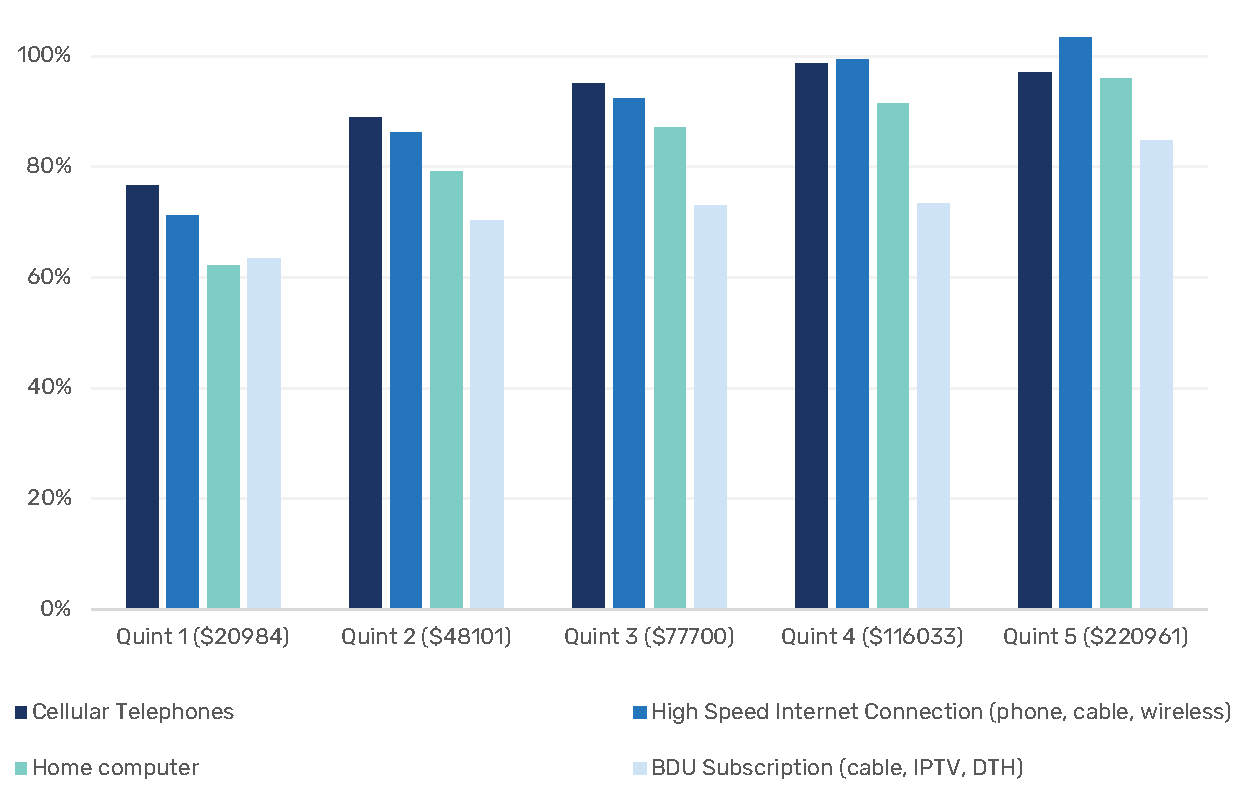
Source: Statistics Canada (2021). Survey of Household Spending.
In the past, proponents of the status quo—who look favourably upon the economic performance of the sector while ignoring the concerns of those who struggle to afford access to this crucial service—have attempted to distract attention from these low levels of penetration by touting the supposedly large number of subscribers who have smartphones. However, as the OECD data presented above show, adoption of mobile broadband services in Canada—smartphone connectivity, that is—remains woefully low by international standards (OECD, 2020).
Canada has also historically fared poorly in terms of mobile data usage, and 2020 was no exception. Canada ranking 32nd of the 36 OECD countries that reported this information for 2020. It is true that, with an average of 3.4 GB of mobile data usage per subscriber per month last year, Canada’s performance on this metric improved (from 2.9GB/mo. in 2019). However, such improvement was meagre compared to nearly all of its OECD peers. The rate of growth in Canada is slower than elsewhere as well.
Mobile usage in Canada remains well below the OECD average of 7.4 GB per month (up from 5.8 GB per month in 2019), and dramatically behind usage levels in countries such as Finland (31 GB, the leader), Austria (25.75 GB), Korea (11.5 GB) Sweden (12 GB) France (9.7 GB), the US (9.2 GB), Australia (9.25 GB) and the UK (5.3 GB) and (OECD, 2020; FCC, 2020, para 27).
There are many reasons for this state of affairs, but price and affordability are two key considerations (OECD, 2018; Klass & Winseck, 2019). The concentrated structure of mobile wireless markets and diagonally-integrated nature of the firms that operate in them are also key factors (Genakos, Valletti, & Verboven, 2017). Incoherent policies and inconsistent actions by the CRTC, Competition Bureau and ISED/Industry Canada also contribute greatly to this state of affairs (see Middleton, 2017 and Ben).
While wireless services now occupy the centre of the media universe, the wireline telecoms infrastructure that supports plain old telephone service (POTS), value-added business services, Internet access, cable and IPTV networks continues in its place as a major pillar in the network media economy. Combined, these services accounted for just under half of all telecoms and internet access revenues (48.7%) in 2020, while mobile wireless services accounted for the rest.
On its own, however, plain old telephone service revenue fell to $12.9 billion last year—far off the high-water mark of $21.2 billion in 2000. The steep drop-off in revenue, however, has slowed in recent years, with losses offset by gains in internet access, IPTV and cable revenues. In addition, most of the telecoms and cable companies such as Bell, Telus, Rogers, Shaw, Quebecor and Cogeco were acquiring data centre operations in the early part of this decade but in the past few years all but Bell have reversed course and sold off their data centres to firms specializing in cloud computing.
More recently, some firms have moved into the provision of specialized services; for instance, Telus has begun to offer healthcare-related services accounted for within the ambit of its wireline division while in December 2020 BCE acquired the biggest data analytics firm in Canada, Environics. The lack of available disaggregated data with respect to these firms’ services, however, does not allow us to gauge the scale of these activities with any precision. Still, it is worth noting that these activities may be coming to play an increasing role in the wireline activities of major Canadian telecommunication companies. As such, they open up new vectors of diversification and vertical integration.
Internet access revenues have grown immensely over time, similar to mobile wireless. Internet access revenues were roughly $13.9 billion last year, up from $12.7 billion the previous year, and close to eight times what they were at the turn-of-the-21st century ($1.8 billion).
The adoption of wireline Internet access in Canada is high relative to other OECD countries, but so too are prices, while available speeds are mediocre, data usage comparatively low (330 GB per household per month in 2020), and data caps commonplace, whereas in most comparable countries they are rare and overage charges not nearly as punishingly expensive.7
Also, like mobile wireless services, high-speed and broadband Internet access are far from universal. According to Statistics Canada’s most recent data (2019), 90.4% of households have adopted high-speed internet access service (i.e. > 1.5 Mbps), as shown in Figure 9, below. If we consider the uptake of services that meet the broadband universal service target of 50 Mbps up and 10 Mbps down adopted by the CRTC in 2016, 62% of Canadian households met that target in 2019 (CRTC, 2020, p. 50). There are also significant disparities in access between urban versus rural and remote areas, and people’s adoption of broadband is divided starkly along income lines as well.
Figure 9: High-Speed Internet Adoption by Income Quintile, 2019
Source: Statistics Canada (2021). Survey of Household Spending in 2019.
A key development over the past decade-and-a-half has been the growth of the telephone companies’ (e.g. Telus, Bell, SaskTel) Internet Protocol TV (IPTV) services. This took place slowly at first but since 2010 the pace of IPTV development has quickened. By the end of last year, the incumbent telcos’ managed Internet-based television services had over 3.1 million subscribers between them. As a result, the telco’s IPTV services now compete extensively with traditional cable television services in cities across the country. Figure 10 below shows the growth in IPTV subscribers over the past decade-and-a- half.
Figure 10: The Growth of IPTV Subscribers in Canada, 2004-2020
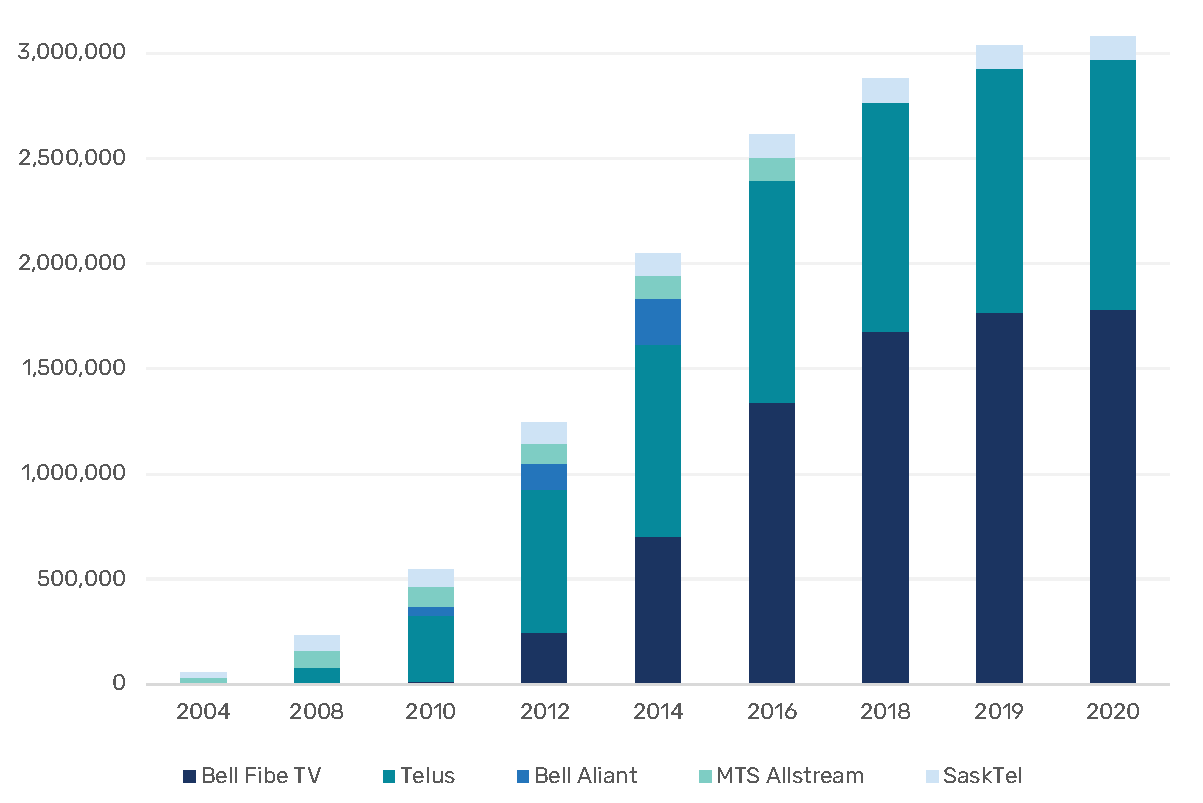
Source: see the “Cable DTH IPTV” data sheet in the Excel Workbook.
The telcos’ revenue from IPTV service has also increased sharply from $1 billion in 2013 to nearly $2.3 billion last year–again. Figure 11 below shows the trends.
Figure 11: The Growth of IPTV Revenues in Canada, 2004-2020
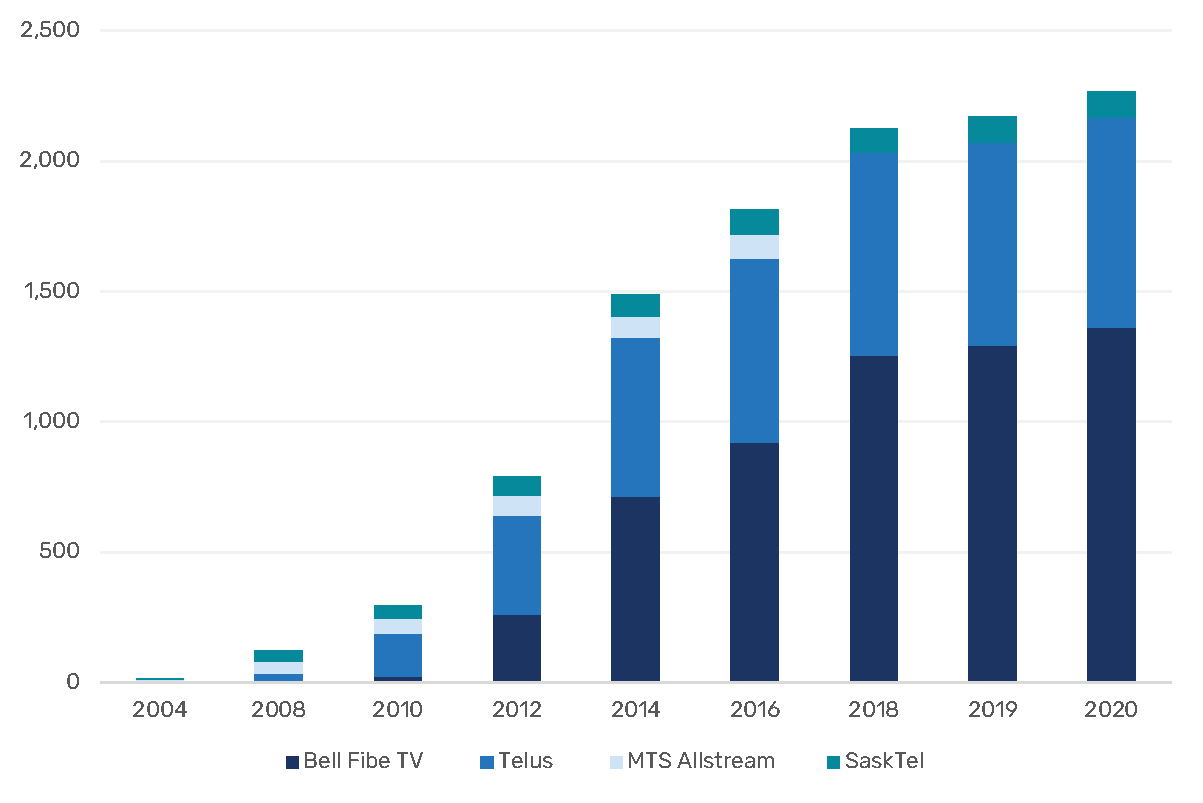
Source: see the “Cable DTH IPTV” data sheet in the Excel Workbook.
MTS, SaskTel and Telus first began to deploy IPTV in the prairie and western provinces in the mid-2000s. Bell initially lagged behind its western Canadian counterparts but began to follow suit in the early 2010s, perhaps because it did not want to cannibalize its direct-to-home satellite television service. Fast forward to 2020, and the telcos’ IPTV services now account for 30% of the TV distribution market based on subscribers, or 28% based on revenue. The fact that telecoms operators’ IPTV services have gained market share at the same time that “cord cutting” has picked up steam has significantly added to the competitive pressure that the cable companies now face from the telcos’ IPTV services.8
Figure 12 below illustrates these points.
Figure 12: Cable & Satellite Provider vs IPTV Revenues, 1984-2020 (current $, millions)
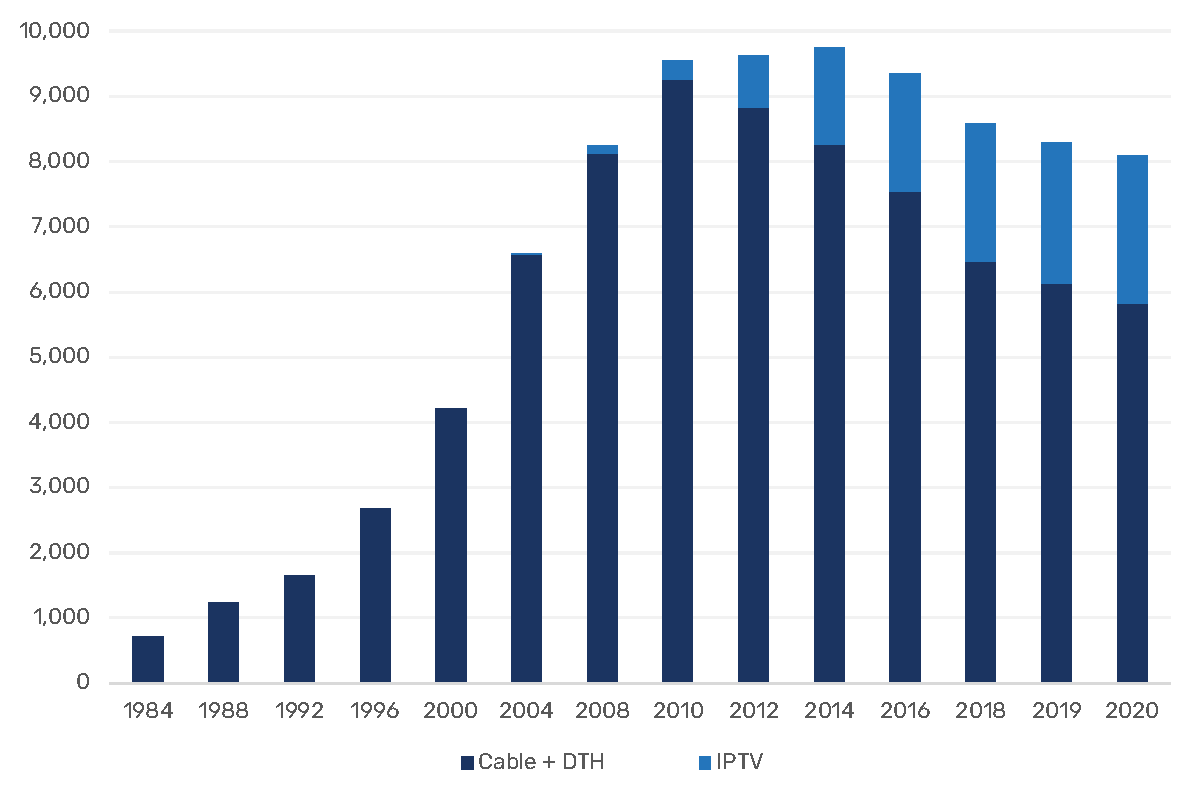
Sources: see the “Cable DTH IPTV” sheet in the Excel Workbook.
As Figure 12 also shows, cord cutting—the process whereby people drop their cable, IPTV or DTH service in favour of accessing audiovisual media services directly over the Internet (or over the air, or not at all)—has gained traction since 2014. While substantial growth in IPTV services over the past decade delayed this trend, the number of subscribers for all broadcast distribution undertakings has slipped from 85.6% of households at its highpoint in 2011 to 69.8% last year. In short, cord-cutting is real.
Moreover, lost subscribers has translated into sizeable revenue losses to the BDU sector; revenue fell from $9.7 billion in 2014 to $8.1 billion last year—a decline of 17%. Those losses, however, were deferred for several years by steep increases in subscription prices for BDU services. At the same time that people have been dropping their cable service to access online video services directly, the price of Internet access has also jumped. As a result, the price of subscriptions for cable TV and Internet access have risen well above increases in the consumer price index, as Figure 13 below illustrates.9
Figure 13: The Price of Communication Services and Devices vs the Consumer Price Index, 2002-2020
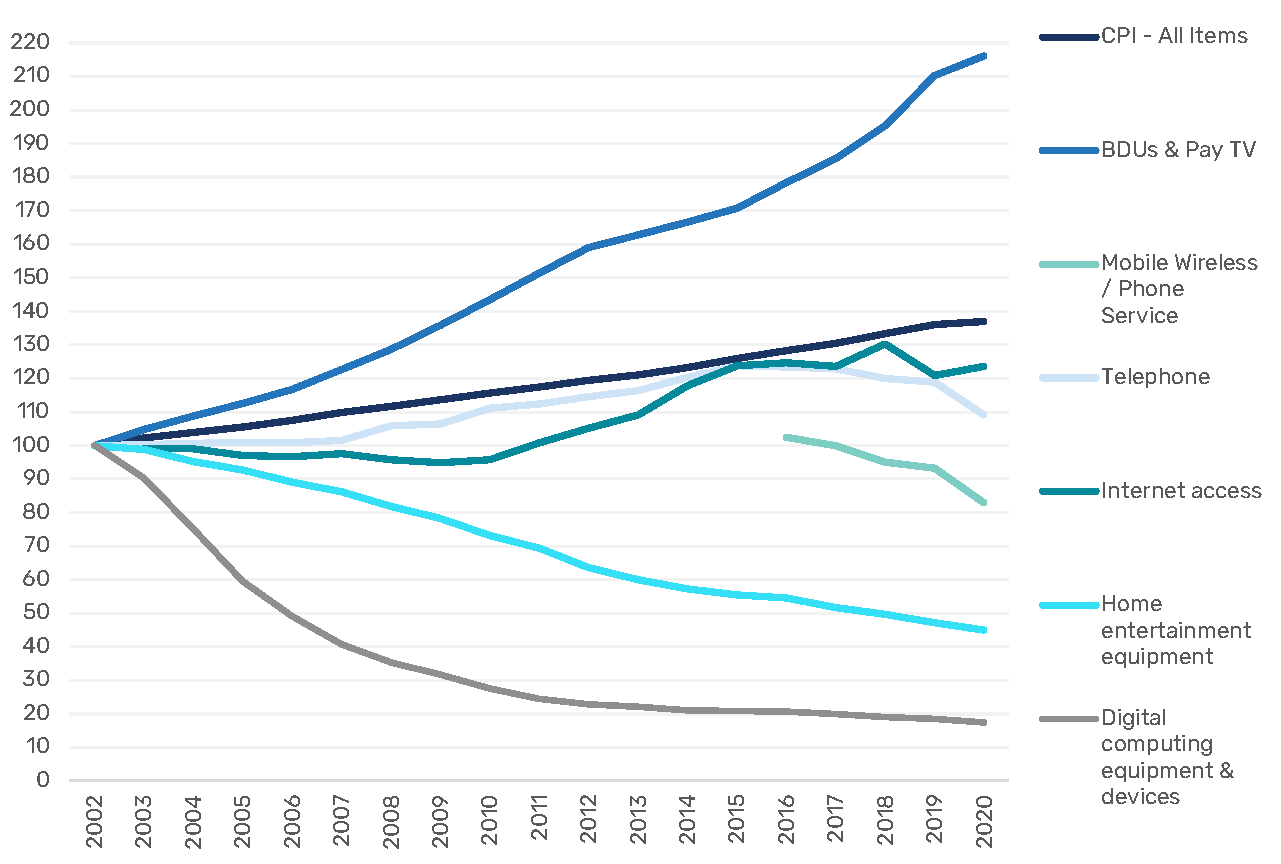
Source: Statistics Canada. Table: 18-10-0005-01 (formerly CANSIM 326-0021)—Consumer Price Index, annual (2002=100).
IPTV services are also important because the distribution of television and entertainment services are critical to driving the demand, and thus the revenue, telecoms operators need to invest to bring next generation fibre optic broadband networks to people’s doorsteps (see below).
The rate of IPTV adoption in Canada is relatively high by international standards, with 30% of all BDU subscriptions being to IPTV services in 2020. This level of IPTV adoption is higher than the U.S. (8.9%), Germany (14.2%), the UK (16.9%) and Japan (26.1%) but behind IPTV adoption levels in Western Europe as a whole where IPTV and cable subscriptions are nearly equal (35.7%), China (44.2%) and France (78.4%) (S&P Global, 2021).
While Canada has done fairly well with respect to IPTV availability and adoption, the picture changes for fiber-to-the-premise/doorstep (FTTP), which, as Susan Crawford (2019) observes, represents the gold standard of telecommunications networks, and will be a requirement for future economic growth. Indeed, just 22% of broadband connections in Canada use FTTP compared to the OECD average of 31%. At the high end of the scale, in Norway, Finland, Sweden, Japan and Korea, 60% to 85% of all broadband connections are fiber- based. According to the OECD, Canada ranked 24th out of 38 countries on this measure as of December 2020. Figure 14 below illustrates the point.
In sum, when it comes to fibre-optic networks, the prairie telcos and Telus were the first do deply them in the mid-2000s while Bell only began to do so in a substantial way after 2010. Globally, Bell’s late turn to IPTV and FTTP in Ontario, Quebec and Atlantic Provinces means that Canada continues to lag significantly behind comparable countries on this measure.
Figure 14: Percentage of Fibre Connections Out of Total Broadband Subscriptions (December 2020)
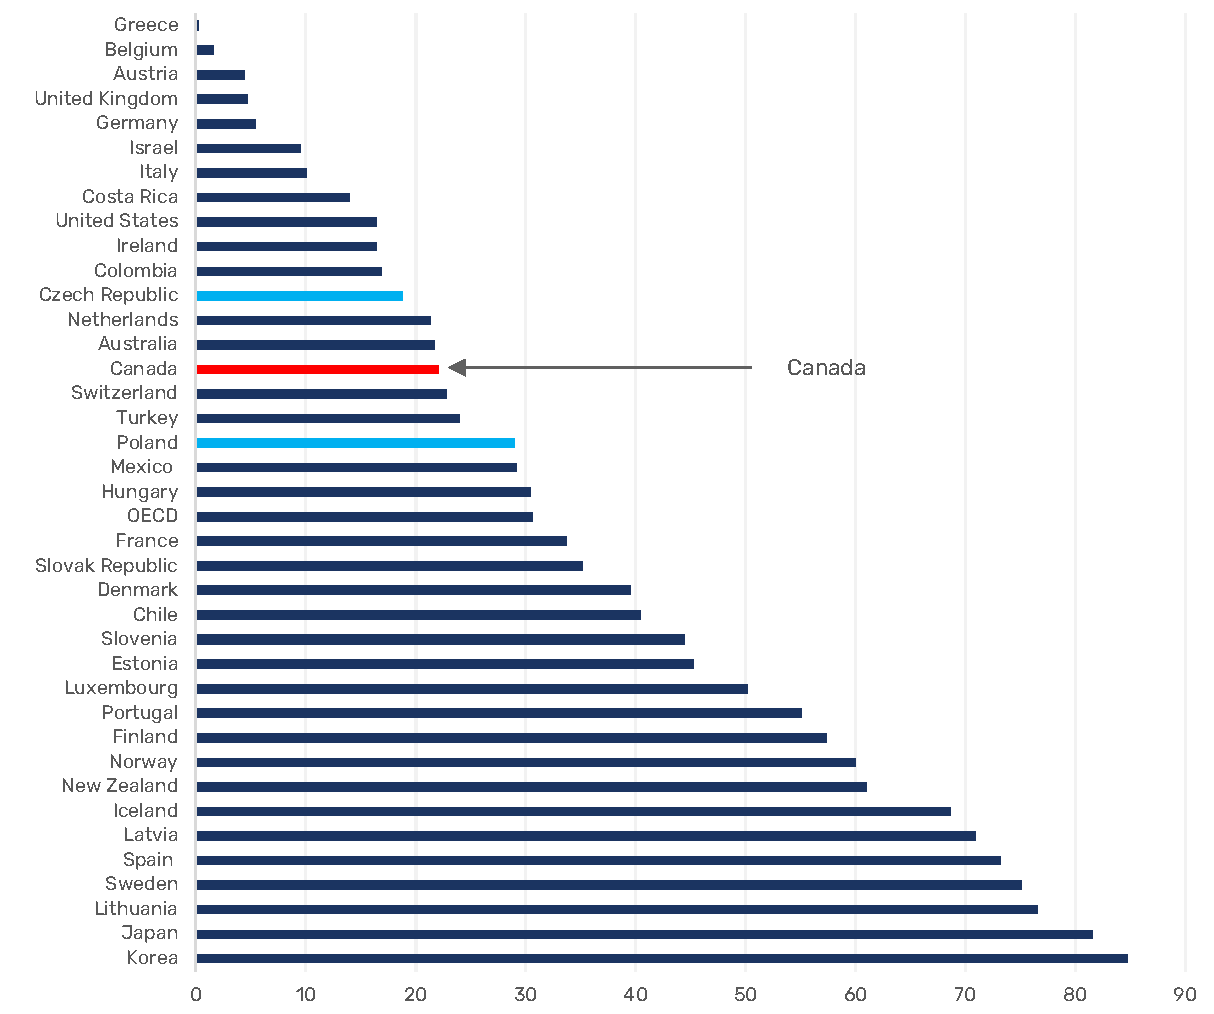
Source: OECD (2020). Broadband Portal, Table 1.10.
The general evolutionary pattern that we see with respect to fibre network deployment in Canada replays a long-standing practice whereby new services start out as luxuries for the rich before a combination of competition, public pressures and firm regulatory measures turn them into affordable necessities for people at large (see Richard John with respect to the US history, Robert Babe for Canada). Current debates over access to broadband fibre infrastructure are the latest iteration of this old story (Winseck Reconvergence, Winseck and Pike, John, Babe, Middleton). In fact, this could be seen at the end of 2016, when the CRTC set new standards for universal and affordable broadband Internet service: minimum speeds of 50 Mbps up and 10 Mbps down to 90% of the population by 2021 (and the rest of the country a decade to a decade-and-a-half later), and with an unlimited option on offer—that is, an Internet connection with no data cap. While the idea of unlimited Internet service was the norm in Canada before 2010, and remains so for most people in the developed world, today it is just one available options amongst others and expensive in Canada.
Policymakers have recognized that access to the Internet is no longer a luxury. This has been made especially clear during the Covid-19 pandemic of 2020. That said, large strides will be needed to ensure that aspirations meet the reality on the ground, as Canada’s standing with respect to deployment and adoption of fibre-to- the-doorstep reminds us.
A similar relatively large view of the public’s interests was pursued in early 2017 under the previous CRTC chair, Jean-Pierre Blais, when the regulator adopted new rules that stop the telcos and ISPs from using zero-rating to pick and choose some services, apps and content that won’t count against subscribers’ monthly mobile wireless data caps while everything else does. While zero-rating can be attractive to the companies as a way to differentiate their services from those of rivals, and to some consumers who see this as way of getting data for “free”, such practices are better seen as marketing gimmicks propped up by artificially low data caps and limited choices. In places where data caps are large or non-existent, zero-rating is rarely used, whereas in countries where they are low, like Canada, it is far more common—at least until the CRTC’s ruling that effectively banned it.
While the U.S. has never banned zero-rating, the EU has taken a restrictive approach. A series of four rulings by the European Court of Justice between 2020 and September 2021 clarified matters and add up to an effective ban on such practices. Together, these decisions found that zero-rating some services while throttling others once data allowances are met as well as limitations on roaming, tethering and speed all violated net neutrality rules in the EU.
The de facto ban on zero-rating in Canada and the EU (and India) are important for several reasons. For one, while mobile wireless markets tend to be highly concentrated around the world, when there are no stand-alone mobile network operators and/or maverick firms—as in Canada—data allowances tend to be low and extensively used. This reality is further aggravated in contexts where carriers also own TV and entertainment services, as is in Canada, because under such circumstances carriers have the incentive and the ability to zero-rate their own services while counting everything else towards subscribers’ monthly data allowance.
In other words, several structural features of broadband and mobile wireless markets in Canada bias them toward low and restrictive data caps and a desire by service providers to adopt “zero-rating” as an alternative to giving people bigger data allowances, or even making unlimited services the norm rather than an expensive and rare option (see, for example, Rewheel/Digital Fuel Monitor, 2021). As we saw earlier, Canada also has low levels of mobile data usage; these two things are closely related.
Ultimately, questions about zero-rating embody a philosophy of communication, one that says that when data caps are high or non-existent, people can use bandwidth to communicate, entertain, express themselves, work and do with as they want—within the limits of the law. When they are low, however, what people can and cannot do with “the means of communication” at their disposal is artificially restricted to serve the carriers’ business models and profits. Seen from this angle, the issues at stake are not just about prices but whether the speech and editorial rights of people, “content creators and distributors”, apps makers and service providers come first or whether those of the carriers and ISPs are paramount? In early 2017, the CRTC ruled in favour of the first group, and drew on the principles and history of common carriage10 to do so (see Klass, Winseck, Nanni & McKelvey, 2016).
Both rulings—the 2016 decision setting out new basic service standards and the 2017 zero-rating decision—staked out a fairly ambitious view of what Canadians need and deserve in “the digital media age”. On the one hand, the basic services ruling includes affordable access to high- quality communication services and gives priority to the expressive rights of people, content creators, apps developers and service providers over the those who own broadband Internet access and mobile wireless networks. Consequently, people do not have to accept only what the market gives them because communication needs have been recast in a more expansive way in the light of conditions in the 21st Century.
On the other hand, the carriers do not like this run-of-events and have wasted no effort fighting to change it over the course of the last year. Thus far, they have not been able to roll back the gains on the net neutrality/common carriage front. In terms of the basic service objective, however, they have found a friendly ear with the new Chair of the Commission, Ian Scott, who has taken a miserly view of what people should expect with respect to more affordable mobile wireless and broadband Internet services (e.g. CRTC 2018-475), and has accordingly reversed course when it comes to creating more competitive conditions in both mobile wireless and wireline broadband access markets that would help further such aims.
To this end, for example, the CRTC under Scott has, in essence, rejected the Mobile Virtual Network Operator (MVNO) option and taken only extremely limited and thus far largely ineffective steps to address the affordability issues that have plagued the mobile wireless sector for decades (CRTC, 2021-130). Early this year, the Scott-led CRTC also reversed the Commission’s own previous decision with respect to the wholesale pricing regime for independent ISP access to the incumbent telco and cable company’s networks, siding with incumbents by raising wholesale rates with little explanation or justification. The effect was to reinstate higher wholesale rates that the Commission had previously found to be inflated while taking that earlier ruling’s requirement that incumbents reimburse independent ISPs for excessive charges off the table (CRTC, 2021-181). It was an extraordinary about face.
Scott’s initial appointment in 2017 as CRTC chair for the next five years was met with skepticism. Yet, critics, reformers and public interest advocates were also willing to suspend judgement because they had also come to learn that, in the recent past, their early suspicions of appointees who seemed too close to
The CRTC also reversed course earlier this year when it decided not to extend competitors’ access to the inside wiring of condos and apartment buildings to include fibre-optic wiring. As a result, competitors The CRTC also reversed course earlier this year when it decided not to extend competitors’ access to the inside wiring of condos and apartment buildings to include fibre-optic wiring. As a result, rivals who seek access to condo and apartment-building residents can get that access so long as the ‘inside wiring’ is made of copper but not to upgraded fibre networks. This effectively tied the pro-competitive regime that had been in place for two decades to a technology—copper wiring—from last century rather than upgrading it to the infrastructure standards of the 21st Century, i.e. fibre (CRTC, 2021-139).
Taken together, the decisions discussed above represent a remarkable reversal for the CRTC; from a regulator that had under the Conservative appointed leadership of J.P. Blais embraced a principled approach to its legislative mandate (however imperfectly), it now appears to have settled back into the disturbing role of captured protector of incumbent regulated entities.
Scott’s appointment in 2017 to a five-year term as CRTC chair was initially met with skepticism. Yet, critics and public interest advocates were also willing to suspend judgement because they had also come to learn that, in the recent past, their early suspicions of appointees who seemed too close to industry and/or government had been misplaced. This was the case, for example, for Tom Wheeler’s position at the helm of the FCC in the U.S. in 2013, where the initial fear was that his previous role as the CEO of the Cellular Telecommunications and Internet Association was akin to putting the fox in charge of the henhouse. Instead, Wheeler turned out to be a strong, public interest oriented head of the FCC for the rest of the Obama Administration. Likewise, in Canada, there was concern that putting Daniel Therrien, a former national security specialist in the Harper Government, in charge of the Office of the Privacy Commissioner (OPC) in 2014 would end up being a terrible mistake. They were wrong, by and large, and the OPC under Therrien has taken on issues that confounded early expectations, and with impressive results. He has also held the current Liberal Government’s feet to the fire with respect to its lackluster legislative proposals on this front while also leading the charge for strong, human rights-based approaches to privacy and data protection rules fit for a new phase of communications and Internet regulation.
Today, whatever goodwill had existed for the leader of the CRTC has run dry, due to the record of Ian Scott’s actions as helmsman of the regulator. While the lessons of those other appointments outlined a moment ago were taken seriously by critics, would-be competitors and public interest groups for Scott’s first few years at the helm of the Commission, his track record has proven disastrous for progressive public policy in communications.
It important, however, that the blame not be placed only on one person. The fact is, the Trudeau Government appointed Ian Scott to lead the CRTC, knowing full well that he had been a Telus executive and industry lobbyist. It is also the Liberal Government that has refused to overturn the direction he has taken the CRTC in. Moreover, the Liberal Government has treated incumbent cable and telecoms operators with kids’ gloves by adopting weak standards by which it has favourably judged the meagre price reductions realized for a select, few mid-range mobile wireless plans—i.e. those with data allowances between 2 and 6 GB per month—even though those reductions compare poorly against international trends (see, for example, Rewheel, 2021; Wall Communications, 2021).
Traditional and Digital Audiovisual Media Services (AVMS): From Ad-Supported Content Media to Fast Growing Subscription-based Digital Media
The remainder of this report shifts gears to examine ongoing developments in the media content sectors—also referred to as the AVM sectors—in the context of the following thee over-arching trends:
- the explosive growth of online advertising;
- Although advertising spending has remained fairly fixed relative to the size of the Canadian economy for decades, since 2012 it has fallen by about 10% per annum. This translates into a loss of, roughly, $1.5 billion in advertising spending across all media per year since then. Cumulatively, this means that $11.6 billion has, in essence, vanished between 2013 and 2020. As a result, traditional media sectors (i.e. broadcast TV and radio, newspapers, and magazines) and firms that depend mainly on advertising as the core of their business model are battling internet giants like Google and Facebook for a shrinking pool of revenue. The results have been devastating. Seen in this light, it should be obvious that laying the blame solely on “the vampire squids” from Silicon Valley for such losses is simplistic.
- In reality, though, the core of the media economy is not advertising but a rapidly growing group of pay-per media and digital AVMS that are based primarily on subscriber fees and direct payments. Revenue for the pay-per (subscriber) based communications and media sectors outstrip that of advertising-supported media 5:1.
These over-arching trends, in turn, are taken up in relation to an analysis of the following digital and traditional audiovisual media services (AVMS) that make up the content media sectors of the media economy:
- Internet advertising
- broadcast TV
- pay and specialty TV
- online video subscriber and download services such as Netflix, Crave, Amazon Prime Video, Rogers SN Now, Disney+ and Illico
- radio
- music, including recorded music, live concerts and revenues from publishing royalties
- online music subscription and download services such as Apple iTunes and Spotify
- online gaming, gaming applications, game downloads or in-game purchases
- app stores (e.g. Google Play and Apple Appstore)
- newspapers
- magazines
- online news
Anchor Findings
• Online advertising continues to grow rapidly, with nearly all growth captured by Google and Facebook.
• Regulators must contend with the consequences of this duopoly not only in online advertising, but also to curb their ability to leverage that dominance into adjacent media sectors.
• The digital duopoly dominance is entrenched and has been consolidated over the last decade.
Overall advertising spending has been hurt badly by unsteady economic conditions since 2008, and this was compounded by the economic contraction last year brought about by the Covid-19 pandemic. At the same time, however, online advertising has continued to surge ahead, even last year. By last year, Internet advertising revenue in Canada reached an estimated $9.7 billion—up from $8.8 billion a year earlier and now worth more than four times what it had been a decade ago.
Google and Facebook have been the biggest beneficiaries of this soaring growth, with estimated advertising revenue of $4.9 billion and $2.9 billion, respectively, in 2020. Google accounts for half of the Internet advertising market, while Facebook’s share is approaching the one-third mark. Together, they controlled four-fifths of the online advertising market in Canada in 2020—up significantly from a little over two-thirds share of the market just five years ago.
Moreover, a majority of the new growth in Internet advertising revenue has ended up in their coffers, although the pace of this trend has been down substantially in the two most recent years from previous years when Google and Facebook took four-out-of-five dollars in new growth. In short, the digital duopoly’s grip on the online advertising market is tightening, enduring and entrenched.
These are all key considerations that have motivated a series of recent public inquiries and regulatory actions in Australia, the UK and the U.S. and justify actions that aim to lessen or break-up the foundations of Google and Facebook’s dominance. Such actions include decisions already taken or proposals on the table that they be required to adopt new forms of operational separation—i.e. between Google’s search functions and suite of services on the one side and digital ad exchange, on the other, or between Facebook, WhatsApp and Instagram, for example—or to spin-off operations that underpin their stranglehold over much of the online services and advertising system.11 In Germany, the principle of operational/data separation was implemented in 2019 and survived Facebook’s unsuccessful court challenge to this measure.12
We will address such issues more fully in the next report.
Open the lens wider to examine adverting spending in all media, e.g. Internet, television, radio, newspapers, magazines and out-of-home—and the picture, however, is more complicated.
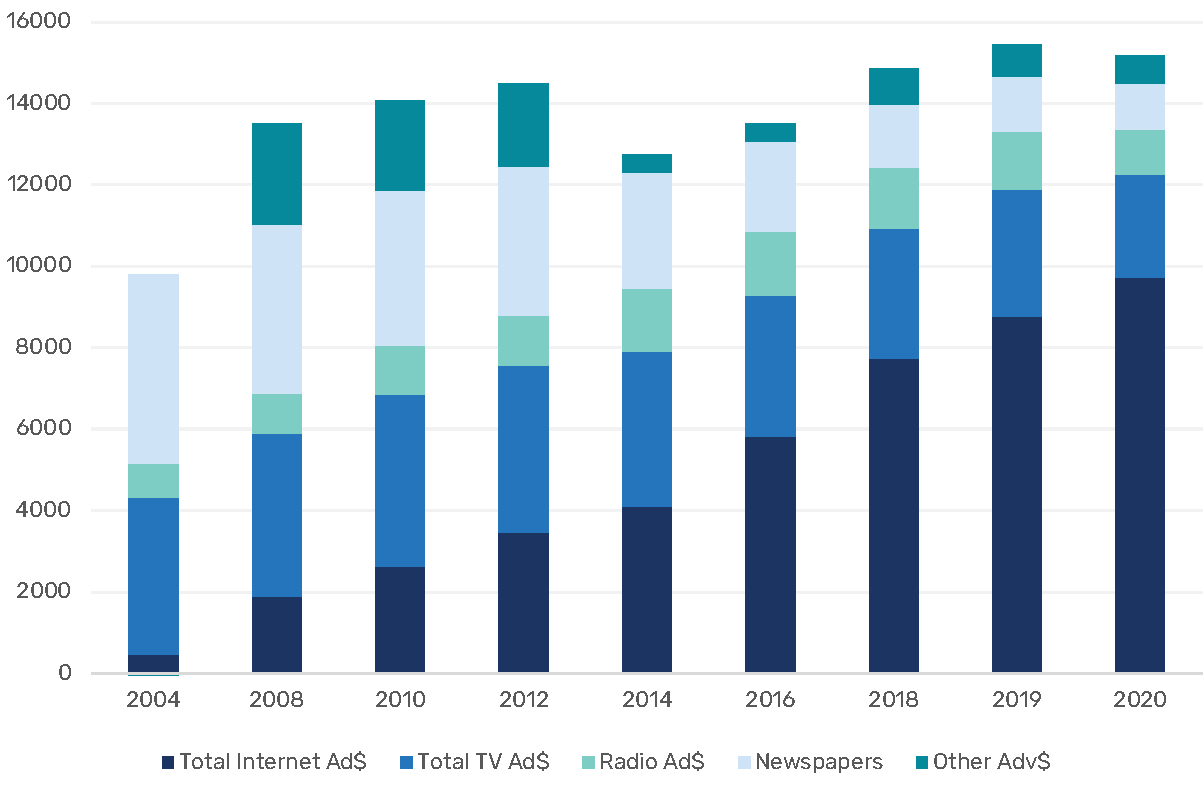
First, total advertising spending in Canada last year was $15.2 billion, down $300 million from the year before. Figure 17 illustrates the point. Yet, even this substantial drop masks a harsher reality: take out online advertising where growth continued apace, albeit at a slower pace than usual, and ad spending across the rest of the media landscape plunged by 18.5%. This was disastrous for media sectors and firms where advertising is the core of their business.
The upshot of these developments is that the collapse of advertising spending outside of online advertising amidst the Covid-19 pandemic further solidified Google and Facebook’s emergence as the two biggest recipients of ad revenue in Canada. Together, they accounted for just over half of the advertising market last year, up from just over a third in 2017. As the digital duopoly lock in their grip on the advertising market, other major players in Canada are falling further into the rearview mirror.
The largest such player, Bell, by comparison, attracted just 8.3% of all advertising spending in Canada last year, down a percentage point from the year before. Rogers and Shaw also saw their share of the advertising market slip to 4.5% and 3.6%, respectively.
All told, these changes have propelled Google into being the fourth largest company operating in the media economy in Canada, after Bell, Telus and Rogers; Facebook is seventh after Shaw and Quebecor. Together, the top five Canadian media companies based on advertising receipts—Bell, Rogers, Shaw, Quebecor and the CBC—saw their collective share of total advertising spending tumble from just under a quarter in 2019 (23.9%) to less than one-fifth last year (18.3%).
These trends represent a substantial change from just a few years ago. Take, for example, the fact that in 2017, by the lights of two conventional measures of market concentration—concentration ratios and the HHI—the advertising market was one of the most competitive relative to all other sectors of the communications and media economy that we analyze. By 2020, that was no longer true. Instead, Google and Facebook’s control of more than half the market was a clear indicator of a consolidating duopoly, while the CR4 score of 64% and an HHI of 1518, respectively, revealed high- to moderate levels of concentration, and with a rapid upward tendency.
In sum, concerns about Google and Facebook’s dominance of the advertising market in Canada, and calls for firm measures to do something about that, are fully supported by the evidence. We will address this issue in much greater detail in the next report.
Within Canada and globally, Google’s dominance of online advertising is girded by the fact that it has vertically integrated its search and online advertising functions with its own proprietary digital advertising exchange (and the buying and selling of advertising inventory on both sides of that exchange), to say nothing of the dominant position it holds in relation to mobile and desktop browsers, the Android mobile operating system, and Google Play app store (typically in duopolistic rivalry with Apple in each of these areas). The cornerstone in Google’s sprawling reach across the Internet stack, however, is the online advertising system that it has assembled through a series of acquisitions over the last decade (e.g. DoubleClick, AdMob, etc.). By assembling its own online advertising exchange, Google has, in essence, erected a walled garden around its services as well as the buying and selling of audiences and advertising inventory on the Internet, a stark contrast from its early promise to help people navigate the ‘open Internet’ and to slay the walled gardens that had emerged in the late- 1990s.
While Facebook does not have its own digital advertising exchange, both it and Google share the fact that they control the common currency used to buy and sell audiences and advertising inventory online: detailed knowledge of their audiences. Each firm also has its own audience measurement and rating system that allows them to control the terms of trade upon which the online advertising system functions.13 By controlling the building blocks of the online advertising system both companies are able to effectively hold third party advertising campaigns hostage because neither of them interconnect with one another, or with other digital platforms. Consequently, advertising campaigns, and the data, costs, and labour behind them, are not portable between competing advertising exchanges, thereby allowing Google and Facebook, in effect, to use this control to hold audiences and advertisers hostage. This raises the prospect of using mandated data portability, network interoperability and interconnection obligations to put a dent in their dominance(another point we will return to in the next report).
For its part, Facebook had 21.5 million users in Canada at the end of 2019 and revenue of $2,614 million. The company has benefitted in particular from the shift from “desktop Internet” to the mobile Internet. Thus, while Facebook had only a few dozen people working on the mobile Internet version of its app as late as 2012, by the end of that year it had done an about face as it acquired Instagram and set out to make the mobile Internet its new frontier of expansion. As a result, the mobile version of Facebook’s service is now the centre of the company’s operations.
The growth rate for the number of people using the company’s three main services—Facebook, Instagram and WhatsApp—in Canada has been swift over the past decade but it has slowed in recent years. Slowing growth in the size its user based has not caused revenue growth to stall, however, because Facebook has focused on sharply increasing the monetary value of each user. And it has succeeded at this as well. The annual average revenue per Facebook user (ARPU) in Canada last year was $130.74—triple what it was five years ago and thirteen times what it was in 2011.
Figure 15 below depicts the growth of Facebook’s revenue and ARPU in Canada since 2011.
Figure 15: Facebook’s Revenue and Average Revenue Per User (ARPU) Soar, 2011-2020
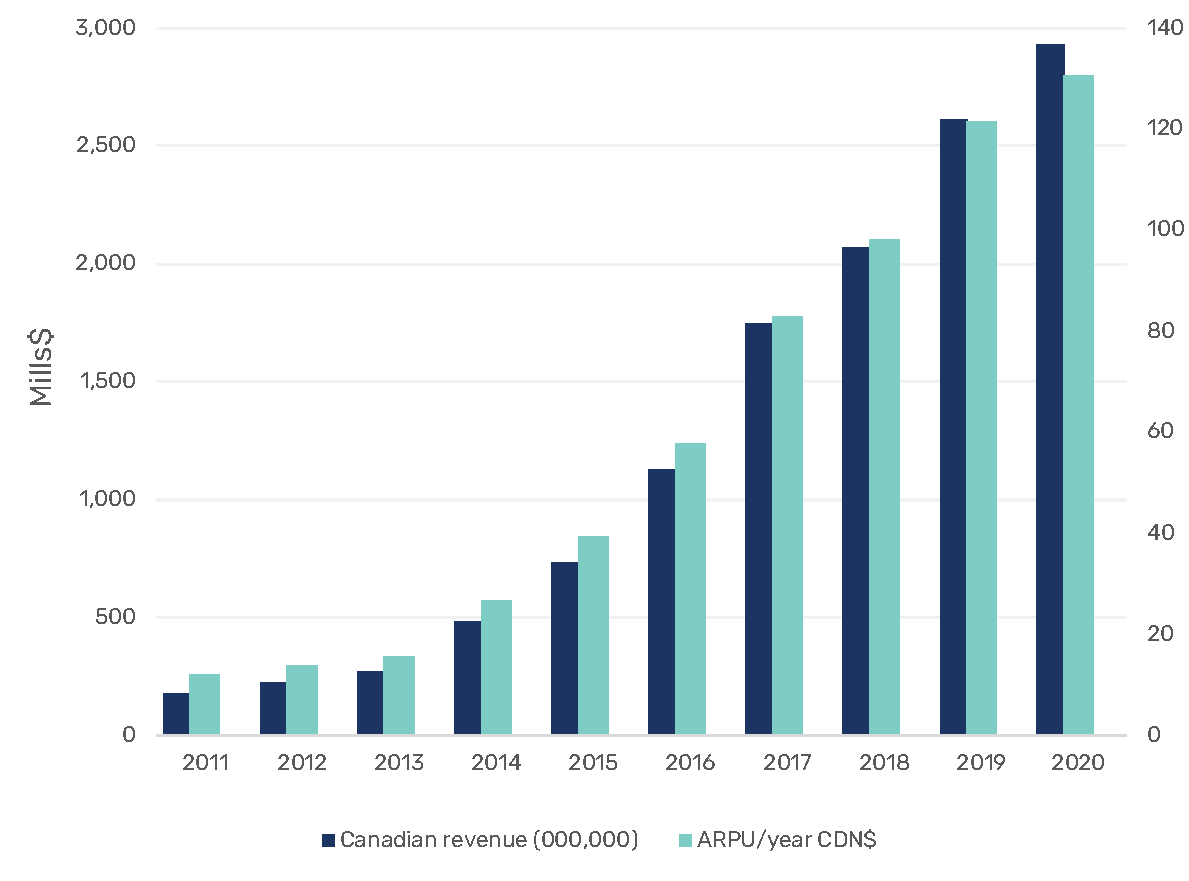
Source: see “Facebook Revenue” sheet in the Excel Workbook.
In sum, Google and Facebook have become major players in Canada in a short period of time. The duopoly they initially formed in the Internet advertising market has now expanded to encompass the whole advertising market.
Based on these trends, it has become an article of faith in many quarters that Google and Facebook are the primary cause of an existential crisis besetting the media in Canada, writ large. While such charges might seem to be compelling at first blush, they are superficial and deeply misleading.
This is because, first and foremost, there is no general crisis of the media. To the extent that there is one, it is limited to four media sectors that have historically relied almost entirely on advertising revenue: broadcasting television, radio, newspapers and magazines. These media sectors are in trouble. Collectively, revenue for these sectors has plummeted by close to $6 billion since 2008 and by 2020. Total revenue across these four sectors is now roughly half what it had been a dozen years ago. This trend is unlikely to turn around any time soon. Figure 16 illustrates the wreckage.
Figure 16: The Rise and Fall of Advertising-funded Media, 1984-2020 (millions, current$)
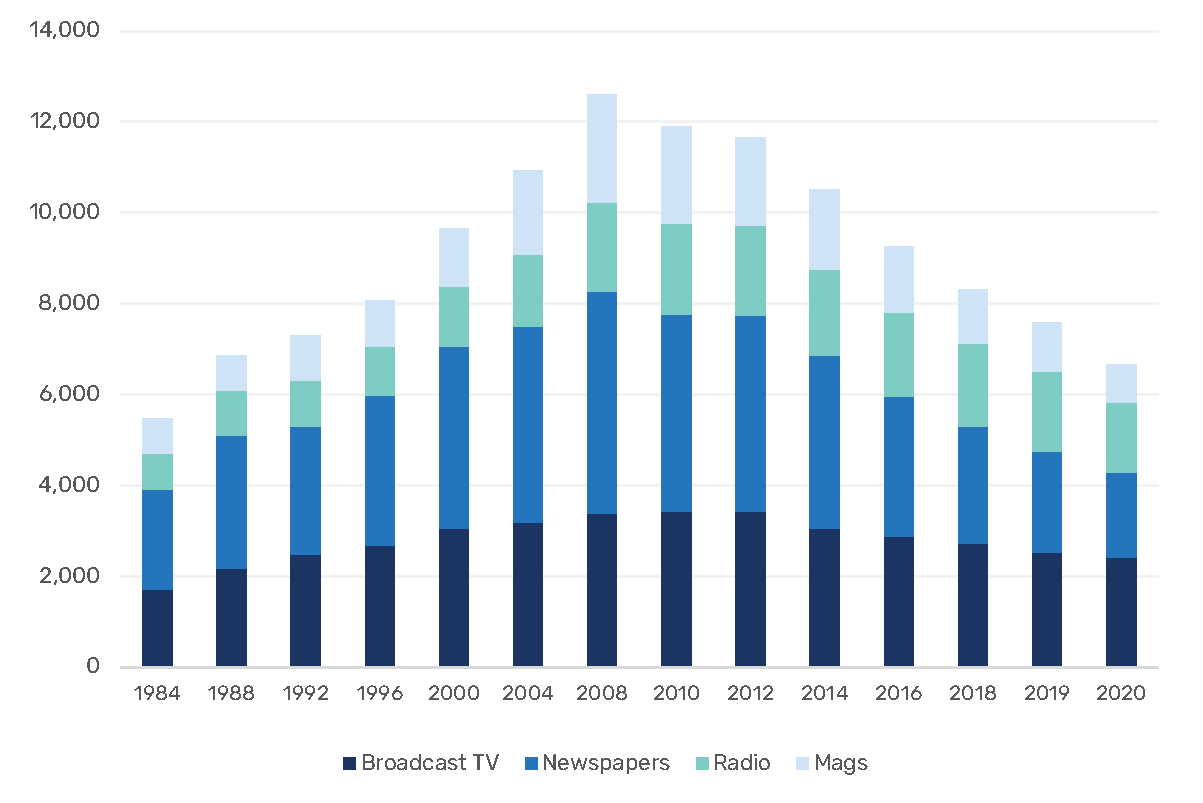
Source: see “Total Revenue” sheet in the Excel Workbook.
Why is this? It is primarily because advertising spending—and thus the fate of advertising-funded media—tracks the fate of the economy in lockstep fashion (see Picard, Garnham, Miege, and Vogel). When the economy is buoyant, advertising revenue rises; when the economy slumps, advertising revenue falls.
This can be seen by tracking advertising spending since 2008, for example, the year that the financial crisis swept much of the world. Over the next year, advertising spending dropped by a little over a half a billion dollars from $11.5 billion. That lost ground was recovered in 2010. Thereafter, advertising spending for all media in Canada hovered in the $12-13 billion range for the next five years, before edging upwards, in fits and starts, to $15.5 billion in 2019, before contracting again last year (in current dollars). If you switch the metric to real dollars, the story is even grimmer, with revenue hovering between $13 and $14 billion from 2008 to 2016 before inching upwards again to $15.5 billion in 2019, before sliding again last year (i.e. CAGR of .94%).
The result of such anemic conditions was the loss of approximately $1.5 billion in advertising revenue per annum relative to what it would have otherwise been had “normal” growth rates held steady. Another way to look at this is to consider a hypothetical case where average advertising spending as a percentage of GDI stayed the same as it was before tanking. Based on this view, we can estimate that there has been a loss of roughly $11.6 billion over the last eight years or so. To make matters worse, these losses have taken place exactly as Google and Facebook were locking in their monopoly power over the online advertising system and, consequently, what remains from the stagnating/shrinking base of advertising spending in the country. This phenomenon is not unique to Canada but can also be seen in Australia, the United Kingdom and the U.S. and probably elsewhere, too.14
Figure 17 below reveals the period of relatively low to no growth between 2010 and 2016, and the slow increase for the next few years after that before advertising revenue once again tanked in 2020.
Figure 17: The Stagnating Advertising Economy, 2004-2020, (real $ 2020, millions)
Source: see the “Advertising Revenue All Media” sheet in the Excel Workbook.
The story for advertising-funded media is grimmer yet when we consider advertising spending on a per capita basis. Looking at advertising revenue on a per capita basis (in real dollars), advertising spending fell sharply from $407.60 per person in 2008 to $384.80 a year later. It then bounced around at relatively low levels of growth for the next decade, before finally returning to its previous levels since 2017. Last year, however, that small glimmer of hope was once again dashed as advertising spending on a per capita basis fell below $400 again—a negative CAGR of .175% over the last dozen years.
Zeroing in on advertising earmarked solely for television is also telling. Whereas advertising spending on television hovered around $120 per person (in real dollars) during most of the first decade of the 21st Century, it has slid continuously and significantly over the last decade. It was $67.10 per capita last year.
The fortunes of Internet advertising, of course, have run in exactly the opposite direction, skyrocketing five-fold from $57 per person in 2008 to $255.70 last year. Figure 18 below depicts these points.
In 2020, advertising spending was $420.10 per capita—a negative CAGR of .175% over the last dozen years.
Figure 18: A Ceiling for Ad Spending?: Advertising Spend per Capita, 2004-2020 (real$ 2020)

Source: see the “Advertising Revenue All Media” sheet in the Excel Workbook.
Figure 19 below also reveals a pattern of stagnating or shrinking advertising spending relative to the size of the network media economy over the last decade. In this case, advertising spending levels are lower today than they were fifteen years ago.
Figure 19: Ad Spend as a Percentage of the Network Media Economy, 2004-2020

Source: see the “Advertising Revenue All Media” sheet in the Excel Workbook.
Lastly, the downward pressure on advertising can also be seen in terms of GDI, as shown in Figure 20 below. Historically, advertising spending as a portion of the Canadian economy has stayed relatively fixed at roughly .68 to .7% of gross domestic income (GDI), a rate, incidentally, that is roughly half that of the United States, probably serving as an index of the less commercialized character of the media and society in Canada relative to the US. In 2020, however, after nearly a decade of anemic and unsteady economic growth, this measure, too, still sat at the lower ends of that range.15
Figure 20: Ad Spending as a Percentage of Canadian Gross Domestic Income, 2004- 2020
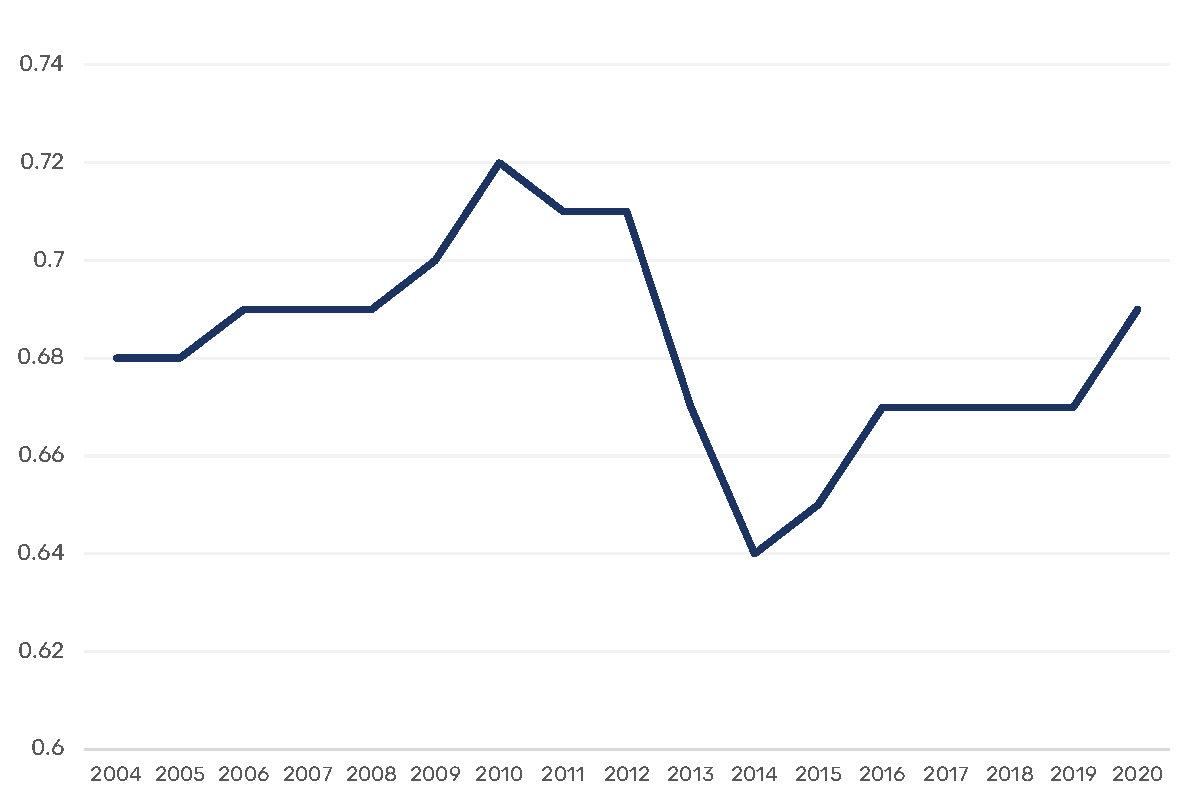
Source: see the “Advertising Revenue All Media” sheet in the Excel Workbook.
The upshot of these observations cannot be understated. The dire situation faced by those media sectors and firms that rely mainly on advertising revenue reflects the hard reality that they have been caught between the pincers of more than a decade of stagnating or, on some measures, declining advertising revenue, from the one side, and the rapid rise of Google and Facebook, who have been taking an ever greater share of advertising spending, on the other. Today, they take over four-fifths of online advertising spending and just over half of advertising spending across all media in Canada.
Unfortunately, analysis and discussion in both academic and policy circles for the past several years—a discussion, it should be noted, that apes the talking points first established by commercial media firms and their lobby groups earlier this decade in defense of their own “bigness” before being picked up in academic and policy circles has focused excessively on the impact of Google and Facebook while being completely ignorant of these structural conditions stemming from the ongoing crisis of capitalist economies since 2008 and the depressing impact that has had ever since on advertising spending as a result.16 As such, academic and policy analyses, and the regulatory remedies they propose, are badly flawed and, consequently, not likely to work even if they are adopted.
While Google and Facebook are undoubtedly implicated in the dire situation faced by those media sectors and firms that rely primarily on advertising revenue as the centre of their business models, they are not the primary cause of it.
The excessive focus on advertising-funded media, however, overlooks the reality that while advertising continues to be the most significant source of revenue for the media content sectors, it is steadily being eclipsed by subscriber fees and direct payments. For example, revenue for specialty and pay TV services doubled in the last decade to $4.4 billion in 2016, before tapering off to $3.9 billion last year. Subscriber fees now account for three-quarters of revenue for such services, while advertising dollars make up the rest, and have receded in significance over time, Simultaneously, subscription-based and download video and music services as well as online games, app downloads and app stores are rapidly becoming the engines of growth across the AVMS sectors. The combined revenue for these sectors soared eight-fold from $560 million to $5.4 billion between 2011 and last year. Taken in their entirety, the fast-growing revenues for these sectors demonstrates that there is no general crisis of the media in Canada. In fact, content media sectors have grown immensely over time: their revenue in 1984, was $5.6 billion; last year it was $26.3 billion.
Figure 21 below depicts the long-term growth of the content media sectors over the period covered by this project.
Figure 21: Rising Revenues for the Content Media Industries, 1984-2020 (current $, millions)
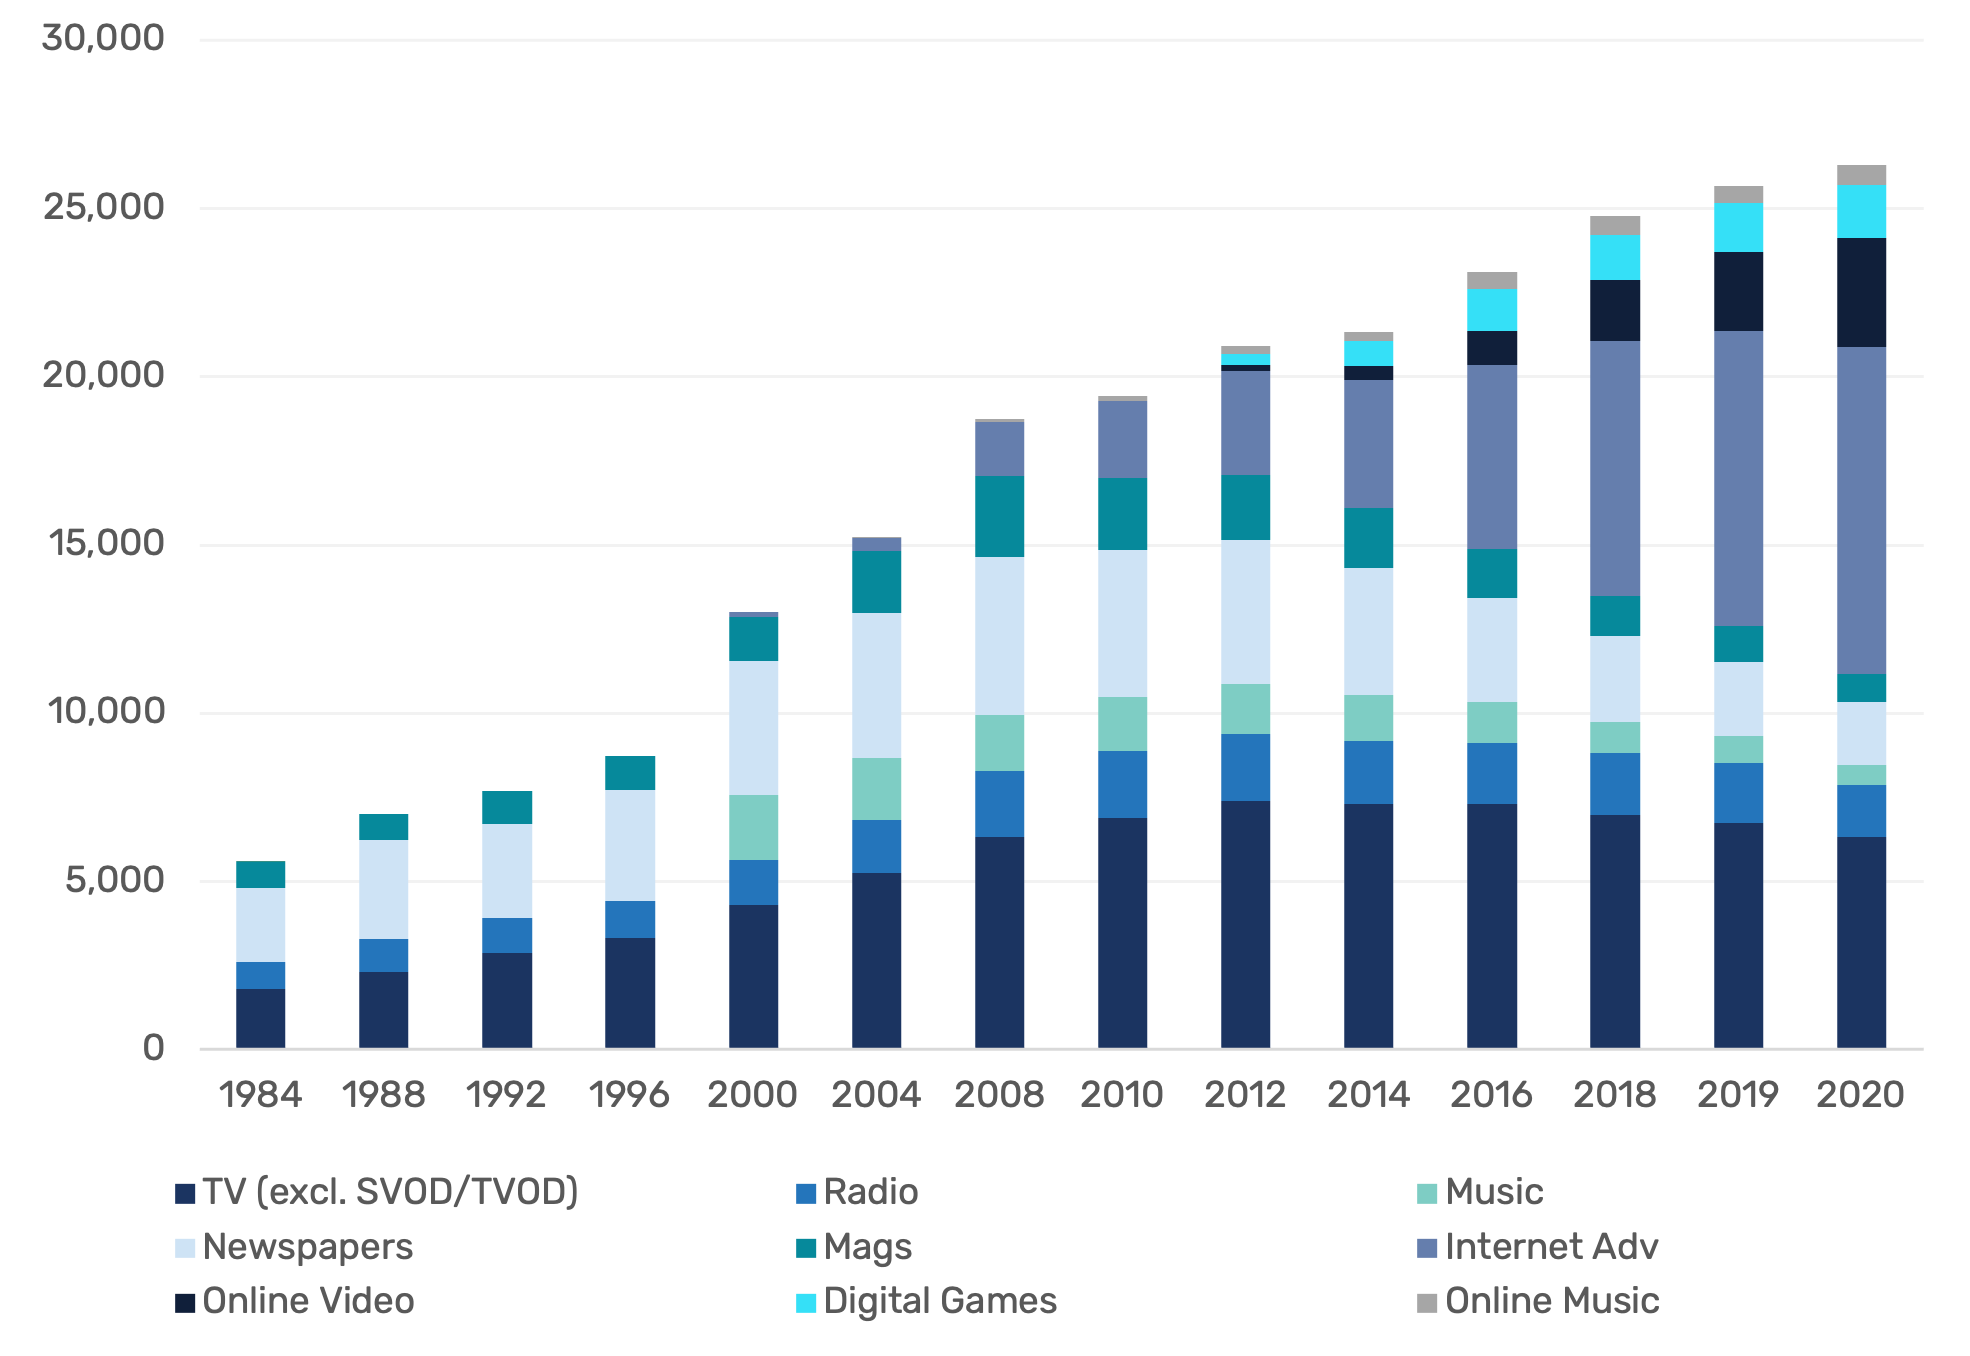
Source: see the “Total Revenue” sheet in the Excel Workbook.
The following pages examine the different segments of the content media in more detail while extending the analysis from the above focus about advertising-funded media to those that rely mainly on subscriber fees and direct payments.
For the past quarter-of-a-century, many observers have announced the imminent demise of television. That has not come to pass. Instead:
- People are watching as much television as ever; they’re just doing so across a much wider range of connections and devices.
- Revenue across all television services—broadcast television, cable and satellite television services and online video services—has risen substantially from $6.3 billion to $9.6 billion since 2008.
- How television services are paid for has been utterly transformed. In 1984, television revenues were split three ways between advertising dollars, the Parliamentary subsidy for the CBC and subscriber fees 60/37/3 percent, respectively; in 2000, advertising had grown to account for nearly two-thirds of all revenue, while the rest was split fairly evenly between subscriber fees and the CBC subsidy; as of last year, subscriber fees accounted for two-thirds of all revenue, while advertising had slipped to account for one-quarter, and public subsidies had shriveled to account for just seven percent of all revenue.
- Television and film production in Canada, the US and the European Union have been at record highs for several years running to meet the burgeoning demand for televisual content needed to fill the enlarged audiovisual media universe.
The fact is, television has not died but has rather been utterly transformed and given new life. Some scholars now refer to the rise of “connected television” to capture this dynamic and ongoing process.17 The range of services and how we connect to those services has exploded; a decade ago, broadcast television was supplanted by specialty and pay cable and satellite channels while the latter are set to be upstaged by a growing range of online video services such as Netflix, Crave, Amazon Prime Video, Disney+, Gem and Club illico in the next few years.
These wrenching transformations have affected different elements of the television landscape in very different ways. For broadcast television, the story is one of decline. Advertising for broadcast television grew fairly steadily until reaching a high point of $2.5 billion in 2010 and 2011, but thereafter went into a long-term decline. Last year, advertising revenue for broadcast television fell to $1.5 billion. Indeed, the Covid-19 pandemic piled punishment upon on an already beleaguered industry, with the loss of one-fifth of broadcast television’s advertising revenue in 2020 alone.
The shift of some advertising dollars to specialty cable and satellite channels such as Discovery, TSN, RSN, the Cartoon Network, and so forth has helped to recover some of the slack, but overall advertising across the total TV landscape has declined from a high of $3.8 billion in 2011 to $2.3 billion last year—a drop of one-third over the decade.
Similar trends are also playing out in the radio sector. Revenues peaked in 2011, at just over $2 billion (including the CBC’s parliamentary appropriation), but have fallen steadily since, reaching $1.54 billion last year (current dollars). As a result, nearly two-dozen radio stations have been shut down or not had their licenses renewed by the CRTC between 2009 and 2020. Many of these operations were community-, university- and Indigenous-owned and operated station. While a half-dozen radio stations have been launched during this same period, they hardly fill the gap.18
Cut-backs by the previous Conservative Government to the CBC of $126 million after 2012, and the loss of $121.1 million in payments from the Local Program Improvement Fund after 2013 until it was phased out completely by 2015, further compounded the woes facing the public broadcaster and commercial broadcast television stations earlier this decade.19
To bring a broader perspective into the depth of the cuts to public subsidies over time, consider that, in the early 1980s, the Parliamentary subsidy for CBC television and radio services made up 27% of total broadcasting funds in the system; last year, public subsidies accounted for less than a third of that amount. Today, television and radio services are no longer subsidized by public funds and advertising but largely paid for directly out of household income. This is a radical transformation in the economics of television.
Returning to a focus just on broadcast TV revenues, including the CBC and its annual Parliamentary funding, such revenue slid from an all-time high in 2011 of $3,501.7 million to $2,518.6 million last year—a drop of nearly a third. As a result of these trends, eleven local TV stations have been shuttered since 2009: CHCA (Red Deer), CKNX (Midwest ON), CKX (Brandon), Sun News (Toronto), CKRN and CKRT (Rivière du Loops), Rogers Peel TV and three of its Omni affiliates in BC, Alberta and Ontario, and another station in Kenora (CJBN) that was closed by Shaw in 2017. There have also been substantial cut-backs in local news programming at many local television and radio stations across the country, as chronicled by April Lindgren and John Corbett’s ongoing Local News Map project.20
Alongside these trends, job lay-offs and cut-backs have become a constant theme. Between 2012 and 2015, for example, local news staff at broadcast TV stations was cut by 4%.21 A study prepared by Peter Miller (2015) for the Friends of Canadian Broadcasting and Unifor estimated that half the local TV stations in fifty-six small and mid-size cities across Canada, and 900 jobs, could be lost by 2020 if the major policy changes advocated by the report were not adopted (pp. 14-15). In retrospect, the prediction with respect to the closure of local stations was overexaggerated, but the number of broadcast television jobs has, in fact, fallen from 5,789 to 4,668 between 2015 and 2020, a drop of 20%.22
Combined, the local television station closures that have occurred, the steep drop in advertising revenue, the withdrawal of public subsidies, and the very sizeable job cuts all add up to a portrait of a crisis in local and network television broadcasting. Given that they are very significant sources of original news, this is also a crisis of journalism.
These conditions have been severe enough to have spawned several reviews of the state of local news and journalism in recent years. Two such reports, one by the CRTC in 2016 and another by the Canadian Heritage Parliamentary Committee a year later, added further insights into the situation facing local newspapers and broadcasting but ultimately struggled to propose workable solutions to the problems at hand. That said, they were part and parcel of efforts in many quarters that led the Liberal Government to add $675 million later in 2016 to the CBC’s annual funding envelope spread out over the next five years. These new funds countered the cuts to the CBC undertaken by the previous government, but they do not come close to off-setting the decline in advertising revenue at the CBC.
To get a measure of just how far things have fallen with respect to public service media over the long-run, it is useful to recall the federal funding to the CBC accounted for 28% of television and radio revenue in the early 1980s; today it makes up less than a third of that amount (i.e. 8%). Restoring even half of the amount lost would add over a billion in support of public service media. Such a step would also go a long way to bringing public funding levels in Canada closer to their counterparts in the EU and to offset the crisis of original news creation. That this route has not be taken is a political choice and one that all parties have been unwilling to make.
The Broadcasting and Telecommunications Legislation Review Panel and The Broadcast Act Reform Bill (Bill C-10): the Perils and Pitfalls of Building a New Phase of Internet Service Regulation on Flawed Analyses and Premises
The most significant development with respect to addressing these challenges has been the Broadcasting and Telecommunications Legislative Review Panel, which presented its Canada’s Communication Future: Time to Act report in 2020. The third chapter of that report, in particular, covers the terrain being discussed here. The BTLR panel’s report, like the Miller, Heritage Committee and CRTC reports before it, paints a dismal portrait of the Canadian media landscape and pins the blame for this state of affairs squarely on Google, Facebook and unregulated online streaming services in Canada, to which it proposes sweeping regulatory remedies and a much-expanded CRTC to oversee the implementation of those changes with the aim of injecting new vitality into the media system.
The report does open some far-reaching and intriguing discussion of electronic communication services in earlier chapters. These elements, and the recommendations that flow from them, however, have been all-but ignored in public discussion and by the subsequent legislation, Bill C-10, the Broadcasting Act reform bill, introduced in November 2020 which selectively drew on the BTLR panel’s ideas about Canadian content and broadcasting. While the targeted goal of bringing streaming television, film and music services such as Netflix, Crave, Amazon Prime Video, Disney+ and Spotify under the Broadcasting Act could be a good thing, in this author’s view, the bill has ignited a fierce debate over the future of Internet regulation as well as media and cultural policy in Canada, and for good reason.
We will return to the BTLR report’ recommendations and the Broadcasting Act reform bill later in this report and the next one in our two-part series. For now, though, it is worth highlighting a half-dozen basic and common flaws in both the report and Bill C-10 that flowed out of it.
First, chapter 3 of the report, which focuses on the woes facing the Canadian broadcasting “system”, cherry picks evidence with the aim of pushing its preferred policy agenda. Its presentation of data is selective and partial insofar that it highlights those sectors of the media—i.e. broadcast television and original news—that are in trouble, while ignoring others that are doing reasonably well, or thriving.
Second, in so doing, the report wrongly presents the limited crisis that applies to advertising-supported media—broadcasting television, radio, newspapers and magazines—as if they are an index for a general crisis of the media. As we have shown above and will continue to show in the following pages, no such general crisis of the media exists.
Third, this tendency to over-reach is evident in the BTLR’s recommendations as well to sweep, in essence, all forms audiovisual and text-based media content, including news content (newspapers) made available to the public over the Internet under the Broadcasting Act and the CRTC’s oversight, unless the Commission explicitly decides otherwise. To this end, the BTLR report recommends that the scope of programming undertakings be expanded to include three broad categories of services:
- Media curation undertakings: broadcasters, pay TV services (HBO), SVOD (Netflix, CraveTV, illico, Amazon Prime, Disney+), TVOD (Apple iTunes, Appstore, Google Play) and branded Youtube channels, Spotify, news
- Media content aggregators: cable, satellite and IPTV; virtual BDUs, StackTV, MSN News, Yahoo! News, Google Search?
- Media content sharing services: Facebook, Youtube (amateur and professional), Reddit (Recommendation 54).
From the BTLR Panel’s Report to the Broadcasting Act reform bill: How cherry-picked data and poor analysis leads to flawed proposals for a new phase of Internet services regulation
Bill C-10’s fatal flaw, arguably, was to follow the BTLR’s recommendation regarding the broad categories of content that it would cover, albeit with some minor adjustments. This gave rise to the perception that the bill sought not just to meet the defensible goal of bringing the big international and domestic online video services such as Netflix, Amazon Prime Video, Crave, Disney+, etc. under the Broadcasting Act and the CRTC’s authority but that it could also encompass content uploaded to social media, even if the individuals who did so would not be directed regulated. In fact, as a a memo from the Department of Canadian Heritage shows, even those crafting the bill don’t know. The memo, obtained by National Post journalist Anja Karadeglija, states that what will be defined as a regulated online broadcasting service “is something that the CRTC will need to work out over time, and injects further uncertainty into the analysis.” Consequently, the memo continues, the discussion around this core issue—just what constitutes broadcasting and a broadcast program—is “necessarily speculative.”23
This ambiguity ultimately proved fatal and it is important to remember that the taproot of that ambiguity is the BTLR’s excessively broad framing of the range of human expression and programming that should be brought within the ambit of a renewed broadcasting regulatory regime. This issue will not go away and, indeed, the newly re-elected Liberal Government promises to introduce a new bill to similar ends within 100 days of its coming into office in September 2021. To avoid a replay of the ideologically-driven debates on this subject from all sides the next time around, the Government may want to more narrowly tailor its remit.
Doing so would also help to bring any new bill to regulate online video services in Canada more in line with the European Union’s more tightly drawn Audiovisual Media Services Directive, which targets only large service providers and subjects online video services to less demanding funding and catalogue quota and promotion obligations than linear broadcasting services while also excluding sharing services and amateur created content. The AVMS is also integrated into a more holistic approach to communications, Internet and cultural policy that includes measures to strengthen net neutrality, a presumption against more consolidation in communications markets, promote rights portability so that people can access services they subscribe to wherever they are in the EU, pan-EU wireless roaming and the relatively strong privacy and data protection measures of the General Data Protection Regulations.
Ultimately, that the BTLR report and the ensuing Bill C-10 did not narrowly tailor its ambitions led to both being perceived as a power grab by incumbent interests and as threats to freedom of expression on the grounds that they both propose to subject an overly broad range of human expression made available over the Internet to the restrictive standards of broadcasting content regulation versus the more permissive view that applies to publishing, speech and other forms of human expression. Seen from this angle, those who argue, like Philip Palmer, that any attempt by the government to regulate the Internet would prove to be unconstitutional versus those like Peter Grant, who argues that the federal government has the authority to regulate the Internet, are probably both wrong and right but for different reasons.24
In this author’s view, the federal government likely has the authority to regulate Internet services, as Grant says, but unlike his view and in support of Palmer, the central challenge is whether it can treat all forms of expression made accessible over the Internet as broadcasting programs, as Bill C-10 attempted to do and, therefore, regulate them by the more restrictive, lower standards of charter protection given to broadcasting relative to almost all other forms of speech, ie press, text, speech? On this question, the answer is likely no.
Fourth, the report doubles down on a denunciation of Google, Facebook, Netflix, Amazon, and so forth as the sole, or at least the primary, source of these alleged woes. Graphs, figures and charts are presented with dates that typically start in 2010 or 2012 so as to conform to the story the report wants to tell and that pins the blame on the “web giants”, rather than showing that, for instance, revenue for those sectors that are in trouble generally peaked well before those years and before Netflix was even available in Canada or Facebook and Google had become the formidable players they now are.
Fifth, alternative explanations that might, for instance, highlight the stagnation and/or decline of ad-spending since 2008 are nowhere to be found. In addition, that some of the reasons for the troubles that do exist might have arisen from self-inflicted wounds, such as debt-funded waves of consolidation and vertical integration over the past quarter-of-a-century are not broached, although there can be no doubt that such factors played at least some role in bringing about conditions now in front of us.
Finally, the BTLR panel report sidesteps another important question: why are the conditions of broadcast TV in Canada so poor relative to conditions in the US and some other countries? To put this another way, while broadcast TV is not thriving anywhere, the turmoil in Canada is especially severe. Why? The BTLR report offers no discussion of this whatsoever.
The Plight of Broadcasting Television in Canada versus International Experience
One factor that goes a long way to explaining why Canada stands out for the bleak state of affairs facing its traditional television sector is that all of the biggest commercial broadcast TV as well as pay and specialty TV services are owned by large vertically- and diagonally-integrated communication conglomerates, i.e. Bell, Shaw (Corus), Rogers and Quebecor. In fact, Canada stands alone from its international peers in terms of its extraordinarily high levels of diagonal and vertical integration across the network media economy.25 On this point, the BTLR report is silent; while the chair of the CRTC acknowledges the situation, he downplays its significance with his assertion that “this trend toward vertical integration was not unique to Canada” (Scott, 2019). While the broad trend is not unique, the scale of it in Canada most certainly is.
In the US, by contrast and for example, broadcast TV ownership groups are sizeable, independent entities in their own right; notable examples include CBS, Sinclair, TEGNA, E.W. Scripps, Gray, Nexstar, Univision, Walt Disney, Fox, and Media General. Other than Disney (the ABC network) and Fox, broadcast TV ownership groups tend not to also own a fleet of specialty and pay TV services–again, unlike Canada—where all of the large commercial broadcast TV as well as pay and specialty TV services are owned by the same players, e.g. Bell, Shaw (Corus), Rogers and Quebecor. Moreover, other than Comcast’s ownership of NBC Universal, none of the main broadcast TV ownership groups in the US are owned by telecoms companies or BDUs. This seemed to change somewhat after AT&T’s take-over of a raft of pay television services, including HBO, when it acquired Time Warner in 2018. However, that move proved to have been ill-advised and the renamed Warner Media was spun-off by AT&T into a joint venture with Discovery in 2021, possibly as a stepping-stone to a complete sale by AT&T of its stake in the venture.26 Conditions similar to those in the US also hold true in Europe.
As a result of their structural independence,27 broadcast TV ownership groups in other countries are compelled to compete vigorously on their own—they sink or swim on the merits of their service. In addition, the predominance of distinct broadcast TV and pay TV ownership groups in the US that are generally not owned by telecoms carriers and/or BDUs means that such services do not function as smaller and less profitable divisions with giant telecoms operators forced to operate with one eye fixed on their competitors and the other on ensuring that whatever competitive strategies they adopt do not side-swipe other aspects of their vertically and diagonally-integrated telecoms-Internet and TV operations.
It is also critically important to emphasize that the heart of the commercial television business model in Canada relies on its biggest player, Bell, buying up exclusive, long-term rights to marquee US programming from the likes of Warner Media, Starz and Showtime.28 Simultaneously, investment in domestic and in-house broadcast television production has been languishing for years.29 At a time when content producers are increasingly offering their programming direct to consumers over the Internet, the days left in a model that piggybacks Canadian production in this way are numbered, to so the least. These observations distinguish the relatively healthy and stable state of local broadcast television in the U.S. from the dire conditions faced in Canada in at least three ways.
First, while broadcast television revenue in Canada has tanked over the last decade, in the US it has stayed relatively buoyant. In fact, broadcast television revenue rose from $24.3 billion to $33.6 billion from 2013 to 2019. Television advertising has also fared much better as well, rising from $19.4 billion to $23 billion over the same period. In addition, the number of US households that are broadcast-only has steadily risen from 10% in 2015 to 14% in 2020. Most of those households also subscribe to one or more online video services, suggesting that the two may act as compliments rather than substitutes for many people given the right market conditions. In addition, broadcast network affiliates’ and independent TV stations’ “total day share of viewing” has increased from 30% in the 2012-2013 to 33% in the 2015-2016 season, while prime time viewing rose from 33% to 36% over the same period.30
Second, since broadcast television stations are usually not vertically-integrated into cable and telecoms companies in the US and Europe, they have more incentives to pursue a major additional source of revenue over and above advertising revenue: retransmission fees. In the US, retransmission fees have risen from a quarter to a third of broadcast television stations’ revenue over the past half decade and continue to grow, albeit at a slightly slower pace in recent years. In Europe, retransmission fee rates vary from 10% in Belgium up to a third in some Scandinavian countries, while in the UK, retransmission fees are zero and broadcasters even pay Sky, the dominant pay-television distributor, for carriage. In Canada, an attempt to introduce a “value-for-signal” regime earlier this decade was defeated as the integrated BDUs, satisfied with the status quo, resisted the idea that their cable operations would have to pay into the broadcast TV operators’ coffers.31 This arrangement effectively cuts off a revenue stream in Canada that is clearly making a significant contribution to the success of broadcasters abroad.
Third, because of their independent ownership, stand-alone broadcast TV services in the US compete vigorously with specialty and pay TV services as well as online video rivals like Netflix, Hulu, CBS All Access, Disney+, Viacom-owned PlutoTV and Amazon Prime. Consequently, the US broadcasters are more eager to exploit the opportunities of putting their programming online to allow audiences to watch programs from anywhere using any device and to engage in “catch-up” viewing outside the constraints of the over-the-air broadcast schedule than their Canadian counterparts. Putting programming online also opens a new line of advertising revenue that they have exploited to far greater extent than Canadian broadcasters.
This latter point has one added benefit: online advertising has contributed more to the bottom line of broadcast television stations in the US than in Canada, growing from 5% of their revenue in 2012 to 8% by 2017 where it has stayed since. In Canada, by contrast, online ad revenue for television services was about 6% in 2019.32
In sum, common ownership of distribution and broadcast services has taken significant sources of revenue off the table for broadcasters in Canada. Canada’s major commercial television companies have also built a business around buying and brokering access to imported, US content, and this model is not likely to last as the sources of that content increasingly go direct to consumers over the Internet. In other words, the structure of the television industry in Canada and the business model around which it has been developed has no doubt contributed to the severity of the woes now facing this once-central pillar of the Canadian broadcasting “system”.
For all the woes affecting broadcast TV, the overall TV universe continues to expand and to offer people a richer and more diverse range of choices. Looking beyond the Cassandra calls of domestic incumbent-friendly policy rhetoric, one quickly discovers vibrant, new centres of development from both within Canada and without. However, and as has been emphasized throughout this report, to understand where the real growth in television is, and the dramatic transformations that are taking place, we must look to pay-per and internet-based streaming and download audiovisual media services. This is not unique to Canada but applies equally to the US, UK and many other countries around the world.
The UK regulator, Ofcom, has underscored this point for the past several years: “Subscription revenues [worldwide] continue to be the key driver of this growth, rising by 5.4% to reach £125bn, just over half of total revenue”, with a cumulative annual growth rate of 5.3% over the last five years.33 As Of report observes, “Pay TV remains the largest source of TV revenue across comparators” (p. 97). In its most recent Communications Market Report, Ofcom () observes, “growth in online video advertising and SVoD revenue offset declines in pay TV and TV advertising revenue” (p. 3). From a big picture perspective, the same applies to Canada.
Once we widen the lens to look at the fastest growing areas of television, it is clear the chorus of voices declaring the supposed “death of television” are singing off key. Pay and specialty TV services are a case in point and have done extremely well since the first licenses were issued in the early 1980s. The number of such services operating in Canada soared after the turn-of-the-21st Century and their revenue eclipsed that of broadcast TV in 2010. Revenue for pay and specialty TV services appears to have peaked at a high of $4.4 billion in 2016, however, and since then, a number of services have been shuttered and revenue has slipped to $3.9 billion last year. Today, the new engine of growth is shifting to online video streaming and download services.
Yet, as with broadcast television, the high levels of vertical integration between telecoms and cable operators, on the one side, and pay TV services, on the other, and diagonal integration between both broadcasting and pay TV services, has compromised the business viability of pay television services in several respects. First, as we saw a moment ago for broadcast TV, in the US, UK and Europe, where high-levels of vertical and diagonal integration do not hold sway, pay TV providers have been quicker to unbundle specialty and premium pay TV services from an underlying cable subscription and to make them available over the Internet. Examples include Time Warner’s HBO (although this, too, was momentarily clawed back during Time Warner’s brief integration into AT&T), Disney’s ESPN and Disney+, several services owned by Viacom-CBS, and major sports leagues like the NFL and MLB. As AVM service providers only, these operators’ goal is simple: to get their programming before as many people across as many platforms as possible with less concern that offering their services over the Internet and mobile wireless networks might cannibalize the subscriber and revenue base of an affiliated BDU—at least not to the same degree, since BDUs are still their main source of revenue.34
In short, the highly consolidated and integrated structure of the television market in Canada discourages the development of stand-alone video-on-demand services delivered over the Internet by the big four vertically-integrated communications and media conglomerates, i.e. Bell, Shaw, Rogers and Quebecor. Thus, HBO in Canada, for example, is currently locked up with Bell under an exclusive contract that runs until 2025, and is only available through Bell’s online video service, Crave. All-in-all, the big four vertically-integrated carriers in Canada owned more than 100 of the most lucrative pay TV services last year, and accounted for four-fifths of all revenue in this sector.
The “big four” are not only loath to offer their own specialty and pay TV services on a stand-alone basis, but their approach also constrains the actions of independent operators. In fact, services like Crave, Shomi (now defunct) and Club illico were only made available on a stand-alone basis after the CRTC prodded them into doing so.35
Returning to independent television services, when they contract for carriage with a BDU they essentially provide two services for one wholesale rate. The first service is the linear channel which is bundled with other channels and marketed by the BDUs, and for which they get a per subscriber fee and a pledge to reach a certain percentage of subscribers. At the same time, independents’ second service—their “On-Demand” content, including that which is delivered over the Internet—is essentially given away for free to the BDUs who use it as part of a “bundle” to retain subscribers rather than treating it as a new line of revenue. Obviously, this sacrifices a potentially lucrative new stream of revenue in the name of preserving the “cable-centric broadcasting system” around which Canada’s cultural policy has been built since the 1970s.
By giving away their on-demand content “for free” in this way, independent pay TV services essentially abandon the potential to earn additional revenue from one of their most attractive assets: online access to their programming from anywhere, using any device. Moreover, they are trading dimes on the potential dollars that they might obtain from going with an online VOD service such as Apple or Amazon. However, with seventy percent of homes in Canada still subscribing to a BDU service, independent television services still require carriage on those services to gain access to their biggest potential audience.
In sum, the policy-driven state of consolidation and exceptionally high levels of vertical integration has put Canada into an undesirable league of its own. In so doing, what was supposed to be a panacea for Canada’s supposedly small media economy has, in fact, hobbled the business viability of television services significantly. Under the current arrangements, the benefits of choice and agency for users, as well as potential new streams of revenue and distribution opportunities for smaller players in the industry, are sacrificed in favour of preserving a handful of vertically- integrated “national champions” who stand astride the communications and broadcasting system in Canada. They may present themselves as guardians of Canadian culture when in fact they more closely resemble jealous gatekeepers preserving their own interests.
Lastly, the structure of the communications and television landscape in Canada also gives rise to one other crucial condition that continues to hobble the advent of online video subscription services. In this respect, it is important to note that not only are all the major commercial television services owned by telecoms companies but there are no stand-alone mobile wireless operators left after Shaw acquired Wind (now rebranded as Freedom) in 2016. This is important because, without a stand-alone, competitive mobile phone operator, prices for mobile phone service and data tend to be higher and data caps significantly lower, and the cost of exceeding them steeper. The upshot is that the steep price of data, restrictive data limits and expensive overage charges deter the use of new media to consume all forms of audiovisual content, including broadcast TV.36 Forward looking communication and media policy should pay close attention to these considerations and evaluate what has been gained and lost by tying the fate of audiovisual media services to vertically-integrated national champions.
In order to complete the picture of the “Total TV Universe” we now examine online video subscription and download services. At the outset, however, it must be acknowledged that doing so is difficult given the dearth of reliable publicly available information, both from the service providers (e.g. Netflix, Amazon Video, Apple, Bell’s Crave or Rogers’ SN Now) as well as the CRTC. That said, it is possible to develop sound estimates based on these companies’ annual reports, recent changes to how Netflix reports its operating results to US regulators, taking into account year-over-year growth for other providers and using publicly available information.37
Since Netflix first entered Canada in late 2010, many new players have joined the fray. As of 2020, significant online video services included Netflix, BCE’s Crave, Google’s YouTube Premium and YouTube TV, Amazon Prime Video, Rogers SN Now, Apple TV+ and iTunes, Club illico, CBC Gem, Disney+, CBS All Access and Dazn, while a few services, such as Rogers and Shaw’s joint venture, shomi, have exited the scene. New players continue to enter the country at a fairly rapid pace. The analysis in this report, however, focuses on the biggest online video services operating in Canada in 2020.
In 2020, estimated revenue for the online AVM services market in Canada reached $3.2 billion, up from $2.3 billion the year before. Growth continued to be swift, with a compound annual growth rate of 36% and revenues nearly quintupling from $698 million over the past five years, although the growth rate has slowed in recent years.
Netflix is the biggest online video service player in Canada by far.38 At the end of 2020, Netflix had 7.23 million subscribers in Canada, up nearly 610,000 over the previous year. As a result, nearly half of all households (49.2%) in Canada subscribed to Netflix by the end of 2020. The company’s Canadian revenue reached $1.1 billion last year, up from $831.47 million the year before, and nearly triple what it had been just five years earlier.
Bell’s streaming service Crave is the second largest SVOD service in Canada. Last year it had 2.8 million subscribers at year end and estimated revenue of $486 million. This was up considerably from 2.6 million subscribers the previous year and revenues of $441 million. Google’s YouTube Premium and YouTube TV comprise the third largest online video services in Canada, with combined revenue across both services last year reaching $443.7 million, an increase of $103 million over the previous year (not include its advertising-supported YouTube service, whose revenues we include under online advertising).
After entering Canada near the end of 2019, Disney+ grew rapidly in 2020. By year’s end, it was the third largest online video service in the country with an estimated 2.5 million subscribers and revenue of $266.2 million. This was similar to the estimated revenues for Apple’s Apple TV+ and iTunes services ($238.2 million), Amazon Prime Video ($224.3 million) and Rogers’ SN Now ($211.46 million), respectively. Add the estimated revenues for DAZN ($115.53), Quebecor’s illico ($55.7 million), CBS All Access and CBC Gem/ICI Tou TV ($13.6 million), respectively, and the total revenue for the AVMS sector in Canada in 2020 amounted to $3.2 billion.
Figure 22 below depicts the revenues of the significant online video services in Canada last year.
Figure 22: Online Video Subscription and Download Services in Canada, 2012, 2015 and 2020 (current$, millions)
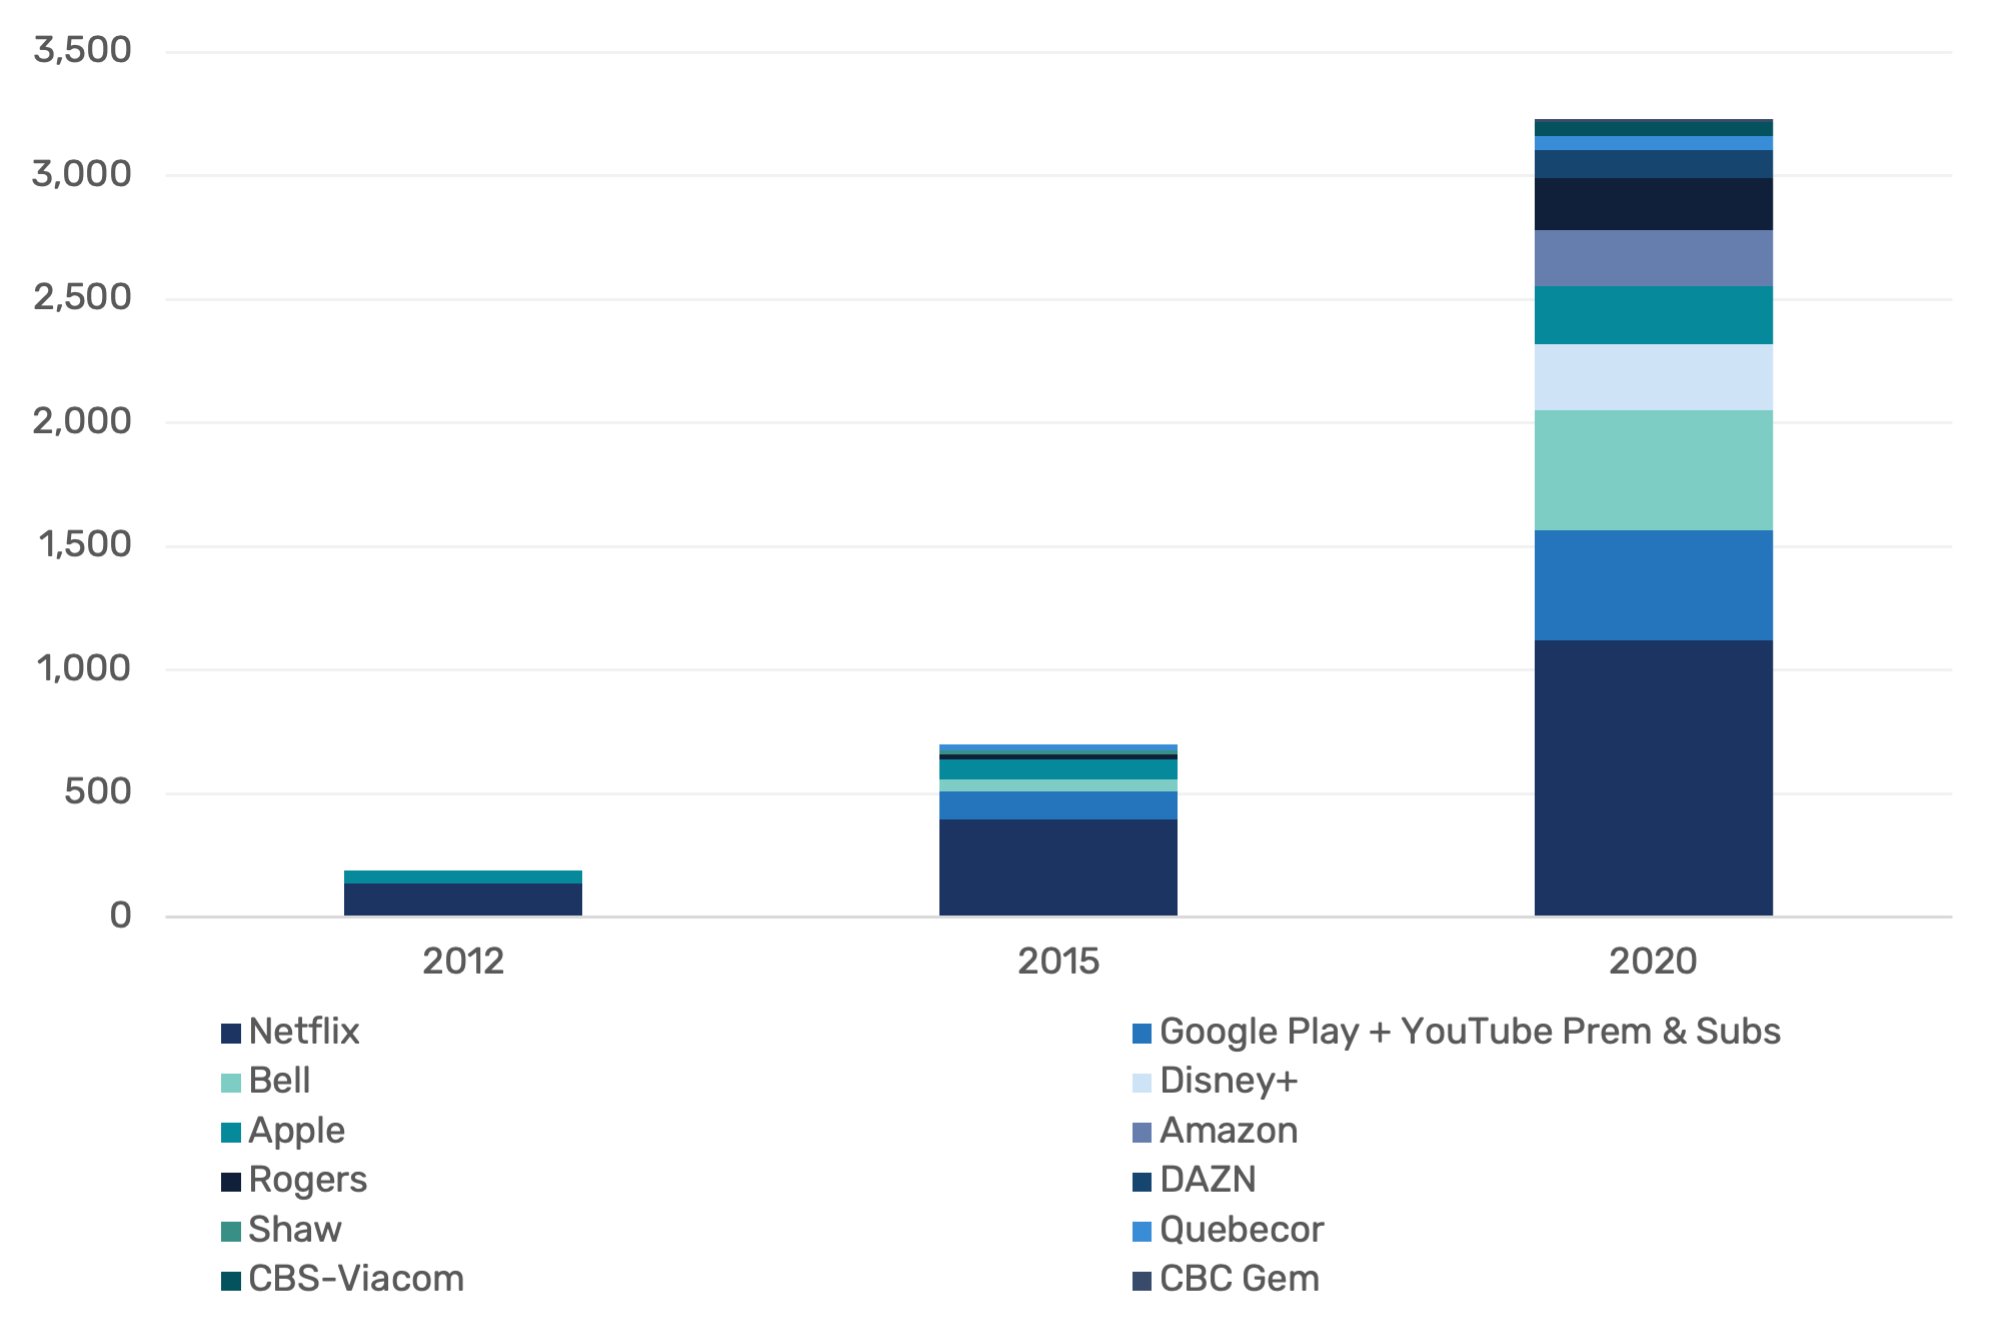
Source: see the “Online Video Services” sheet in the Excel Workbook.
For several years running, our estimates have diverged significantly from those that the CRTC has published in its annual Communications Monitoring Report.39 While the Commission has provided some useful insights into the fast-paced growth of Netflix, Amazon Video, Apple’s iTunes, etc., its estimates for the revenue and subscriber numbers for foreign online AVMS providers have been implausibly high.
Netflix’s own recent changes to its reporting methods, in fact, reveal that the CRTC’s estimate for the streaming service’s revenue in Canada of $1,643 million in 2018, for example, was double what the company itself has disclosed. The same assumptions that led to these inflated results also underpin the Commission’s estimates the other foreign streaming and download video services it covers: Amazon Prime Video, Apple, Microsoft Movies & TV, Google Play, and so on. Curiously, it does not publish results for domestic services such as Bell’s Crave, Quebecor’s Club illico, Rogers SN, and the CBC’s Gem, furthering the impression that the data is being selectively presented. It also unduly handicaps independent research.40
Beyond questions about the veracity of the CRTC’s numbers, we are also concerned that its estimates are being used as a kind of “threat inflation” that serve its own interests in bureaucratic expansion while also playing into the hands of those who claim that the scale of international online video service operations pose a mortal threat to Canadian broadcasters and to Canadian culture. At the same time, the publication of such erroneous estimates under the CRTC’s imprimatur gives them a sheen of legitimacy that others trade on in the context of domestic policy battles over what a new era of Internet services regulation in Canada should like. This is, for example, what the Broadcasting and Telecommunications Legislative Review Panel’s (2020) Canada’s Communications Future report does as it recycles the Commission’s inflated estimates for foreign streaming services to justify its recommendations as to why and how online video services should be regulated.41 That roadmap, in turn, animates the proposed revisions to the Broadcasting Act tabled by the Liberal Government in late 2020.42
Putting these differences aside, based on the evidence that we do have, the television marketplace overall is thriving, even if some of its elements (e.g. broadcast TV) are in deep trouble. Looking at the big picture that includes broadcast TV, pay TV services as well as online video services, and an unmistakable picture emerges: people are watching as much television as ever, although just what we are watching, and how, has changed dramatically. Similar patterns apply to the US, United Kingdom and elsewhere.43 At the same time, people are paying more than ever for the pleasure of doing so, with total TV revenue growing five-fold from $1.8 billion in 1984 to $9.6 billion last year.
Figure 23 below takes this big picture approach to illustrate the growth of the total television marketplace over time.
Figure 23: Growth & Upheaval in the Canadian Television Landscape, 1984-2020 (current$, millions)
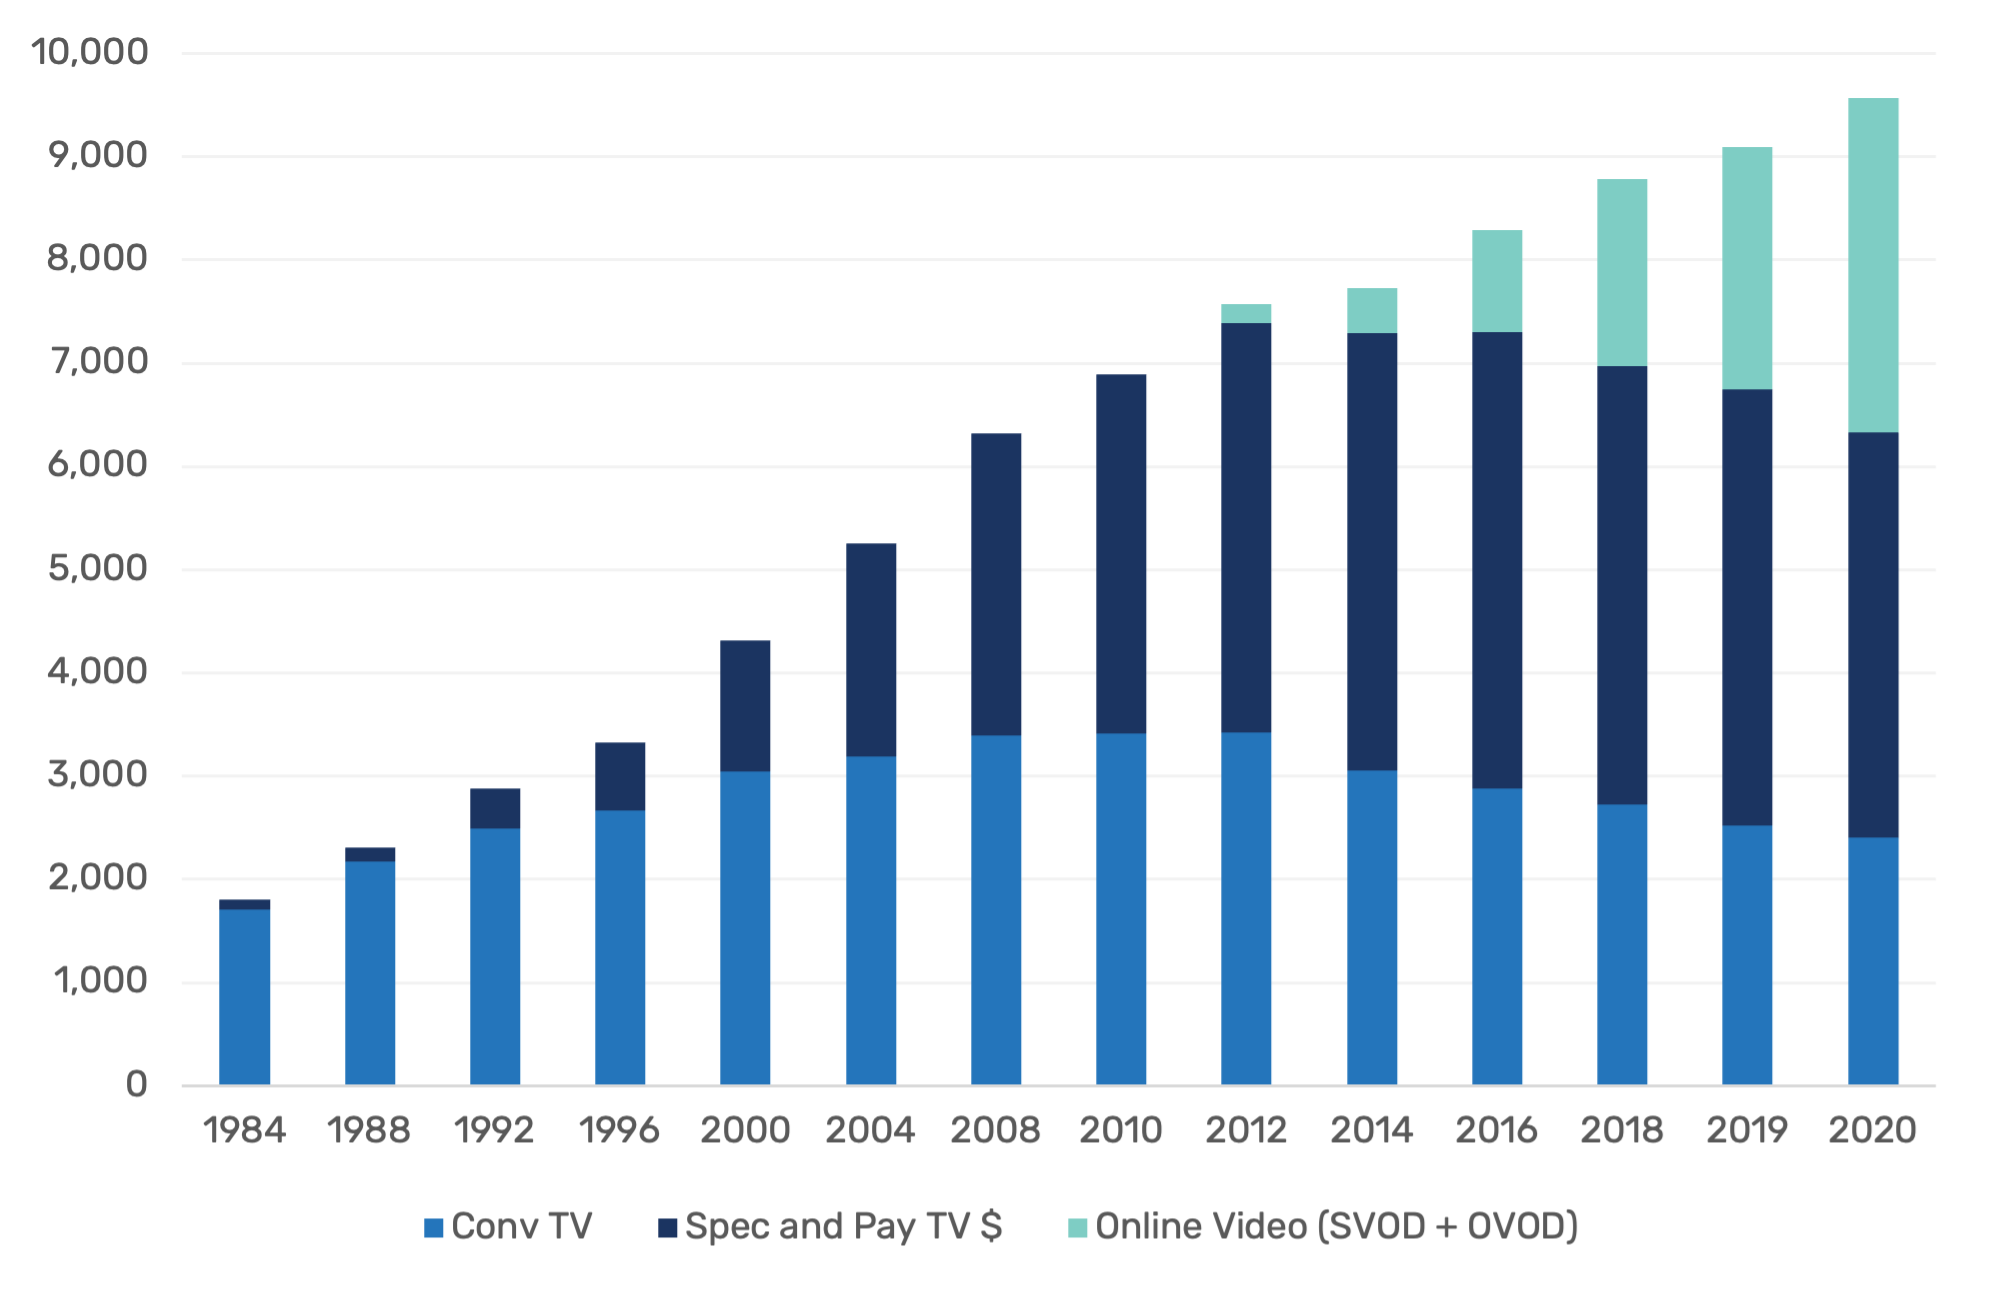
Source: see the “Total Revenue” sheet in the Excel Workbook.
The changes that have taken place in the last decade alongside the rise of the Internet are, indeed, significant. For instance, Netflix’s share of all TV revenue has grown from zero nearly a decade ago to more than 12% last year. It is now the third largest television operator in the country, after Bell and the CBC, just ahead of Rogers and Shaw (Corus), and more than two-and-a-half times the size of Quebecor. Add in Google YouTube Premium & YouTube TV, Disney+, Apple’s Apple TV and iTunes, Amazon Prime Video and CBS All Access, based on our estimates, the big six US-based digital AVMS giants had a combined revenue from online video services last year of $2.35 billion in Canada, or about one quarter of all revenue combined across the broadcast television, pay and specialty service and online video services market.
In sum, the online video services have added immensely to the size and diversity of the TV market, and their revenue still continues to climb strongly (more on this in the next report in this series). Nonetheless, the combined revenue of the big six US digital media companies still falls below that of the biggest TV operator in Canada, Bell, whose revenues last year from these services topped $2.4 billion. That said, as major US and international television and film companies go direct-to-consumer, the long-standing model in Canada whereby companies such as Bell, Rogers, Shaw (Corus) basically broker access to Canadian audiences on behalf of foreign program services is fast becoming redundant.
The fact that TV services based on subscriber fees (rather than advertising) continue to grow briskly even in the face of economic headwinds over much of the last decade also reveals another crucial point: the TV business has shifted to the direct pay-per model. Subscriber fees, as noted at the outset of this report, are now the centre of the content media universe, and this is especially true for television, where advertising’s share of revenue since the turn-of-the-21st Century has shrunk from accounting for about two-thirds of all revenue to one quarter last year. This is also important because the pay-per model is more resilient to economic shocks compared to advertising revenue, although this shift raises pressing questions in terms of affordability and inequalities of access after nearly a century of policies that have tried to foster universal and affordable broadcasting services.
If we add cable, satellite and IPTV distribution to this portrait the trend is clear: sum up all the elements of “Total TV” and TV distribution sectors and the TV marketplace accounted for nearly $17.7 billion in revenue in 2020 based on our figures, or $19.6 billion if the CRTC’s estimates are used.44 To put it another way, in 1984, all segments of the TV industry combined accounted for 13% of revenue across the media economy. That figure is now 20%–a clear indication all-the-same that television is still a main pillar of the Internet- and mobile-centric media universe. Figure 24 illustrates the trends.
Figure 24: Television at the Centre of the Network Media Economy Universe, 1984- 2020 (current $, millions)
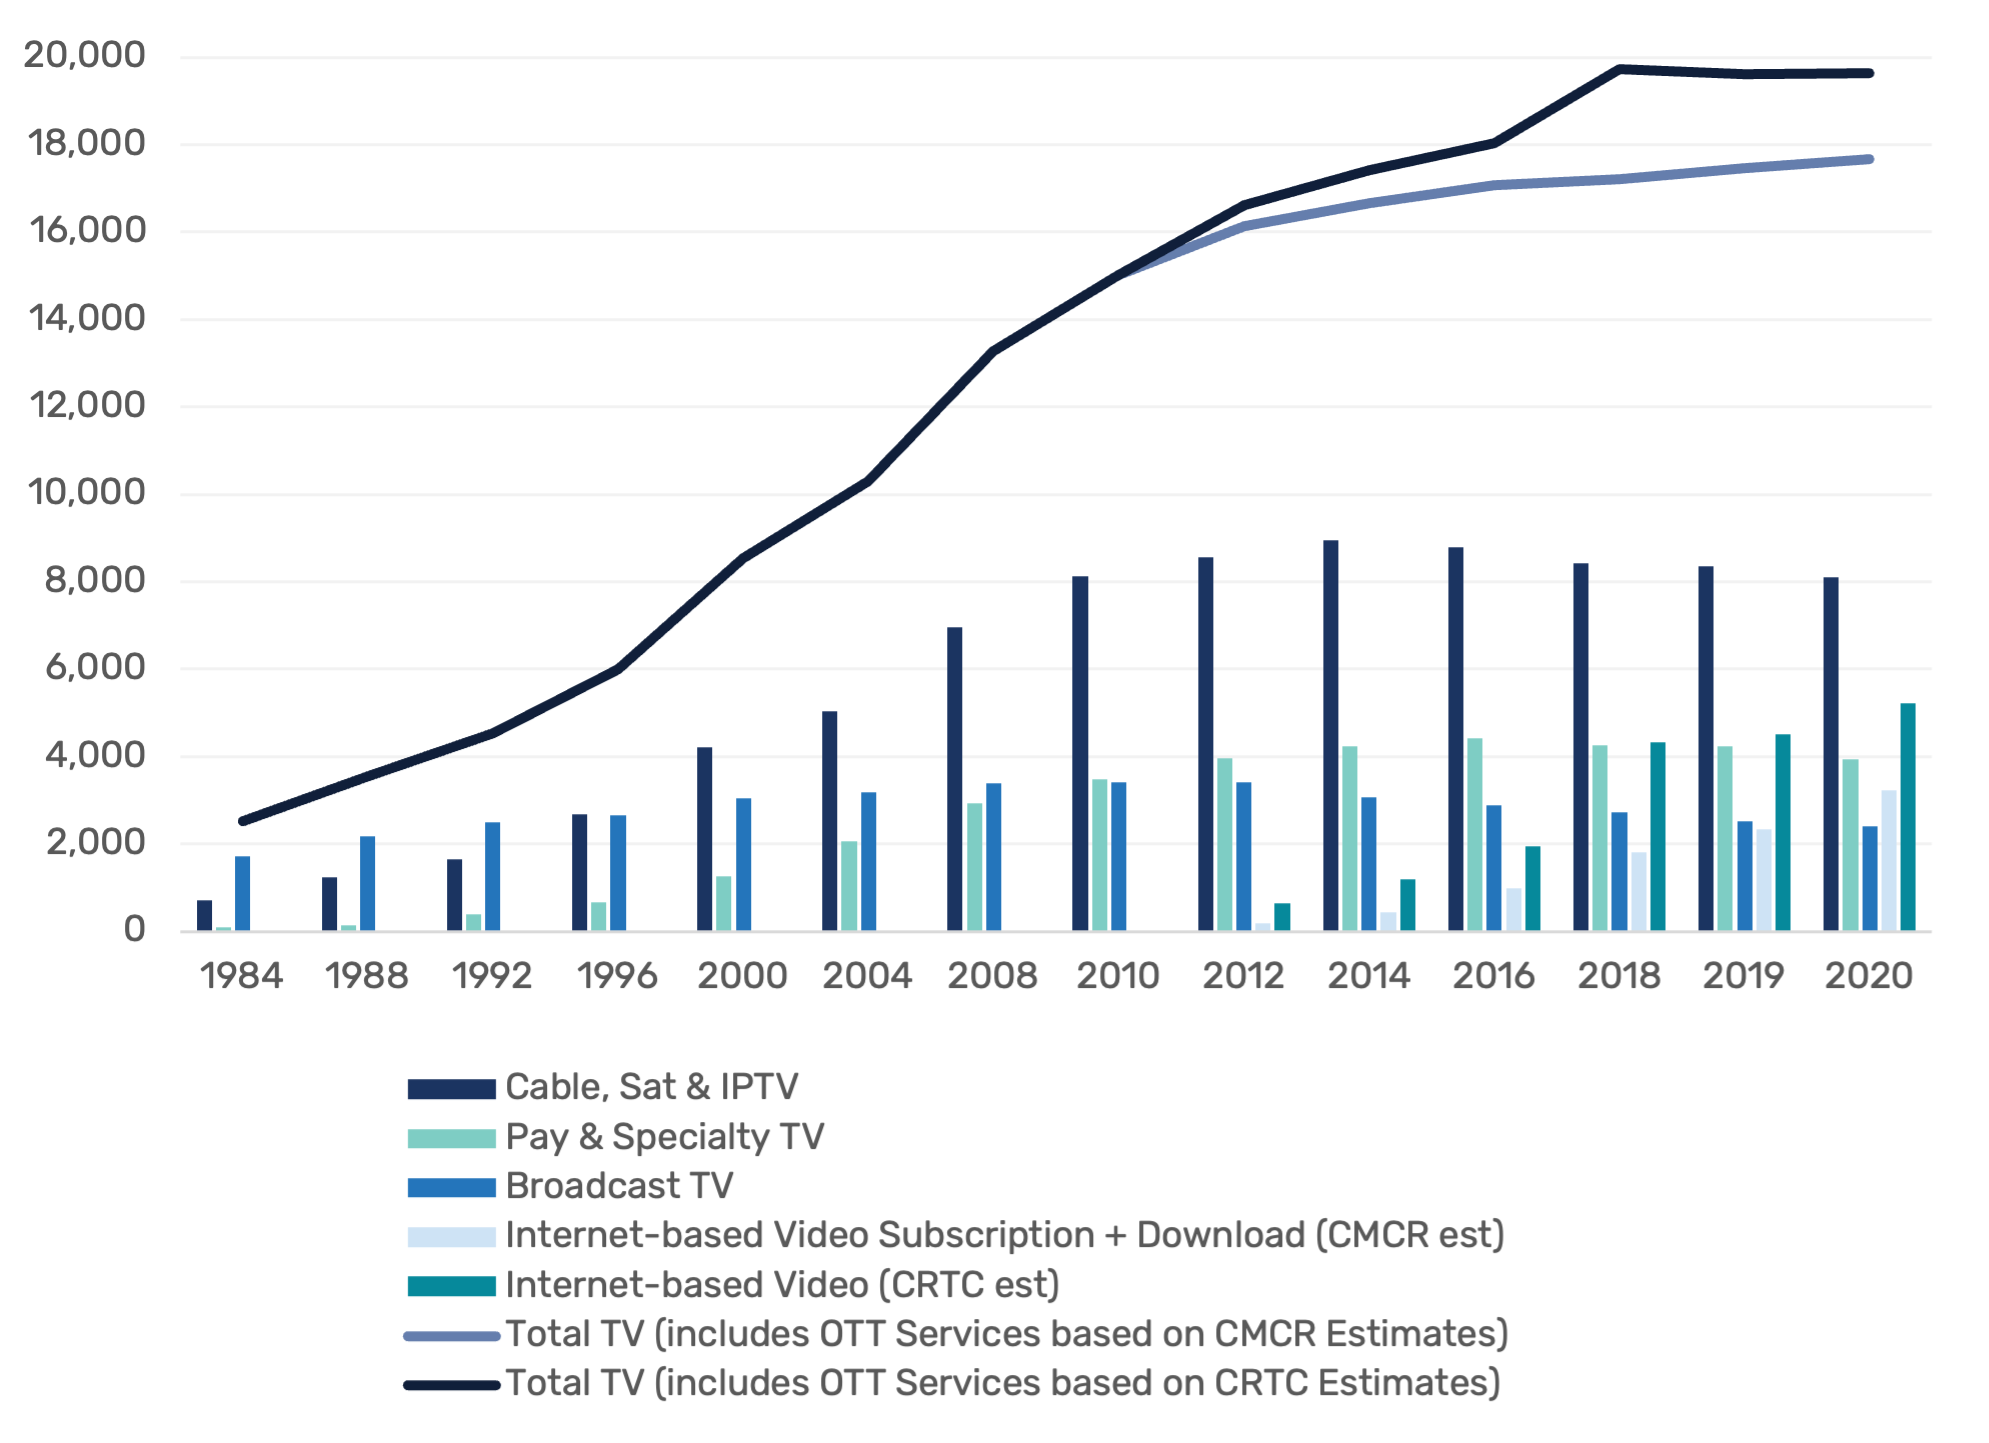
Source: see the “Total Revenue” sheet in the Excel Workbook.
There is yet another indicator that television in Canada is vibrant and undergoing a phase of extraordinary growth: soaring investment in television and film production. Indeed, total television and film production in Canada jumped from $5 billion a decade ago to $9.3 billion last year (just shy of the previous year’s all-time record investment of $9.4 billion).
Figure 25 below depicts the trends. While Canadian investment rose modestly in the first half of the last decade, during the past five years it has been Netflix, Amazon and Hulu that have been driving the trend as the they ramp up their investment in original productions. Production and post-production facilities as well as film and television production crews in British Columbia, Ontario and Quebec have been the main beneficiaries.45
Figure 25: Film and TV Production Investment in Canada, 2000-2020 (current$, millions)

Sources: Nordicity (2021 and previous years). Economic Profile, Exhibit 1-2 (Study prepared for CMPA, Heritage Canada, Telefilm Canada & Association québécoise de la production médiatique). Note: Year runs from April 1 to March 31. See the “TV + Film Production” sheet in the Excel Workbook.
Such trends are not unique to Canada, either. They are also visible in the United States and the EU, for example, where a revival of investment in film and television production by the traditional studios has taken place after it fell off in the immediate wake of the financial crisis a little over a decade ago. Like Canada, this increase is being driven by massive investments from streaming services such as Netflix and Amazon Prime.46 Thus, whereas Amazon and Netflix spent $1.5 billion and $3.4 billion, respectively, on original or acquired film and television programming in 2015, by last year, both companies had massively increased those amounts to $7.5 billion and $12.3 billion, respectively.47
Policy in Canada has long sought to attract as much of foreign investment as possible into the production of film and TV for both international and domestic distribution, and on this measure, the policy has enjoyed much success. While some commentators complain that this new investment is for production in Canada by foreign companies destined for foreign markets, this is a short-sighted view because investments in foreign location productions—as this type of production is called—lead to lasting local capacity creation, in terms of creative talent, skilled production and production facilities, as Serra Tinic’s On Location: Canada’s Television Industry in a Global Market landmark study of these issues observed in the early 2000s. Once projects financed by Hollywood film studios or, in today’s context, Netflix and Amazon are done and gone, they still leave an enduring legacy that benefits that production of television, film and other kinds of media content in Canada.
The overall upshot of such observations is that television and film production in Canada is thriving and at record high levels. Thus, before we heed calls for an ISP levy, carving out even bigger exceptions to the Income Tax Act to tilt the playing field in favour of advertising spending in Canadian media versus US-based Internet giants like Google and Facebook, or similar such steps to “harness” future media and cultural policy to a very particular (peculiar) and constrained Canadian conception of television, it is useful to pause and reflect on the above observations to ask just what the problem is that these measures aim to solve?
Of course, all of the evidence does not point in one direction, either. For example, the time the people spend watching traditional television has fallen by three hours per week over the last half decade. That decline, however, has been more than offset by a rise in TV viewing over the Internet and mobile connections.48
A 2015 Canadian Media Usage Study paints a similar picture, with time spent watching television weekly in Canada growing in the fifteen years once streaming services are included. Another version of that report a year later also observed that TV viewing grew by nearly 200 minutes per week between 2000 and 2016, with almost all of that gain being attributable to the growth of streaming television services. Data from Cisco and Sandvine also suggest that television and online video are driving the evolution of the Internet, with more than half of all down-stream Internet traffic now accounted for by Netflix and Youtube. For the past few years, Netflix alone has accounted for at least a third of all Internet traffic in North America (p. 4). In sum, watching television over the Internet and via mobile devices has resulted in television viewing time remaining relatively constant over time. Internet traffic also ebbs and wanes over the course of a day in ways that match traditional television viewing patterns. Elsewhere, I have called this the rise of the prime time Internet.
Of course, this does not mean that life is easy in the television business. Indeed, all its constituent elements must come to terms with an environment that is becoming structurally more differentiated because of new media, notably IPTV and services such as Netflix that are made available over the Internet, and because of major changes in how people use the multiplying media at their disposal.
Incumbent television providers have leaned heavily on the CRTC and Parliament to change the rules to bring online video services into the broadcasting regulatory fold. The BTLR’s (2020) Canada’s Communications Future report, as we saw earlier, proposes to do just this by creating a new category of “media content undertakings” to be brought under the jurisdiction of CRTC-cum-super-regulator, the Canadian Communications Commission and revamped Broadcasting Act (Recommendations 1 and 53). Regrettably Bill C10 has taken its lead from the BTLR with respect to these goals, even if not exactly as it proposed.
Others still, including the CBC, have pushed hard for a levy on Internet access and mobile wireless services in support of Canadian content, and to selectively lift data caps for Canadian content while applying them to “foreign” TV services and everything else that people do with the Internet and mobile phones. While strange bedfellows in the best of cases, the incumbent, vertically-integrated telecoms and TV service providers and reinvigorated cultural nationalists are rallying around the idea that keeping the BDU-centric TV model for as long as possible is a wise thing to do.49
Anchor Findings
• Broadcast television has been in decline since 2011.
• After several decades of strong growth, specialty and pay television services have also seen revenue slip since 2016.
• Rather than cannibalizing existing revenues, online video services have substantially grown the market for audiovisual media content in Canada.
• Canada’s film and television production industry has seen record high investment in new productions in the past several years, with investment levels in 2019 nearly double what they were a decade ago.
• The integration of broadcasting and pay television industries with one another—and into the operations of the country’s largest telecoms operators—is unique to Canada and may have dampened competitive pressure and reduced their ability to respond to market developments and broader shifts in AVMS, as seen in other international markets.
Beginning two years ago, we made some fairly big changes that were designed to capture a broader range of audiovisual media services that are delivered over the Internet beyond just online video services and Internet advertising. We continue that effort this year. The additional segments that we cover include:50
- Digital games: Online gaming, gaming applications, game downloads or in-game purchases
- App stores, in particular Google Play and Apple’s App Store
- Music downloads and streaming music subscriptions ic subscriptions
It is crucial to expand our coverage and analysis in this way because these segments are becoming more prominent parts of the media ecology and people’s media use. Overall revenue for digital audiovisual media services is also fast-growing, soaring from $560 million in 2011 to $5.4 billion last year. We estimate that digital games alone accounted for an impressive $1.6 billion in 2020, triple the level of six years earlier. Beyond significant growth through Apple and Google’s app stores, download and subscription revenues from digital games distributors such as Valve and Activision/Blizzard, Microsoft’s Xbox platform, Sony’s Playstation, and Nintendo are driving the increases we observe as well. As of 2020, we estimate that app store revenues were $1.7 billion. So, too, with online subscription and download music services, whose revenues have grown from an estimated $190.9 million in 2011 to $605.5 million last year (a point we will flesh out further in the next section of this report).
Add in Internet advertising of $9.7 billion last year, and these sectors have come to comprise a $15.1 billion pillar of the network media economy, or 17% of all revenue, in a remarkably short period of time. Figure 26, below, depicts the trend.
Figure 26: Internet Advertising, Streaming Services and the App Economy, 2011-2020 (current $, millions)
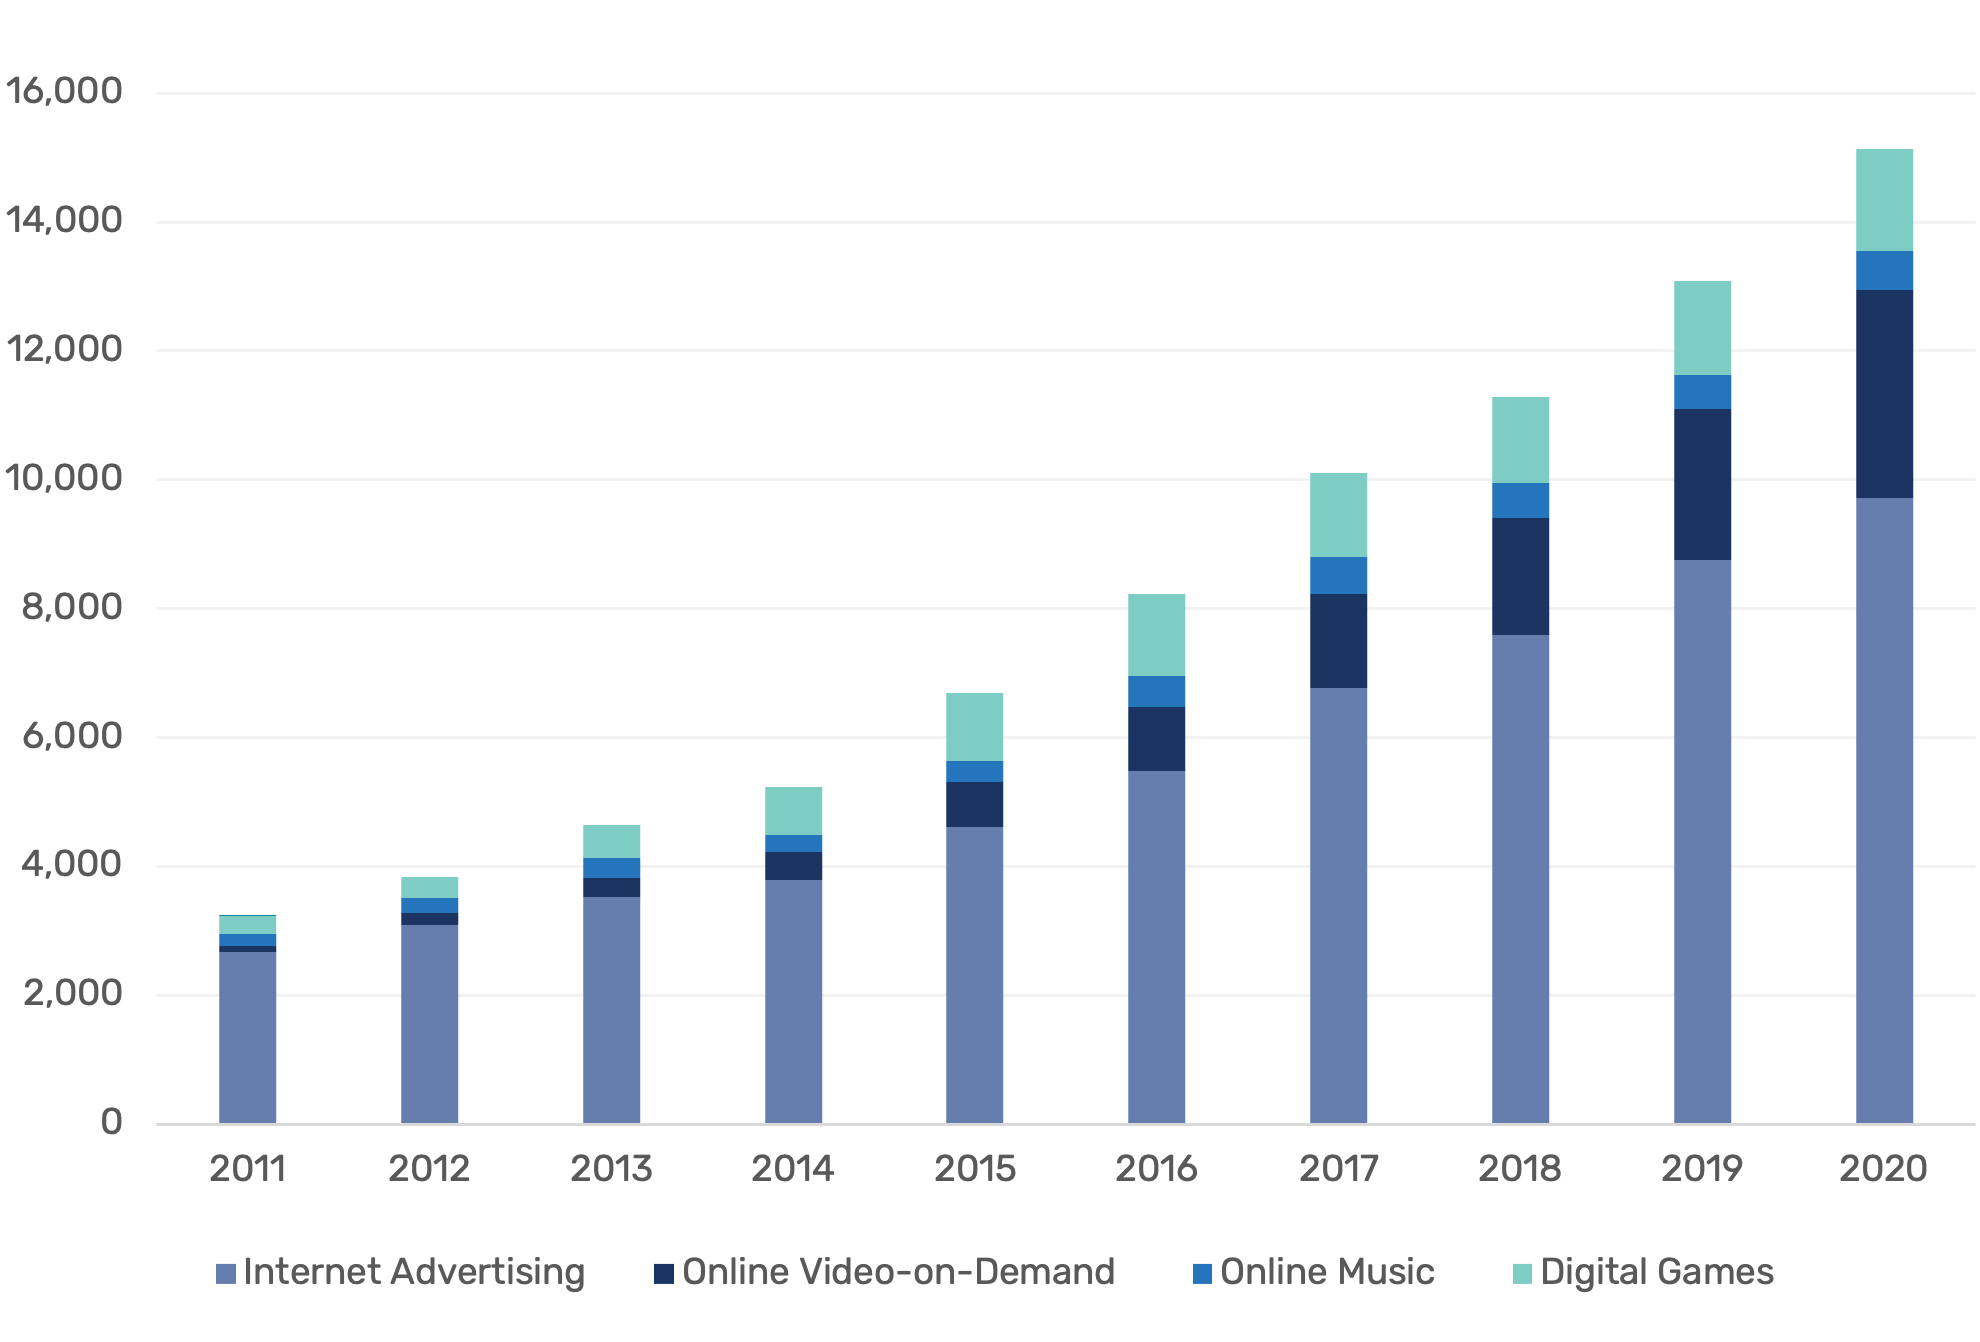
Sources and Note: see the “App Distribution” sheet in the Excel Workbook. ** Top line figures for each category—e.g. Online Video Subscription & Downloads; Online Music Downloads or Streaming Music Subscriptions; and Digital games–exclude Google Play and Apple App Store revenues to avoid double counting.
The impact of the brisk pace of growth depicted in Figure 25 is also revealed by the fact that revenue for the digital AVMS sectors surpassed those of the traditional content media for the first time two years ago. Figure 27 below illustrates the point.
Figure 27: Digital AVMS vs Legacy Content Media Revenues, 2011-2020 (Current $, Millions)
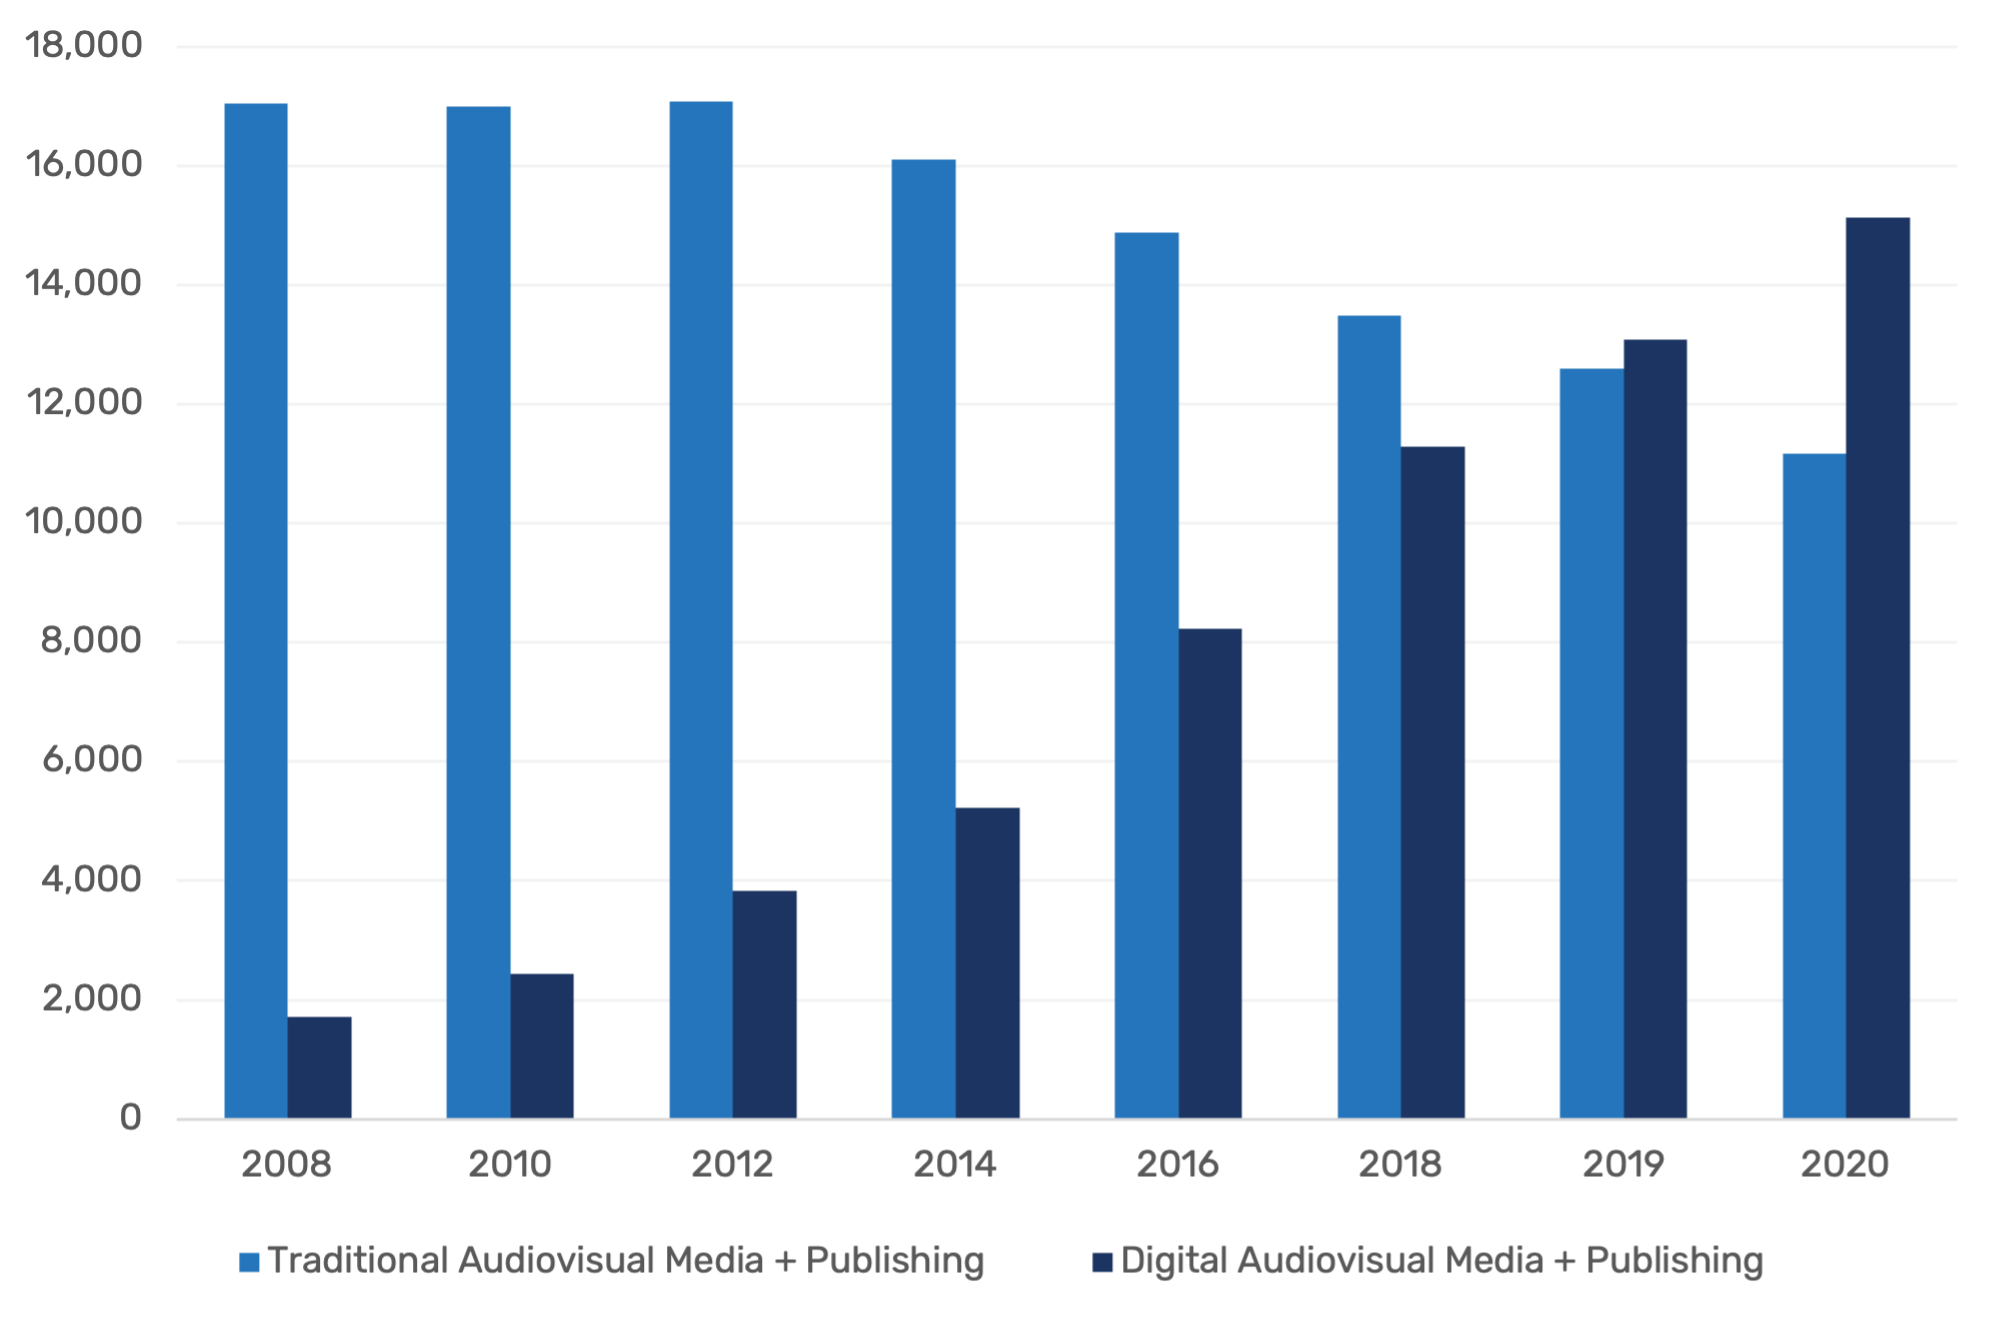
Source: see “Total Revenue” and “App Distribution” sheets in the Excel Workbook.
In sum, the digital media industries have added substantially to the size, complexity and diversity of the network media environment. In so doing, they have also brought significant international actors such as Google, Amazon, Facebook, Apple, Netflix and Microsoft deeper into the media landscape in Canada (and other countries around the world) than ever before. Indeed, Google’s dominant role in online advertising, where it had revenue of $4,865.5 million last year, is also being augmented by its fast-growing presence in app store sales and subscription-based online video services. We estimate the Google Play Store’s revenues last year to have been $443.7 million from digital games, $443.7 million from its YouTube Premium and YouTube TV services, and another $166.4 million from music apps and downloads. All told, Google had a total revenue of $5.9 billion from its operations in Canada last year, or 6.5% of all revenue across the network media economy, making it the fifth largest actor in Canada.
While there is no doubt that the Internet giants have carved out a massively larger place for themselves in Canada over a fairly short period of time, it is also crucial to keep a perspective on things. On the one hand, we observe that the revenues of Google, Amazon, Facebook, Apple and Netflix have risen two-and-a-half fold in Canada in the last five years. At the same time, however, in 2020, the “big five” global Internet giants’ combined share of the Canadian network media economy added up to just 12% of the total, while the “big five” Canadian firms—BCE, Rogers, Telus, Shaw and Quebecor—accounted for just under seventy percent of the total.
It must also be borne in mind that while the digital platforms are becoming increasingly involved in the aggregation and distribution of media and cultural content, they also offer independent audiovisual media service operators a tempting alternative to the BDU-driven approach to broadcasting policy in Canada that, as noted earlier, can foreclose access to lucrative new revenue streams and distribution opportunities. Indeed, whereas fees for independent television services such as APTN, OUTtv, Blue Ant, etc. that are carried by the BDUs are measured in dimes, revenue from online video subscription-based and download services like Amazon and Apple are measured in dollars.51 The digital platforms also offer more insight into the services that they distribute, who their audiences are, easier and faster billing and revenue splitting arrangements, greater marketing opportunities, and so on. Lastly, the platforms also offer access to global audiences rather than just domestic ones.
Indeed, for ambitious independent pay TV services in Canada, international growth rather than a continued fixation on domestic markets, is now the objective. Bell, Rogers, Shaw and Quebecor, in contrast, still seem to be intent on staking out their business model on the acquisition of foreign (mainly US) programming rights for distribution in Canada, rather than investing significantly in their own original programming that could then be distributed not just at home but around the world. That model’s days, however, are surely numbered as the big US and international actors go direct to audiences with their own services.
The music industry is, perhaps, the best example of the wrenching and protracted changes that traditional media industries have undergone before returning to significant new patterns of growth and development over the last five years or so. Indeed, while many have held up the music industry for the last two decades as a poster child for the woes besetting “traditional media” at the hands of digital media, rampant piracy and so forth, the music industry in Canada stands as a sobering counterpoint to such claims. In fact, the music industry is not in crisis. The picture to be sure, is mixed but has steadily improved for the last six years or so to the point that it is probably now safe to say that it is in good shape.
The analysis that follows is also instructive in relation to the kinds of claims that, for example, Jonathan Taplin makes in Move Fast and Break Things, and those that we find repeated in style if not specific details, in, for example, the Public Policy Forum’s The Shattered Mirror report, Richard Stursberg’s The Tangled Garden, the BTLR report or any number of other think tank, public policy and advocacy group reports that occupy centre stage in discussions like this. Each is a case study in how the selective use of data for any one specific media sector or even partial attributes of a given media sector, is misleadingly held out to stand for the whole when it does not. Unfortunately, the blue-ribbon BTLR panel report is of this type as well. Taplin’s repeated references to the steep drop in revenue for “recorded music” is of this type. Why that is so misleading will become evident in the discussion of the music industries in Canada that follows immediately below.
Indeed, like Taplin, many observers have argued for close to two decades that the music industry has been in crisis. This practice is long-running. In the contemporary context, it began with the notoriety of file-sharing and peer-to-peer (P2P) networks, from Napster in the late-1990s, to Grokster, Pirate Bay and the closing of Limewire in the first decade of the 21st Century. These illicit file sharing sites were invoked at every turn to reinforce the view of an industry under siege, with claims that conditions would only get worse as broadband Internet became more widely used and search engine giants like Google allegedly built their businesses by linking to other people’s content without permission or fair payments. For two decades, the Recording Industry Association of America and the International Federation of Phonographic Industries (IFPI)—two international trade associations that represent the music industries—argued that the industry’s revenues were in decline on account of this combination of factors—mass piracy, broadband Internet and uncompensated use of third party content by search engines like Google—and that the experience of the music business was the ‘canary in the coal shaft’ for things to come for the rest of the media. Their views are widely circulated amongst the creative industry trade associations and lobby groups in Canada, and funneled via those groups into the Canadian policy process.
And like Taplin, the evidence with respect to the deep and long-term plunge in “recorded music” revenue is clear cut and convincing, as Figure 28 below depicts.
Figure 28: The Collapse of the Recorded Music Industry in Canada, 1998-2020 (current $, millions)
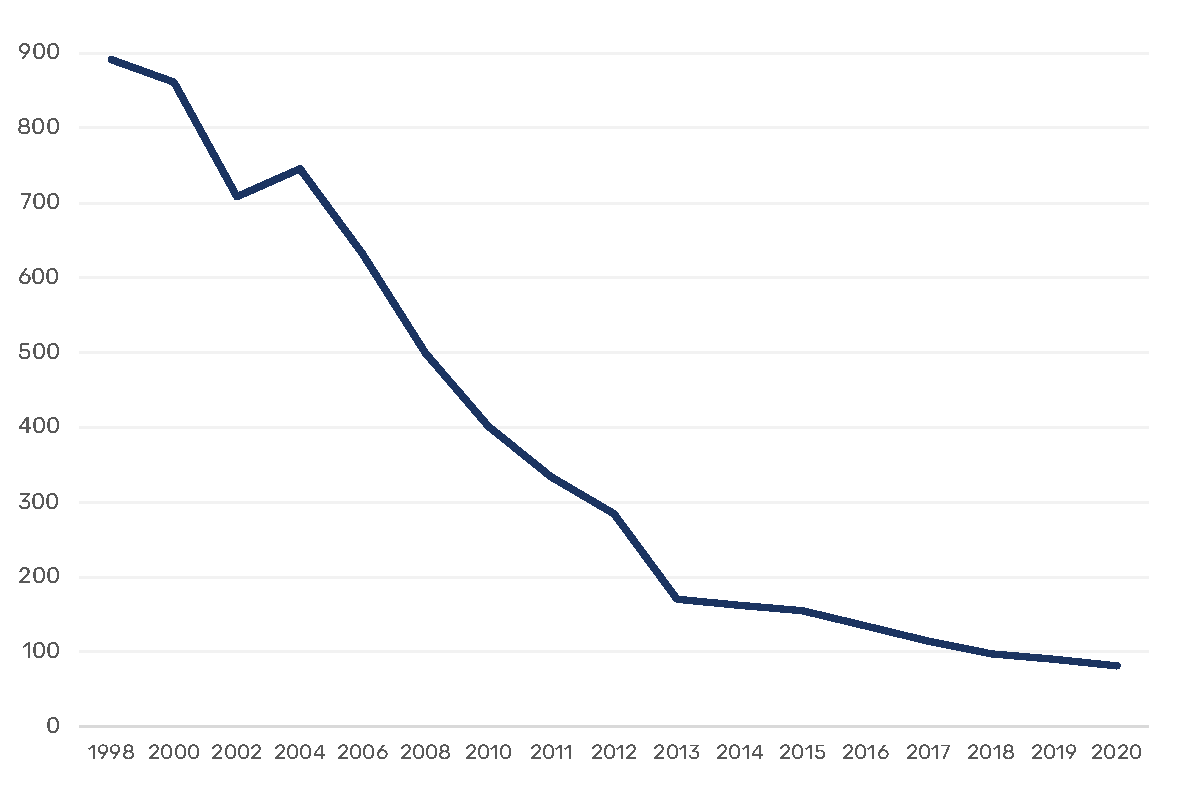 Source: See the “Total Revenue” sheet in the Excel Workbook.
This image of a beleaguered industry, however, is misleading because it refers only to the “recorded music” segment of the industry and lets that stand for the whole. Figure 29 below, however, tells a different story once the three other main segments of the music industry are brought into the picture: (1) music streaming and download services, (3) publishing (lending rights + more digital and network distribution platforms) and (4) concerts and live performances.
Figure 29: Total Music Industry Revenues in Canada, 1998—2020 (current $, millions)
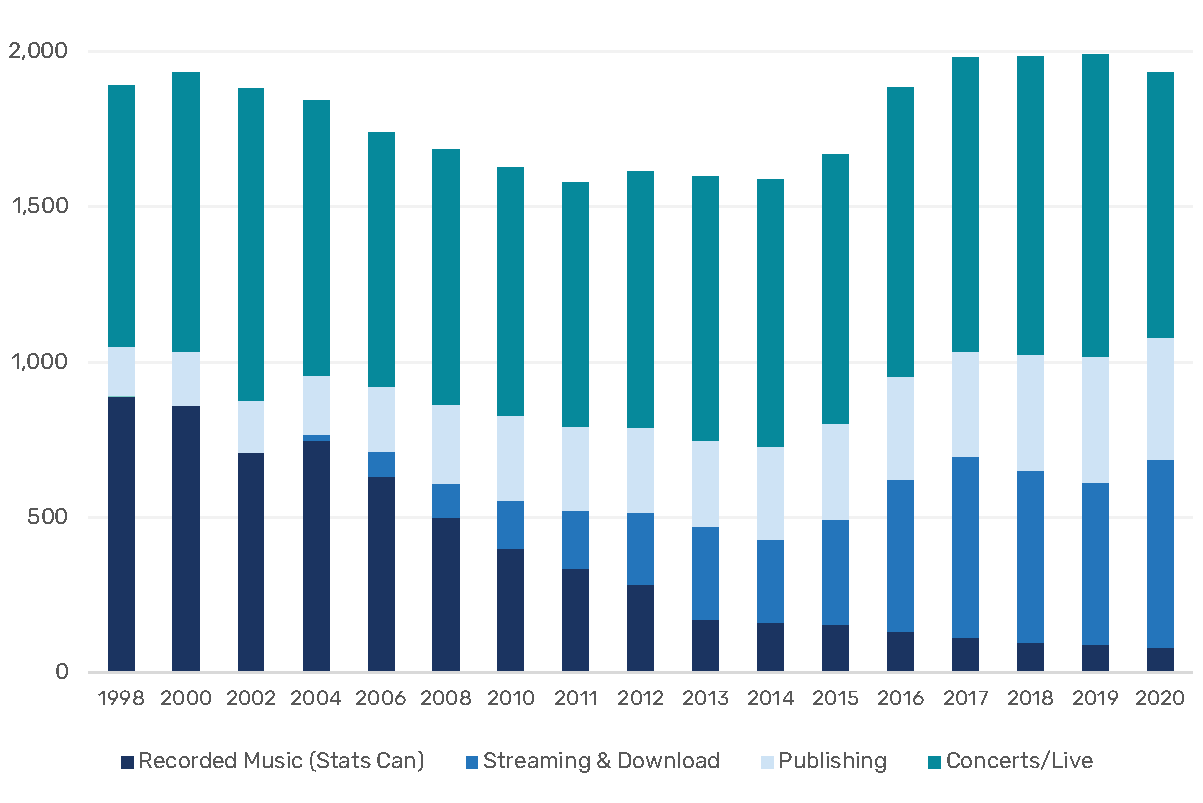
Sources: See the “Total Revenue” sheet in the Excel Workbook.
To be sure, from some angles, this is not entirely a “good news” story. “Recorded music” has gone into seemingly terminal decline. In addition, the sum of all revenues from the music industry—i.e. recorded music, streaming and download services, publishing royalties and concerts–indicates that they did decline from $1,889.7 million in 1998 to $1,578.9 in 2011. As such, there was a decade-long plus period when the music industry as a whole suffered setbacks. However, since 2014, revenues have rebounded and by last year they were $1,930.7 million.
Indeed, already five years ago Socan, the trade association that represents music composers, writers and publishers in Canada, acknowledged the turn-around, as it boasted of “a banner year” and “record revenue” (Socan, 2015, pp. 1 & 8). A year later, it pointed to “record revenue” of $330 million, with the amount of money distributed to musicians and publishers up nearly five percent, international royalties up by nearly a third over the previous three years and Internet-related revenue more than doubling in that year (Socan, 2016 Annual Report, p. 5). Year-after-year ever since, it has boasted of the “financial greatest hits” (Socan, 2018, p. 2), “another impressive year” and record high levels of “licensing revenue and distributions to our members” (Socan, 2019, p. 2). In 2019, such fees hit and all-time record of $405 million but dipped slightly last year in the face of the pandemic and as television and film production, which are major sources of publishing royalties, temporaily ground to a halt (Socan, 2021).
This turn-around is international in scope. As the IFPI stated as early as 2013 in its annual Digital Music Report, “the music industry achieved its best year-on-year performance since 1998” (p. 5). It sang the same tune the following year: “Recorded music revenues in most major markets have returned to growth” (IFPI, 2014, p. 5).
The IFPI struck a softer tone last year but was still upbeat, pointing to significant global revenue growth and a nearly twenty percent rise in paid streaming revenues and an rebound in revenues to the heady days twenty years ago (p. 11). It also pointed to conditions in Canada as falling in line with such trends while highlighting its role as the 8th largest music market in the world last year. The upshot of these points is that the lingering sense of an industry is in crisis is slipping into the past:
. . . After two decades of almost uninterrupted decline, 2015 witnessed key milestones for recorded music: measurable revenue growth globally; consumption of music exploding everywhere; and digital revenues overtaking income from physical formats for the first time. These are positive metrics of accomplishment. They reflect an industry that has adapted to the digital age and emerged stronger and smarter (IFPI, 2016, p. 5).
A common thread in each of these sources is that, because the music industries embraced digital/Internet sources of revenue earlier than other media, their fortunes have turned around more quickly. Already by 2012, the industry was obtaining about 15% of its revenues from online, mobile and digital sources. Revenue from online music services now account from one-quarter to one-third of all music revenues. In other words, after having suffered the blows from the onslaught of the Internet and piracy early in the game, the music industry was out in front of other media sectors in embracing the realities of an ever-increasing Internet- and mobile-centric media world. These lessons may hold for other media as well.
The upshot is that after having gone through wrenching changes, the music industry has been recomposed along new lines. First and foremost, such lessons should be instructive for those currently wringing their hands over the ‘death of television’.
To illustrate the points further, Figure 30 below depicts the proportionate size of the music industries over the last two decades and its fundamental transformation away from one centred on recorded music to one where concerts, online music services, as well as publishing royalties play pivotal and growing roles.
Figure 30: The Structural Transformation of the Music Industries in Canada, 2000, 2010 and 2020 (current $, millions)
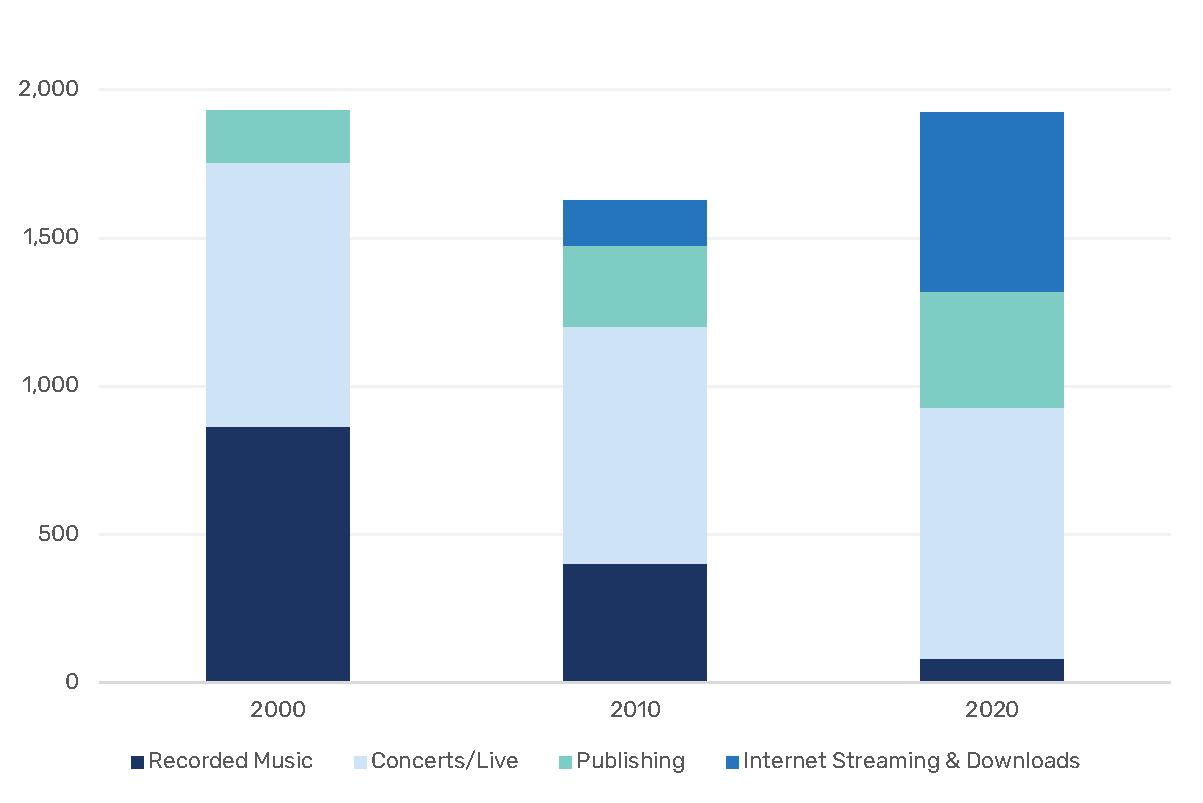
Sources: See the “Total Revenue” sheet in the Excel Workbook.
Perhaps the most dramatic tale of crisis in the media economy comes from the experience of newspapers and magazines. While the crisis of journalism that could be clearly seen in the US and European countries by the late 2000s took longer to become as full blown in Canada, that lag has now vanished. While circulation has been in decline for decades, newspaper revenue had continued to grow until peaking between 2006 and 2008 at around $4.8 billion. Since then, however, it has plunged; by last year, newspaper revenue was just over a third of what it had been a little over a decade earlier, as Figure 31 below depicts.
Figure 31: Newspaper Revenue, 2004-2020 (current $, millions)
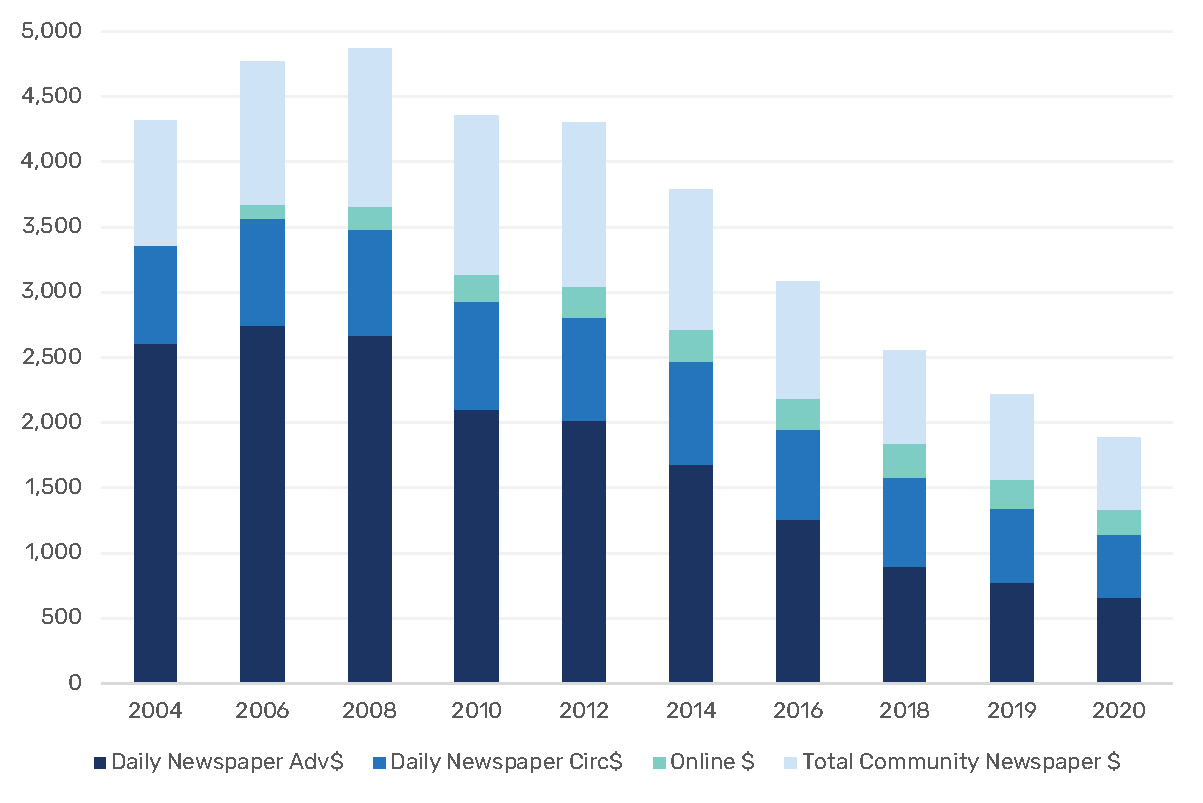
Source: See the “Newspaper” sheet in the Excel Workbook.
Magazines stand in a similar position to newspapers. Similar to the press, magazine revenue also peaked in 2008 at $2.4 billion. Fast forward to 2020, and revenue has similarly plunged to a third that level, i.e. $832.2 million. In short, the two media that basically pioneered commercial advertising, and which have depended extensively on it since early last century—many critics would argue, excessively so— are now in a state of economic free-fall, with no end in sight (see the “Magazine” sheet in the Excel Workbook).
Newspaper publishers have tried to stanch the hemorrhaging business losses by erecting paywalls in order to obtain a new line of revenue. The extent of this effort can be grasped by noting that, prior to 2011, there were no significant daily newspapers with paywalls in Canada. That changed swiftly, however. By 2013, 27 dailies accounting for roughly 45% of daily circulation were behind paywalls. By 2015, the number had grown to 38 dailies, a number that still stood last year. Paywalls were erected so fast and extensively between 2011 and 2015 in Canada that they were more prominent in this country than in either the US or the UK (see here). The use of paywalls as only hardened since. Figure 32 below illustrates the rise of newspaper paywalls by circulation over the past decade.
Figure 32: Percentage of Newspaper Circulation Behind a Paywall, 2011-2018
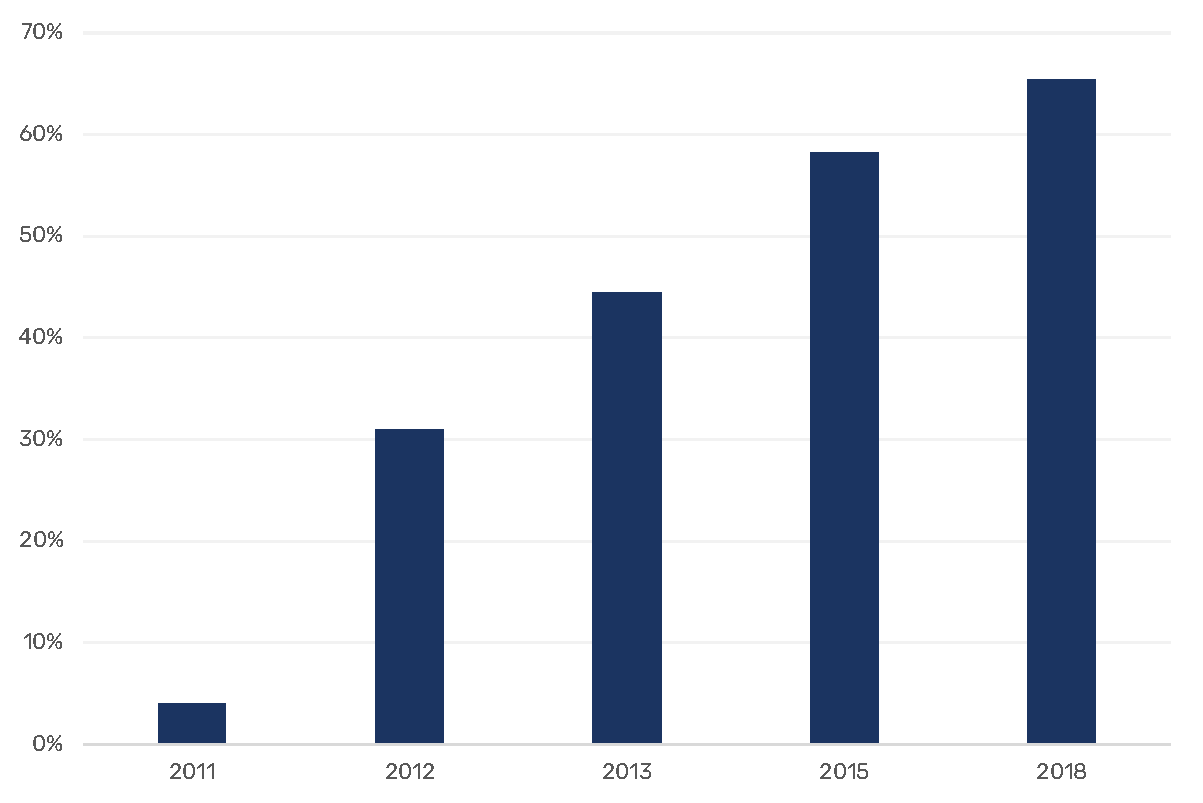
Sources and Notes: Newspaper Canada 2015 Daily Circulation Report and observations.
While paywalls have been part of newspaper publishers’ strategy of increasing digital revenues, the revenue gained has not come close to matching what has been lost. Online revenue has grown from next to nothing fifteen years ago to $267 million in 2018, but this gain pales in comparison to the roughly $3 billion in lost revenue per annum that has occurred since 2008. Moreover, online revenue has actually been declining for the last few years; last year it fell to an estimated $185.8 million.
That tough times continue to buffet the newspaper industry can also be seen in the fact that since 2008 the number of daily newspapers has dropped from 139 to 75 (News Media Canada, 2020, p. 10). In fact, even this latter figure masks the reality that even the industry itself has so fudged the definition of what a “daily newspaper” is over the past several years that it is no longer possible to compare such figures today with what they once referred to not-so-long ago.
Nonetheless, the punishing effects of these trends are clear, with some of the more illustrative highlights from the past few years listed below:52
- In November 2018, Postmedia pared back its publishing schedule by one day per week at eleven local newspapers: the Kingston Whig-Standard, Belleville Intelligencer, The Brockville Recorder and Times, Chatham Daily News, Cornwall Standard Freeholder, Owen Sound Sun Times, Sarnia Observer, Stratford Beacon Herald, Woodstock Sentinel-Review, Thomas Times-Journal and Simcoe Reformer. This followed the closure of six other small town papers in June and publishing schedules cut at four others (J-Source; Canadian Press).
- In November 2017, Torstar and Postmedia swapped 41 newspapers, mostly community papers, the vast majority of which (i.e. 37) were immediately shut down and 290 employees laid off. The companies’ paper swap effectively divided Ontario into zones of mutual exclusivity, or local monopolies—all of which begot an inquiry into potential collusion and anti-competitive behaviour by the Competition Bureau (2018) (also see Jackson, 2018).
- Postmedia’s Vancouver Sun and The Province cut twenty-six and thirty-three jobs being cut in 2017 while reduced publishing schedules adopted across Postmedia chain beginning in 2012 have been kept in place (the Calgary Herald, Edmonton Journal and Ottawa Citizen) and previous years (e.g. the National Post).
- Torstar cut 220 positions in 2016 and eighteen positions were cut at the Globe and Mail in 2014 (i.e. nine editorial, three photographers, three copy-editors and three others, bringing the number of lay-offs to 100 since 2012). Voluntary retirement programs for journalists and editorial staff have been a steady feature at the paper ever since (here and here).
- Postmedia cut 90-plus jobs in Vancouver, Calgary, Edmonton and Ottawa in 2016, with expectations that 50 more people would take voluntary lay-offs and put in place a standing offer of buyouts and early retirement packages.
- La Presse announced the elimination of 102 full-time staff positions and fifty-six in September 2015.
- Smaller papers not exempt from such processes, either with twenty lay-offs at the Halifax Chronicle-Herald in 2014 and staff at the paper on strike for much of 2015 and 2016; lay-offs of nine editorial and photographic staff across the Brunswick News chain in the Maritime provinces; and six French papers in Quebec (Le Soleil, Le Nouvelliste, Le Quotidien, La Tribune, La Voix de l’Est, Le Devoir) were sold by Gesca/LaPresse to Group Capitales Médias in March 2015.
- Even after some of the newly emerging journalistic organizations such iPolitics began to bulk up in the early 2010s, they only had 15 full time journalists, five staff and a number of freelancers, for example, as of 2015. Even that, however, did not secure a future for iPolitics as an independent news organization since it was acquired by Torstar in 2018.
- In 2020, Canada’s largest newspaper ownership group, Postmedia, closed 15 community papers, laid off fifty people, cut seventy others and imposed a temporary 5-30% salary cut for journalists and staff with a salary above $60,000 despite receiving $10.8 million from the federal government’s journalism support program, another $40.3 million from the Canada Emergency Wages Subsidy and $1 million from the Quebec government’s subsidy program for news media organizations. In 2020, Postmedia recorded operating profits of 36% on revenue of $190.7 million.53
A regularly updated tally of newspaper and broadcasting stations that have been closed, opened, or decided to either pare back or expand their publishing schedules can be found at the Local News Research Project created and maintained by researchers at UBC and Royal Roads University.54
In a recent article in The Walrus, April Lindgren of X University draws on interviews and data from one of the unions representing journalists, CWA Canada, to illuminate the human dimension of the losses.55 As she observes, for example, the number of newsroom staff at The Ottawa Citizen has dropped from 190 in the 1990s to fifty in 2019. At the Montreal Gazette, the CWA Canada had 275 members in 1990, while today the newsroom consists of forty-one people. The Kingston Whig-Standard has seen its newsroom slashed from fifty-five to eight over the same period. At the Regina Leader-Post there were 100 people in the newsroom two decades ago, now there are twenty-two.
Lindgren and her colleagues also note that 57 per cent of journalist respondents to their survey said there are fewer people in their newsrooms than in 2016, and that those cuts had eroded the quality of journalism in their publication.56 As Lindgren concludes, the casualties in all of this are people who live in cities, towns and rural communities across the country. They have been left with little or no access to local news or they are being thin gruel rather than the robust, timely, verified and independently produced news required to navigate daily life.57
Yet, several things must be born in mind when reading or, more to the point, listening to interested parties and lobby groups like News Media Canada present the case about journalism in decline based on these scholars’ work. First and maybe most importantly, while the loss of forty daily newspapers over the past decade or so is significant, it is also the case that close to half of the titles lost were not quality daily newspapers but rather free commuter dailies that offered little genuine, original reporting of their own. Moreover, the vast majority of local news media closures, i.e. 344-out-of-450, were of community papers published once a week and that served mainly as advertising flyers with a modicum of news filler surrounding the ads and which are not exactly to be remembered as bastions of quality journalism. 58
In other words, the crisis of journalism is severe and should be attended to by well-targeted public policy and funding. However, mourning the loss of community weeklies and free commuter papers as a loss for democracy rests on a false equivalency between these publications and daily newspapers based on original journalism. Yet, it is just such sleights of hands that that too often allow private commercial interests to cloak themselves in the rhetoric of public interests to further their own ends. How to square the circle in this regard is not clear. Yet, unless we figure out how to do that, the result will be situations described a moment ago where groups such as the US hedge fund-backed Postmedia will avail themselves of public subsidies from the Government of Canada while slashing and burning the very thing such subsidies are supposed to fortify, i.e. full-time journalists committed to making the free press work in the public interest.
It is also important to get a robust measure of the scale of lost journalism jobs over time to get a proper gauge of the seriousness of the crisis of journalism and the policy measures that might counteract it. In this regard, Statistics Canada’s data on the number of full-time journalists employed over the past three-and-a-half decades is the most complete and comprehensive source on the subject. Whereas lobby groups, think tanks and others have pointed to the loss of 10-15,000 journalism jobs over the course of the decade as they paint a dire portrait of a vocation vital to democracy and that is allegedly being wiped out by the likes of Google and Facebook, Statistics Canada data allows for a more nuanced and complex view than that, albeit by no means one that lets us look through the world with rose-tinted glasses and to be complacent.
The headline based on Statistics Canada’s Labour Force Survey data is that the number of full-time journalists in Canada has fallen from 13,000 to 10,500 since 2013—a drop of 20%. This is a big loss, to be sure, but it is less than figures that are four- to six-times that high that are endlessly circulated by lobby groups and think tanks like the Friends of Canadian Broadcasting, Public Policy Forum, News Media Canada, and regularly regurgitated by journalists, all of whom know full well that the Statistics Canada data exists but refuse to engage critically with it. This raises the ugly prospect that they avoid such truths because such facts are not in the interests of the owners they work for.
It is also important to note two other things. First, prior to 2013, the number of full-time working journalists working in Canada had stumbled upwards over the past three-and-a-half decades, growing by roughly fifty percent to 12,400 full-time journalists at the end of the 1990s, before inching ever so slowly upwards after that until reaching its peak in 2013. Second, while a wave of cuts followed for the next six years, the pace of those cuts has slowed over time. In 2020, the number of working full-time journalists actually rose from 8,880 to 10,500. That piece of good news has not garnered any headlines. Why?
Figure 33 below illustrates the twists and turns that have defined the uneasy fate of journalists in Canada for the last three-and-a-half decades.
Figure 33: Journalists vs the PR, Advertising and Marketing Professions, 1987-2020
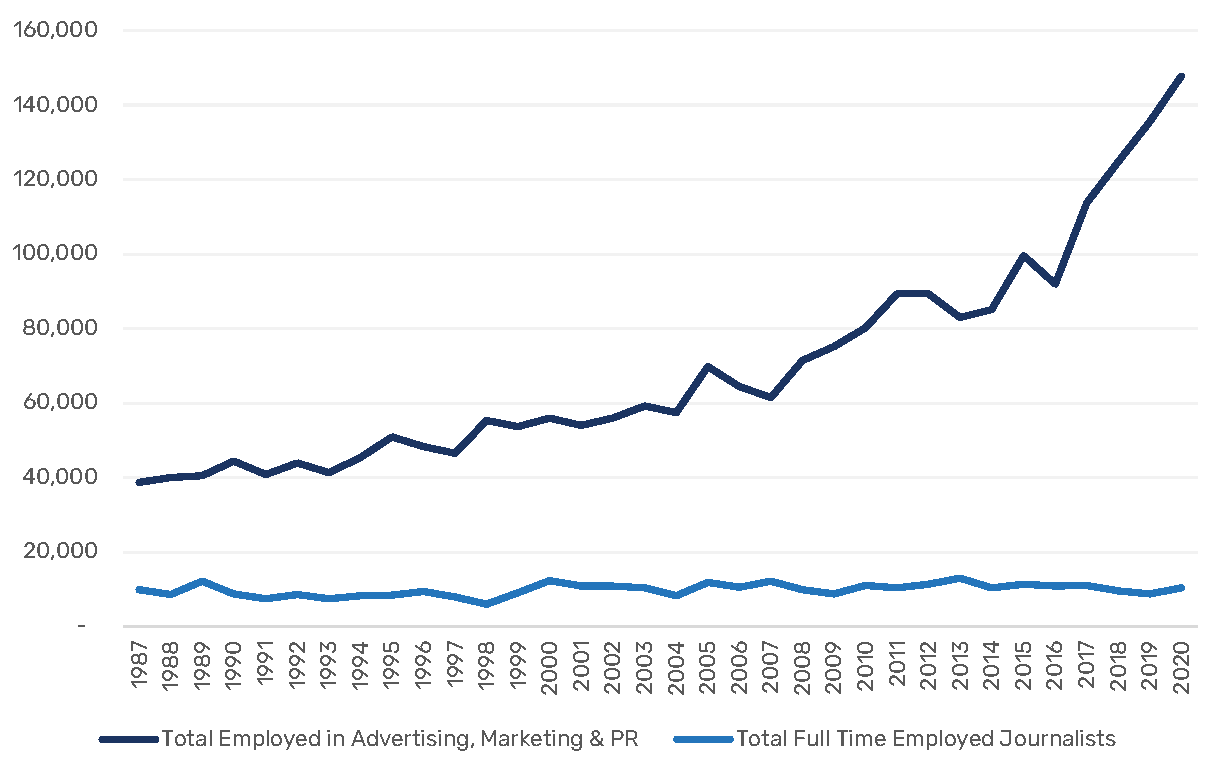
Source: Statistics Canada (2021) Employment by occupation: 1123 Professional occupations in advertising, marketing and public relations. File on record with author. See “FT Journalists” sheet in Excel Workbook.
The circumstances look even more grave once we consider that the modest increases that have taken place over time did so against a media economy that has quadrupled in size and relative to increases in the size of the economy and the general population. Moreover, as Sabrina Wilkinson observes, not only are the number of journalism jobs in decline, amongst those that do remain, fewer are permanent and much less job security is now the new normal (Wilkinson, 2019). Also consider the grim fact that the modest growth in the number of journalists that did occur over the past three decades has been vastly outpaced by the growth of the PR, advertising and marketing professions. In 1987, there were four people working in the publicity business for every journalist; last year, the imbalance had ballooned to an astonishing 14:1.
Of course, several new commercial and philanthropic supported, Internet-based approaches to journalism and public commentary have also emerged over the past twenty years.59 Canadaland, in particular, is in this league on this score and has had added a vibrant and credible new source of news, information, media criticism and opinion to the otherwise insular media and journalistic culture in Canada. Other publications like The Walrus also seem to be gaining a new lease on life, with valuable examinations and commentaries of its own on significant public issues and written by those with journalistic experience. Others examples yet offer specialized expertise in specific areas, such as iPolitics, Policy Options and the Hill Times’ suite of publications (e.g. The Wire Report). That many of these ventures have been launched by professional journalists is to their credit, as is the fact that they have also broken important news stories picked up by the national and international media.
Another notable example of such ventures is the remaking of La Presse from a division of the diversified conglomerate, Power Corporation, into a free-standing and independent charitable trust in 2020. Together, this remaking of news, opinion and public commentary media in Canada has also brought academics-as-public intellectuals back into the public conversation in ways that have added expertise and diversity to journalism and the public sphere. The revival of the partisan press, while unfortunately also fueling vitriol and extreme political voices, can also offer new voices that enliven democracy by engaging people to be more actively involved in it. At the same time, the story of iPolitics and LaPresse also remind us that the independence of these outlets must be qualified by the recognition that they, too, are heavily subsidized, not by advertising or government funding, but wealthy patrons. For iPolitics, it was the Molson family, while for LaPresse, it is the Desmarais family, one of the wealthiest and most politically well-connected families in Quebec and Canada.
Early on, the intersection between journalism and the Internet led some—including me—to be hopeful that we were seeing the emergence of vibrant “network free press” that would help to shake democracy out of its long-term stupor (Benkler, 2009). Such hopeful optimism has not come to pass.
The crisis of journalism is real. The number of professional journalism jobs lost is a real problem too. Hopeful journalism start-ups run by professional journalists have been re-absorbed into the fold, for example, with Torstar’s acquisition of iPolitics three years ago. That acquisition, as just noted, also revealed that it is not only important to have seasoned journalists backing new digital journalism ventures but that wealthy patrons are playing a big role in this too, given the role of the Molson family in bankrolling iPolitics from start-up to acquisition.
Crucially, none of these newer online outlets even ranks amongst the top 60 Internet news sources that people in Canada turn to. However, Canadians do use the Internet and social media quite extensively as “pathways to the news” (Reuters Institute, 2019). Furthermore, the range of Internet news sources that they consult when doing so is quite broad and diverse, consisting as it does of a mixture of new and old, as well as local, national and international news sources (a point we will return to in our next report). Even with the far greater diversity of online news sources available to Canadians, traditional news organizations are still the most important sources of journalism (see the “Online News Media” sheet in the Excel Workbook).
A key reason for mounting skepticism is that the central problem that has affected journalism throughout the history of democracy in its modern configuration is nowhere near being solved: i.e. people have never paid the full cost for the news.
For the past 150 years, this reality had been masked by the increasing role that advertising played in subsidizing people’s news consumption, but that façade has been collapsing for over a decade (John & Loeb-Silberstein, 2016; Pickard, 2019). As the Reuters Institute’s Digital News Report (2021) observes, only 13% of Canadians are willing to pay for the news online—a number that is in line with other countries and which has stayed stubbornly flat for the past several years.60
Given this unwillingness to pay for the news—historically and today—once the advertising subsidy that has been journalism’s main source of funding for the last century dries up, or is diverted to the Internet and into the pockets of Google and Facebook, who or what will fill the breach?
The major English- and French-language press groups have repeatedly called for subsidies in response to these conditions, and, unsurprisingly, that they in particular should be the beneficiaries.61 Last year’s report by News Media Canada, Levelling the Playing Field, is yet another report to flood the marketplace of ideas and public policy debates with such self-interested pleas.
The Liberal Government responded to these calls in its 2019 Budget by announcing a journalism support program organized around the following three measures and worth $595 million over five years:
- A new refundable tax credit for journalism organizations.
- A new non-refundable tax credit for subscriptions to Canadian digital news.
- Access to charitable tax incentives for not-for-profit journalism (also see here)
Of course, the idea of public policy supports and public subsidies for journalism has been resisted in many quarters, not least by many of the new journalistic ventures that have emerged in recent years and which are still trying to become commercially viable (see, for example, Canadaland’s position statement on the issue). The view from those opposed to public policy interventions of any kind along these lines tends to be four-fold:
- First, taking subsidies from government will turn journalist watchdogs into politicians’ lapdogs, and be at odds with the liberal theory of the free press;
- subsidies will be used to preserve “legacy media” like broadcasters and newspapers that are better left to die;
- or worse, funds will be funneled to commercial enterprises and the CBC—both of which are exactly the incumbent players that new upstarts must compete against tooth-and-nail as they seek to carve out a place for themselves in the media world;
- crowd-funding, subscriptions or some other type of direct payments by consumers will do the trick while also avoiding all of the above threats.
Point one is historically incorrect. Points two and three are real concerns and are already being borne out by the two years of experience so far with the Liberal Government’s journalism support program, as the example of Postmedia a moment ago vividly illustrates. Indeed, it is highly problematic that News Media Canada—the industry’s trade group—plays a role in determining who get what from the $50 million Local Journalism. Just the perception of conflicts of interest arising from this situation compromises the integrity of the government’s otherwise erstwhile bid to bolster independent, public interest journalism. However, we can take some comfort in the fact that the NMC does not play a role in deciding who gets accredited as a Qualified Canadian Journalism Organization (QCJO), or who receives benefits from the Journalism Labour Tax Credit and Digital Subscription Tax Credit from the far larger, five-year $595 million Canadian journalism support program. That said, the flow of tens of millions of dollars per year from that program into the coffers of the Postmedia Group and Torstar while news budgets continue to be slashed and lavish, executive compensation goes on as usual , as we saw earlier (and no doubt others), is deeply troubling.62 Point four is wishful thinking and crowd-funding will never rise to the level needed, nor be public in nature or as representative as it needs to be. In sum, the idea that paywalls, crowdfunding, paid subscriptions, wealthy philanthropists, or some combination thereof might carry the day brings us right back to square one, however: people have never paid the full-freight for journalism. This has been true historically.63 This is still true today.
From a historical point of view, and within the context of liberal capitalist democracies, there has always been some combination of three types of subsidies that have kept the “free press” afloat:
- Advertising, which came unto its own between the 1880s and 1920s in North America and Europe as the main source of income for the press (Baldasty, 1992; Pickard, 2019; Sotiron, 2005).
- Public funds provided by democratic governments, perhaps most innovatively and expansively beginning with the 1792 Postal Act in the US that used the development of a universal postal system to (a) bring “general intelligence to every man’s [sic] doorstep” and, even more audaciously, (b) as the foundation of a nation-wide news exchange system that allowed newspapers and magazine publishers to exchange a copy of their publications with other publishers across the country as often as they liked for free in order to promote the nation-wide, social circulation of the news and to promote the development of the press throughout the US. The use of public funds to create public service broadcasters throughout western democracies from the 1920s and 1930s onwards to the present day is a more familiar version of the use of public subsidies to support the development and economic viability of journalism in the public interest (John, 1998; John, 2011; John & Silberstein-Loeb, 2015).
- Wealthy patrons who have funded journalism to pursue political, ideological and philanthropic goals, notably in Canada by Conrad Black who started the National Post in 1998 and which was kept afloat for more than a decade by new owners, not as a profitable, business venture, or for the love of journalism as a craft, so much as a way to re-invigorate the conservative political movement and culture in Canada.
The question, thus, is not whether journalism should be, at least in part, subsidized but what kind of subsidies will be established, how much will they be, what criteria will be used to decide who will get them, and how will they be organized and administered in a way that best supports public interest journalism fit for a democracy?64
Avoiding, or simply opposing, subsidies on the ground that they are antithetical to “market values” also ignores the reality that paywalls, and the entire edifice of intellectual property upon which they are based, is a specially devised creature of “the state” designed to deal with the public good characteristics of news, knowledge, ideas and culture to begin with. Indeed, the whole institutional set-up of copyright is based on a basic predicate: these goods are not normal commodities traded in normal markets. That is why distinct “intellectual property laws” have been created for them, unlike most other kinds of “property” where the standard laws that govern property and market relations hold sway.
In a bid to encourage the production and consumption of news, copyright was not extended to news until after the turn-of-the-20th Century. Indeed, news itself wasn’t even copyrightable–i.e. treated as quasi-property—in the eyes of the law—in the UK until this time. Similar events took place in the US in 1918.65 As a matter of fact, subsidies and legal protections like copyright have been the twin pillars of journalism in liberal capitalist democracies for the last century, and both measures have been crucial to furthering the free press and free speech values that it embodies and that democracy needs to flourish (see John on how the US post service subsidized the development of the “free press” to the tune of tens of billions of dollars per annum in the late-18th and 19th centuries).
It is also worth noting that what is true for journalism is also true for a wider variety of media and cultural productions, such as libraries, education, basic research, archives, the arts, orchestras, some forms of television and film (e.g. news, documentaries, public affairs programming, experimental programming), statistical agencies, universities, etc., As a general rule, the more of these things there are, and the better they are cared for in the public interest, the healthier, happier and more democratic a society is.
Information/culture/media goods are not public goods just because I say they are but because society does through the political process. They are also public goods for because the fit the criteria for such things set out in mainstream and heterodox economic theory. The economic ways and means used to produce such things through a combination of market and non-market forces are integral parts of the overall structure of the media economy not just in Canada but around the world—at least developed and democratic ones. The settlement struck during the ‘industrial media era’ that recognized these basic facts is coming undone, but without any clear alternatives in sight.
Turning away from such realities for reasons of self-interest is understandable but avoids the nub of the issues before us. How to settle the problems raised by these issues is an open question. However, railing against the idea of press subsidies as if they are an aberration and endemically at odds with the liberal free press tradition is factually incorrect.
Once this is understood, then we can have a reasoned debate about what the Liberal Government’s journalism support measures do and do not do well. We can also face up to the reality that even if Google and Facebook are properly brought to heel, advertising is not the core of the media economy and it will not be the cure for important media functions that we do need. We can also face up to the reality that even when advertising was more central to the commercial media model, this was not some kind of golden age but came with its own compromises and constraints that always rubbed uneasily with both people’s needs and the needs of democracy.
Some Concluding Observations on the Political Economy and Power of Communication and Culture Policy
This report has examined the development of the network media ecology over the past three-and-a-half decades. It has offered a step-by-step to examination of each of the twenty sectors of the telecoms, audiovisual media and online services and applications that together comprise the network media economy. In so doing, it has revealed which sectors have floundered while also highlighting those that have flourished. It has done so out of the conviction that too often discussion of “the media” proceeds without a consistent and solid, informative base of evidence, or even a coherent definition of what is to be studied. Consequently, too often the policy discussions and the public debates that ensue are driven by actors whose interests and objectives are understandable but not necessarily in line with public interests.
Overall, the report has identified four media sectors that are in serious trouble. These sectors—broadcast television, radio, newspapers, and magazines—have business models that depend mainly on advertising, and they are in crisis. For these media sectors, and the important functions that they support—namely professional and local journalism—these are dark days indeed.
For these media, the reality is that advertising spending has been in decline for most of the past decade (this is the case in “real dollar” terms on a per capita basis, in relation to the size of the media economy and in relation to gross domestic income). This combination of protracted downward pressure on ad spending, the shift to online advertising, and the entrenched dominance of Google and Facebook over digital advertising and, now, increasingly the entire field of advertising, has both sharpened the conflict and raised the stakes for those who rely on advertising across the network media economy. Those sectors just identified are clearly losing the battle.
Many media companies, trade associations, cultural policy advocacy groups and trade unions support policy proposals to expand 1970’s-era tax incentives (incentives that encourage advertisers to advertise with Canadian broadcasters, newspapers and magazines rather than U.S. media) to include online advertising. Such proposals, if adopted, are unlikely to be effective. This is because doing so will do nothing to address the overarching decline of advertising. They also do not address the huge economies of scale that are driving the consolidation of online advertising, and which put local, regional and national media at a huge structural disadvantage when it comes to competing with the global Internet giants for advertising dollars.66
Policy proposals designed to funnel advertising dollars toward specific organizations or sectors are also bound to fail because they do not countenance the other key drivers behind Google and Facebook’s consolidation and entrenched monopoly power over Internet advertising. Google’s vertically-integrated control over its own digital ad exchange, for one, and both company’s control over the personal data and audience measurement tools upon which such exchanges work, lax data and privacy protection rules, their business models and the commercial nature of today’s Internet, are all key factors that must be acknowledged before the problems facing floundering ad-supported media can be tackled with any realistic prospect of success.
We should also bear in mind that federal public subsidies to the CBC accounted for 5% of all revenue in the network media economy in the early 1980s; now the figure is 1% and falling. Reversing that trend would inject $4.6 billion back into public media. Restoring even half that amount would go a long way to strengthening public service media and public interest media.
The restoration of public funding and the targets just mentioned should animate a new phase of Internet services regulation. Such an approach should simultaneously seek to establish a suitable regulatory framework to blunt the power and influence of large corporate interests that dominate many, even most, aspects of the media economy in Canada. What we need is to create a normative horizon that serves to guide the development of a communication, Internet and media landscape that serves the public interest. Doing so with a focus on public media would also be superior to trying to harness the international Internet giants and Canada’s own communications and media conglomerates to such ends. As profit-driven enterprises, both of these groups will always serve their own private interests first and foremost, leaving large swaths of society to fend for themselves when their communication needs don’t add to the bottom line.
All this said, this report has shown that there is no general “crisis of the media”. The data have consistently reflected the fact that most media industries in Canada are vibrant and even thriving. In particular, the “pay-per media” (e.g. mobile phones, Internet access, cable television, online-video, music and gaming subscription and download services and app stores such as Google Play and Apple’s App Store) are thriving, and now constitute the core of the network media economy, with combined revenues between them that outstrip those of advertising-based media by a ratio of more than 5:1 last year.
The developments of recent years have also seen major global actors like Google, Amazon, Facebook, Apple and Microsoft (the so-called GAFAM group of Internet giants) as well as Netflix move more deeply into the media landscape in Canada (and other countries). We will have more to say on that in the next report. For here, however, our point is simply this: communication and media companies within Canada are facing intensifying competition with these global Internet giants in AVMS services, now more than ever.
This is not to say that it would be okay to ignore Google and Facebook’s dominance where it does exist. Their entrenched marked power, inscrutable black box technical systems and resistance to accept mandatory public obligations commensurate with their scale and clout are all proper targets of formal regulation. The choice today is no longer whether there will be such regulation but rather what form it will take. The real question now is whether whatever approach to digital platform and communication regulation is ultimately adopted will effectively curb market dominance wherever it exists, create fair conditions of carriage, open the inscrutable blackbox technical systems and business model of powerful carriers and platforms alike to public and regulatory scrutiny, promote free expression, and further public interests and democratic values. Even Facebook has an ongoing public relations and advertising campaign, including full-page ads in The New York Times, The Economist and elsewhere, that explicitly calls on governments to step in and regulate it.
Here is an example of one such ad from Facebook’s ongoing “regulate us” PR and advertising campaign from June 5th, 2021 issue of The Economist to help illustrate the point. It is an indicator of just how far along this relatively new disposition toward a new era of Internet service regulation has progressed, even if there is much beneath the surface of Facebook’s campaign that suggests it is holding out a lot less than what might be apparent at first blush.
Figure 34: Facebook’s “Regulate Us” Campaign
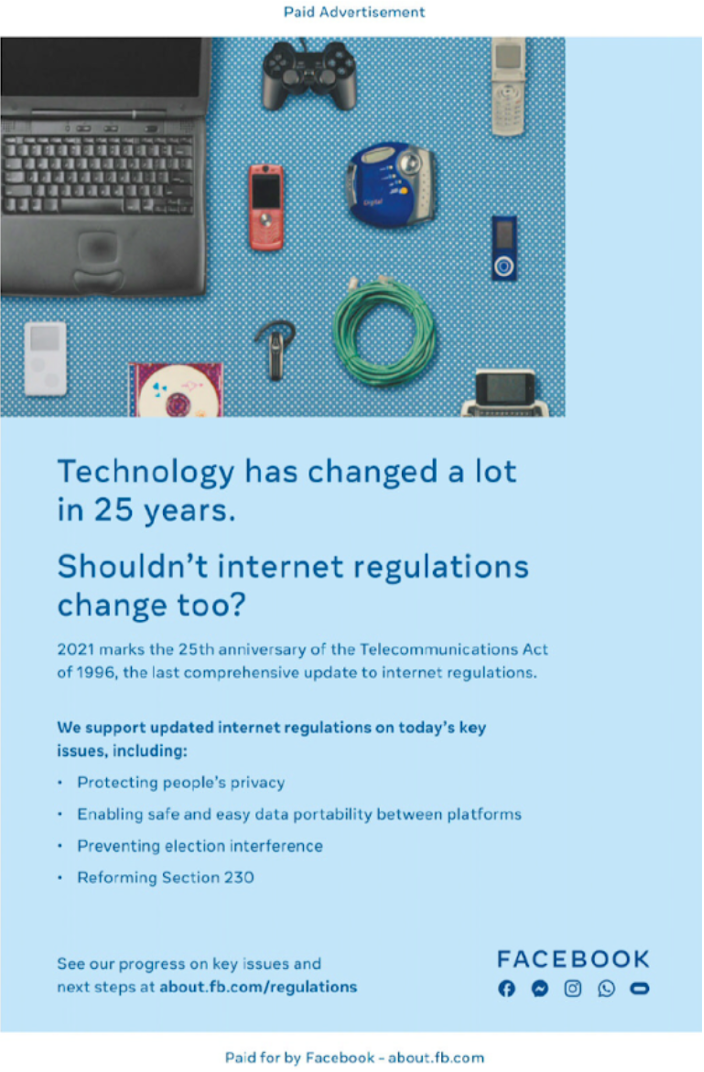
Source: The Economist, June 5, 2021, p. 4.67
What is needed is a common set of principles and effective tools that can be applied, not just to GAFAM et al, but in proper proportion wherever similar conditions exist across the network media economy. In this regard, Bell, Shaw (Corus), Rogers, Telus and Quebecor (Videotron) are still the biggest players in Canada, by far, and their market dominance is even more entrenched and their technical systems and business models no less inscrutable, and perhaps even more so, than any of the Internet giants. Those principles should draw more extensively on the history of antitrust and communications regulation rather than the current proclivity to look mostly to content and broadcasting regulation.68 The nationality of corporate identity cannot be allowed to serve as an excuse for bad behaviour in a media economy that aspires to democracy.
The fact that all the major commercial TV operators in Canada are owned by telecoms companies is not something to wave away, but rather to be dealt with as one of the most significant root causes of serious constraints on communication and culture in Canada. Indeed, handing over the defining pillars of the AVMS sectors to a handful of mobile phone/Internet access/BDU companies has foreclosed potential new business models and lines of revenue, such as retransmission fees, greater online advertising revenue and new distribution opportunities via the Internet, as this report has shown. These companies’ own lobbying power and engagement of hired guns willing to fill the public record with dubious evidence and claims in pursuit of the defense and enlargement of their own interests is second to none, and at least as corrosive in terms of knowledge, public trust and the integrity of politics, policy and regulation upon which the fate of democracy itself hangs.
The troubles stemming from the vertically-integrated, conglomerated nature of the Canadian network media economy are not limited to the content sectors. Indeed, as this report has shown, Canadians face a mobile wireless market, for instance, that continues to be under-developed by international standards, given the high price of service and the low levels of adoption and mobile data usage levels, even after accounting for some modest improvements in recent years. These constraints restrict how Canadians communicate with one another and use the media at their disposal. These conditions also need to be countered with a re-imagined view of communications, Internet, digital media and cultural policy in the public interest. Those calling for platform regulation all-too-often seem to neglect such issues, when in fact they should be treated as a baseline entry point for discussion of the type of contemporary communication environment that we want to inhabit.
Indeed, the policy and regulatory development process in Canada smacks of such one-dimensional criticisms when what we need is multidimensional thinking to face the complex issues in front of us. As a case in point, the BTLR panel’s second chapter contains a number of intriguing recommendations on electronic communication services but those have been left abandoned as the discussion of Canadian content and regulating “the web giants” sucks up all the oxygen. Worse, the report’s cherry-picked data and its analytical timelines chosen to conform to the one-dimensional story of the threats posed by the Internet giants that it wants to tell is now framing the Government’s legislative proposals, especially Bill C10, the Broadcasting Reform act, and the online harms and news compensation consultations, respectively.
This tendency is also easily detected in the trilogy of initiatives that are now at the heart of the Liberal Government’s pledge to bring about a new approach to regulating Internet services in its first 100 days in office: the Broadcasting Act reform bill (Bill C-10), the online harms legislation being contemplated, and its pledge to introduce a new bill that will oblige Google and Facebook to pay for news. Each of these measures, while touching on important issues, rests on shaky conceptual and empirical foundations of the type repeatedly highlighted in this report.
As noted earlier in this report, the idea that online video services such as Netflix, Crave, Amazon Prime Video, Disney+, etc. can and should be regulated as audiovisual media services similar to pay television and video-on-demand services made available over cable, satellite or IPTV facilities is not problematic. In fact, it is wholly consistent with Canadian history and what other liberal democracies are doing, notably the EU’s Audiovisual Media Services Directive that has been updated in the past few years to include online streaming services.
The problems, however, are three-fold. For one, the presumption in both the BTLR and Bill C-10 that all forms of human expression made available over the Internet—audio, visual and text—would be treated and regulated as broadcast programs/media content undertakings by the CRTC, unless the CRTC says otherwise, is troubling and probably at odds with the Charter of Rights and Freedoms. Relatedly, the potential that Facebook, Google, Twitter and Tiktok (media content sharing services in the BTLR report’s language) would be responsible for everything people did and said on these services, amounts to a delegation of speech policing powers to these services, creating the potential to limit speech not on the basis of legality or substantive justice, but rather based on the hosting company’s tolerance for liability. Such effects would likely fall hardest on marginalized communities whose way of expressing themselves are most likely to offend mainstream views.69
Second, both the BTLR report and Bill C-10 devolve far too much authority and discretion to the regulator, when much of what is being asked is properly in the realm of Parliamentary prerogative. Third, the government’s piecemeal approach to Bill C-10, online harms and the news payment consultations could benefit by emulating the EU’s more holistic approach to media and cultural policy as part of a broader framework that also addresses market consolidation and dominance, data and privacy protection, net neutrality, copyright and EU wide roaming for mobile wireless services. In sum, whereas the EU approach addresses communication, culture and power, in Canada, the Government’s legislative agenda and the BTLR report try to harness consolidated corporate power to promote Canadian content and culture, while leaning excessively on a rhetoric of nationalism and exaggerated fears of new communications media.
Perhaps even worse yet, as this report has tried to illustrate throughout the preceding pages, this is all part of an enduring and seeming immovable pattern that functions in the service of a fixed policy agenda that privileges incumbent interests and visions of culture drawn from the broadcasting era. To take just one other example to add to those already presented, the CRTC’s Harnessing the Future report from 2018 helped to set the tone for the current agenda. Rather than trying to harness communication, culture and media to the realities of the Internet and “the digital age”, that report insists that the broadcasting “system” remain as the centre of the universe around which all else must be rotate, regardless of the sheer force of torque that must be applied to make that happen. To the extent that the Internet and mobile phones are given any thought at all in that report, they are seen mainly as delivery systems for broadcasting, a new revenue stream by way of a levy on ISP revenues, and a means by which income can be diverted to support Canadian content. The BTLR rejects the ISP levy but only to replace it with another: a levy on the international platforms. As we also saw, even the CRTC’s flagship annual Communications Monitoring Report seems to engage in a kind of threat inflation with its recurring publication of implausible data on the state of Netflix and the online video services market for the past three years running and under the direction of its current chair.
Ultimately, these industry- and policy-wide tendencies are corrosive of the pool of public knowledge and data that should be underpinning public debate and public policy. That this is so at such a constitutive moment in communications, Internet and media history is a big problem. The tendencies just described and throughout this report are not only corrosive of public policy but also people’s trust in knowledge, the integrity of the CRTC and its regulatory process, policy making more generally and, ultimately, political institutions and the very foundations of democracy. To put it mildly, things should not be this way.
To the participants in this closed circuit of policy formation, (Canadian) content seems to be everything while anything else is just housekeeping. It is, as if turning our attention to questions about how people use the Internet and mobile devices to communicate with one another, to express themselves, to do their work, to seek pleasure and to interact with others, and to access so much else in the world, including a wide range of domestic and international media services, is, in their view, for philistines.
This content- and culture-centred way of thinking was spurned by Justin Trudeau’s first Liberal Government (and the previous Conservative governments before it), but the last and current Liberal governments have been more inclined to accept such views, even if not whole cloth. The BTLR report’s warm reception by the last Heritage Minister and the subsequent proposed changes to the Broadcasting Act reflect a change of heart that threatens to squander the once-in-a-lifetime opportunity now in front of us to imagine a new era of Internet services regulation better attuned to public interests and more democratic in nature. Rather than pursue such a path, the options now being pursued seem bent on force-fitting the increasingly Internet- and mobile-centric digital media universe into a model of broadcasting regulation as culture policy, a model that was originally forged in the 1970s and that is increasingly anachronistic in the age of the internet.
That the current battle is as intense as it is, highlights the scale of the interests at stake. Sorting through these competing interests without losing sight of the multitude of public voices who have something to say, rather than just those who have long colonized communication and culture policy in this country and wrapped their own private interests in the flag, is vital. It is also essential to have a long-term, systematic and comprehensive body of evidence, set against a background of history, a realistic appraisal of politics and power, experience as well as scholarly independence that can be brought to bear on these issues. That is what this report, and the new SSHRC-supported, forty-country Global Media and Internet Concentration Project of which it is a part, aims to achieve. We hope that you find it helpful. ■
Appendix 1: The Rise of the Great Paywalls of Canadian Newspapers, 2011-2018
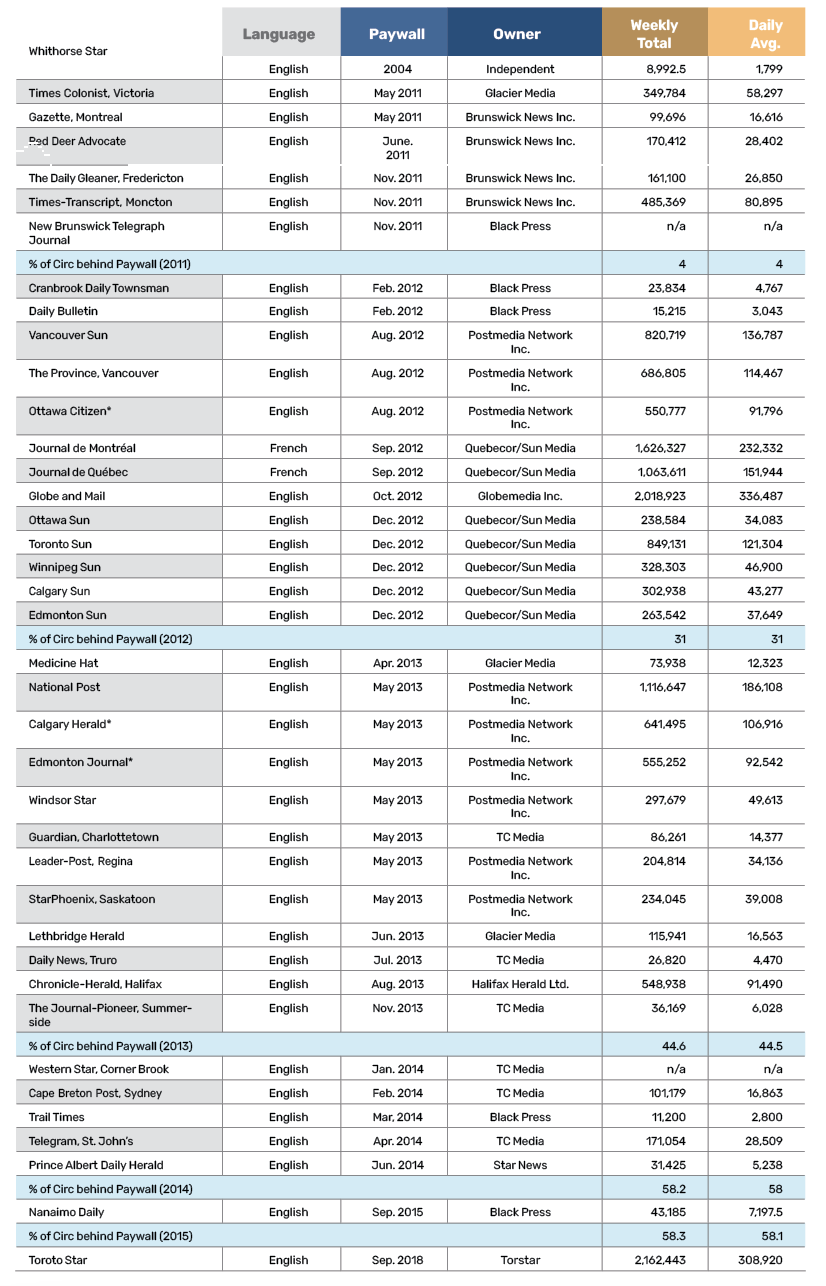
1 Pay-per media refer to those media that people pay for through subscriptions or purchase directly. They include telecoms and Internet access as well as pay and specialty TV; Internet video and music services; music; digital games, app stores such as Google Play or Apple iTunes and Apple App Store, newspaper subscriptions, etc. They are different from media that are subsidized by advertising or government-funding (as in the case of the CBC) or wealthy patrons (as in the “high arts”). I take the “pay-per” term from Vincent Mosco’s Pay-Per Society (1989). The film and book industries are not included in this report due to data availability limitations but see PriceWaterhouseCooper’s Global Entertainment and Media Outlook for evidence that bolsters the point being made here.
2 See the “Household Spending” sheet (based on Statistics Canada’s Survey of Household Spending) in the Excel Workbook.
3 Statistics Canada Household Expenditure categories are modified for this figure in three ways: first, it takes the purchase of telephone equipment out of the “Communications” category and puts it in the Home Entertainment Category. The goal is to give a “purer” conception of communication services. Second, it takes computer equipment out of “recreational services” and puts it in the Home Entertainment Equipment category to capture its emergence as a significant part of people’s home communications and entertainment equipment/devices. Third, it takes the rental of “video recordings” out of the Home Entertainment Equipment category and puts it in the Media Content and Live Entertainment category to get a “purer” division between “devices” in the former and “content” in the latter. The “Media Content and Live Entertainment” category includes: Video and audio subscription services, movie theatres, live sports events, live performing arts, admissions to museums and other activities, pre-recorded audio and video cassettes, CDs, DVD and video games, reading materials and other printed matter.
4 See Picard, 2011; Garnham, 1990; Miege, 1989.
5 See Poell, Nieborg & Duffy, 2021; Myllylahti, 2019, for example.
7 Based on an estimated growth of 24.2% y-o-y, in line with trends in the U.S.. In the U.S. average data usage per month for Comcast, Altice and Cable One in the last quarter of 2020 was 418 GB (S&P Global). In the UK, for example, average household data usage per fixed broadband connection was 429 GB per month in 2020 (Ofcom, 2021). These realities are enduring rather than recent or one-off situations (see FCC, 2018). In 2019, data usage per month per household in Canada was 265 GB (CRTC, 2020, p. 50).
8 Rogers’ Ignite TV is an IPTV-based service and it had 218,000 subscribers in 2020—about 14% of the company’s subscriber base (Rogers Annual Report 2020, p. 11).
9 The trend indicated in Figure 13, in turn, partly justified the CRTC’s efforts to promote the unbundling of cable TV packages and pick-and-pay options in its trilogy of “Talk TV” decisions in 2015 and 2016—against the protests of industry and cultural policy groups. The latter, in particular, want to extend the methods used in the past to the Internet—bundling content with access to the network, and the levy on distribution to subsidize content, while the former mainly want the Commission to stand aside and let the industry do as it pleases, or for the CRTC to be dismantled altogether and what’s left of its mandate handed to the Competition Bureau (see, for example, the reports by the C.D. Howe Institute, the Fraser Institute, the Montreal Economic Institute and the MacDonald Laurier Institute on this point).
10 In contemporary parlance, “net neutrality” often serves as shorthand for common carriage.
11 More on this in the next report. For now, see, for example, Australian Competition and Consumer Commission ACCC) (2021) Digital advertising services inquiry. Final Report; United Kingdom, Competition and Market Authority (2020). Online platforms and digital advertising; United States Federal Trade Commission (2021b) Federal Trade Commission vs Facebook. Bundeskartellamt (2019a) Bundeskartellamt prohibits Facebook from combining user data from different sources.
12 Bundeskartellamt (2019a) Bundeskartellamt prohibits Facebook from combining user data from different sources.
13 The entire online advertising ecosystem, not incidentally, was found by the Information Commissioner’s Office in the United Kingdom’ (2019) Update report into adtech and real time bidding to be rife with dirty data, fraud and deception, all of which it ordered to be remedied and made compliant with the EU’s General Data Protection Regulations as it contemplat- ed precisely what—not if—regulatory steps it would take in response to this situation.
14 Average advertising spending/GDI from 2004 to 2012 was .70% whereas it was .67 thereafter until 2020. For the United Kingdom, see UK, Competition and Market Authority (2020). Online platforms and digital advertising; for Australia, see ACCC (2019) Digital platforms Inquiry Final Report, p. 307. Yet, as in Canada, such realities are ignored in these cases as well.
15 The uptick last year is somewhat misleading given that it is against a very significant 4.5% decline in GDI in 2020.
16 This author first encountered the sustained, even if obviously, self-interested critique of Google and Facebook in Canada in the context of BCE’s acquisition of Astral, in initially in 2012, where the “vampire squids” served as a useful foil for BCE’s argument that a national champion like itself needed consolidation to build the scale necessary to battle the two Internet companies and promote Canadian culture; in the US, it was carriers like AT&T and Verizon the led the charge in their case against net neutrality.
17 See, for example, Amanda Lotz (2017). Portals: A treatise on Internet-distributed television; Jennifer Holt & Kevin Sanson (eds.)(2013). Connected viewing.
18 Lindgren & Corbett (2021). Local News Map.
19 See the CBC, Annual Reports and the CRTC, CBC Aggregate Annual Return French and English for these years.
20 Lindgren & Corbett (2021). Local News Map.
21 In 2015 alone at least 1,200 full-time television and radio jobs were cut: 460 at Bell, 439 at Rogers, 244 at the CBC, and 129 at CHCH (see here, here, here and here). The following year, Rogers cut another 200 jobs at its television, radio and publishing divisions, while Corus (Shaw) cut another ten positions at Global News when it cancelled its investigative news program, 16X19. Bell made further cuts last year when it laid off twenty sports news journalists (Watson, 2017), while Shaw cut eighty positions but softened the blow by adding fifty, mostly local journalism jobs in Ontario (Brin, 2018). In 2018, Corus cut another 80 news production positions in February while its Global News division hired fifty new positions, mostly journalists (Sagan, 2018). French language broadcaster, TFO, also cut ten positions, five of which were part time (Canadian Media Guild). Cuts continued into 2019 at the CBC (35 news room positions cuts) (Craig, 2019), another eight at the video desk of the CP news wire service and several at Corus Entertainment (Thiessen, 2019).
23 See D. Winseck (2021). Bill C-10 and the Future of Internet Regulation in Canada, CIGI Online.
24 Palmer, P. (2021). C-10: An unconstitutional power grab. C.D. Howe Institute; Grant, P. (2021). Internet Regulation Under the Canadian Constitution.
25 For a fuller elaboration of this claim, see CMCRP, 2016.
27 That is, not being vertically-integrated into cable and telecoms carriers, or diagonally integrated with pay TV services.
28 BCE, Annual Report 2020, p. 37.
29 Nordicity (2021). Profile: Economic report on the screen-based media production industry in Canada. Study prepared for CMPA, Heritage Canada, Telefilm Canada & Association québécoise de la production médiatique), p. 9.
30 FCC, 2020, para 215, 226; FCC, 2018, paras 101, 109; FCC, 2017, paras 116-119; FCC, 2016, paras 116-119.
31 FCC, 2020, para 216; FCC, 2018, paras 97-101; Evens & Donders, 2018, ch. 5.
32 See FCC, 2020, para 114; FCC, 2017, para 119 and Ad$ All Media sheet in the Excel Workbook.
36 See Rewheel, 2016; Rewheel, 2018.
37 The method we use to arrive at revenue and subscriber figures for each company examined in this section can be found in the notes attached to the individual cells of each company in the “Online Video” sheet in the Excel Workbook. The focus is on subscriber video-on-demand (SVOD) services such as Netflix and Crave and transactional video-on-demand (TVOD), while advertising-based VOD services such as Youtube’s ‘open platform’ are excluded to avoid double counting online advertising revenue and to keep the focus on professional audiovisual media services rather than user created content.
38 Estimating Netflix’s subscriber and revenue numbers has become easier since December 2019, when the company changed how it reports its financial results. These changes allow us to break out revenue and subscriber figures, respectively, for the US, which leaves a residual from its broader US-Canada (UCAN) region that can be attributed to Canada.
39 See, for example, CRTC, CMR 2020, pp. 75-76; CMR 2019, pp, 165-168. The Commission has released its flagship report later and later in recent years, including this year. Consequently, we do not know what its figures will be for this year, although conversations with CRTC staff provide reason for some optimism. Given that the regulation of online video services is now on a high boil, we can only hope that the Commission will turn the corner with both more timely and more accurate data on these pressing issues.
40 While the methodological issues at stake here are hard to convey, the gist of things is that the Commission has published similar figures for total revenue for SVOD and TVOD services in Canada for the last three years running, i.e. roughly $3 billion, despite indications of substantial growth in the surrounding text. This, in essence, means that it has been scaling back its estimates but doing so without acknowledging as much while maintaining a narrative about the threat that these fast growing services allegedly poses to “the Canadian broadcasting system”. By way of contrast, our estimate for online video services only reached $3.2 billion in 2020—three years after the CRTC stated a similar figure—which was up from $2.7 billion a year earlier and $2.1 billion the year before that. Compare, for example, CRTC, CMR 2020, pp. 75-76 with CRTC, CMR 2019, p. 165 and CRTC, CMR 2018, p. 249.
41 BTLR, 2020, p. 123.
42 Canada, Bill C-10: An Act to amend the Broadcasting Act and to make related and consequential amendments to other Acts (November 3, 2020); Canada, Bill C-10 Act to amend the Broadcasting Act and to make related and consequential amendments to other Acts. As passed by the House of Commons, June 21, 2021 (but not passed by the Senate and thus dead when Parliament was dissolved for the 2021 federal election.
43 See CRTC, 2020, Communications Monitoring Report Dataset, Tab TV-F4; Mediatique (2020). Connected TV gateways: review of market dynamics (A report for Ofcom), p. 59; FCC, 2018, paras 101, 109; FCC, 2016, paras 116-119.
44 This includes broadcast TV, pay and specialty TV, online video services and BDUs. The CRTC estimate for 2020 is based on CAGR indicated in last year’s Communications Monitoring Report since this year’s edition is not yet available.
45 Nordicity, 2019, p. 60.
46 Spangler, 2020; IBIS, 2019a; IBIS, 2019b; Eurostat, 2020.
48 CRTC, 2020, Communications Monitoring Report Dataset, Tab TV-F4; CRTC, CMR 2019, p. 144; Mediatique (2020). Connected TV gateways: review of market dynamics (A report for Ofcom), p. 59;
49 See Canada, 2020; BTLR, 2020; Bell, 2014, notably pp. 22-24; the Miller Report (2015) commissioned by the ACTRA, CMPA, Writers Guild of Canada, the Directors Guild of Canada, the Friends of Canadian Broadcasting and Unifor.
50 To arrive at our estimates, we draw on our own calculations for the online video subscription and download service, as discussed above, as well as custom tabulations from Statistics Canada’s Canadian Internet Use Survey and Digital Economy Survey for the online music, video games, apps and in-store purchases, Apple and Google’s annual reports as well as the Interactive Advertising Bureau’s annual reports on online advertising.
51 That said, this simplifies things because the BDU carriage deals offer access to audiences of a set size for a longer period of time whereas the digital platforms do not.
52 Thanks to Dr. Sabrina Wilkinson, a recent Ph.D. graduate from Goldsmiths Univerity (London, UK) for her past contributions to this section. Her research has led me to many of these examples and sources, and their significance.
53 Postmedia (2021). Annual Report 2020, pp. 9, 55, 71. April Lindgren also addresses broader concerns that the Canadian governments journalism support program will prop up the dying newspaper sector and go to the incumbent players such as Postmedia and Torstar, while the same companies will take taxpayers’ dollars but continue to cut the resources needed to do good journalism, close community papers and slash staff while giving priority to CEO compensation and payouts to shareholders. Lindgren, A. (2020). Local news is being decimated during one of its most important moments. Policy Options. The reality is that public subsidies for the press are long-standing, but their track-record is mixed. It takes great care to ensure that private interests do not free ride on public funds and public policy. In short, public subsidies for public interest journalism are essential but not an easy to assemble silver bullet. See Murschetz, P. (ed. 2014). State aid for newspapers.
54 See Lindgren & Corbett, 2021a and 2021b.
55 Lindgren, A. (2019). What the Death of Local News Means for the Federal Election. The Walrus.
56 Lindgren, Jolly, Sabatini & Wong (2019). Good news, bad news: A snapshot of conditions at small market newspapers in Canada.
57 Personal correspondence with author, November 18, 2021.
58 See Lindgren & Corbett, 2021a and 2021b.
59 See: the National Observer, The Tyee, AllNovaScotia, Policy Options, Canadaland and Blacklock’s Reporter, for instance.
60 Reuters Institute, 2021, pp. 14-15, 118-119.
61 See, for example, Postmedia CEO Paul Godfrey’s call to the Canadian Heritage Parliamentary Committee along these lines, as well as similar calls from Quebec-based newspaper groups (see here).
62 See Lindgren, A. (2020). Local news is being decimated during one of its most important moments. Policy Options and Scire, S. (2020), In Canada, a government program to support local news tries to determine who’s deserving, NiemanLab, for a fuller account of the beneficiaries of the journalism support fund. For details on these programs and who does way, see these two sources; Canada (2020). Supporting Canadian Journalism; Canada (Canada Revenue Agency (Nov. 15, 2021). Guidance on the income tax measures to support journalism.
63 John, 1998; Pick ard, 2019.
64 See Murschetz, P. (ed. 2014). State aid for newspapers; Lindgren, A. (2020). Local news is being decimated during one of its most important moments. Policy Options.
65 Tworek, 2015.
67 The discussion here is based on a forthcoming paper by Winseck and Miaoran (Blue) Dong, Reconstruction and Reform or Deflect and Delay: Facebook’s Ongoing “Regulate Us” Public Relations and Advertising Campaign.
68 See Winseck, D. & Bester, K. (forthcoming). Regulation for a Broken Internet: Lessons from 19th & 20th Centuries Antitrust and Communications Regulation for 21st Century Digital Platform Regulation. In T. Flew, J. Thomas & J. Holt (eds.). Sage Handbook of the Digital Media Economy. Thousand Oaks, CA: Sage.
69 Khoo, C. (2021). Deplatforming Misogyny. Also see C. Khoo, L. Gill & C. Parson’s (2021) Submission of the Citizen Lab to the Federal Government’s Proposed Approach to Address Harmful Content Online (“Online Harms Consultation”).