Growth and Upheaval in the Network Media Economy in Canada, 1984-2019
Contents
Summary of key findings and insights
The Network Media Economy in Canada: Contemporary Trends and Ongoing Policy Debates
The Telecoms and Internet Infrastructure Sectors: Bandwidth is King, Not Content
From Plain Old Telephone Service to Broadband Internet Access and Internet Protocol TV
Broadband Policy, Politics and Public Interests: One Step Forward, Two Steps Back?
As Internet Advertising Soars, Total Advertising Spending Slumps
The Rumoured Death of Television is Much Exaggerated
Pay and Specialty (Subscription) TV
Online Subscription and Download Audiovisual Media Services (AVMS)
The Total Television Landscape in Perspective
Remaking the Music Industry: From Ruin to Recovery
Newspapers and Magazine Publishers in Peril
ANALYSIS – Some Reflections on Journalism, Public Subsidies and Public Goods
Some Concluding Observations on the Political Economy and Power of Communication and Culture Policy
Every year the Canadian Media Concentration Research Project puts out a series of reports on the state of the telecoms, Internet, and media industries in Canada. This is the first installment in this year’s series (previous versions can be found here).
This report examines the development of the media economy over the past thirty-five years. Since beginning this project a decade ago, we have focused on analyzing a comprehensive as possible selection of the biggest telecoms, Internet and media industries (based on revenue) in Canada, including: mobile wireless and wireline telecoms; Internet access; cable, satellite & IPTV; broadcast television, specialty and pay television services as well as Internet-based video subscription and download services; radio; newspapers; magazines; music; Internet advertising; social media; operating systems; browsers, etc.
Beginning last year, we made some fairly dramatic changes by trying to capture a broader range of audiovisual media services that are delivered over the Internet beyond online video subscription and download services and Internet advertising. The new sectors brought into our analysis since then include:
- Online gaming, gaming applications, game downloads or in-game purchases (Digital Games);
- App stores, in particular Google Play and Apple Appstore;
- Music downloads and streaming music subscriptions.
We classify these sectors as the digital audiovisual media services, or digital AVMS for short, a category that also includes online video subscription and download services such as Netflix, Crave, Club illico, CBC Gem, Apple iTunes and Amazon Video. We also distinguish them from their legacy counterparts (e.g. broadcast TV, specialty and pay TV, radio, music, newspapers, and magazines) that do not depend on Internet aggregation and distribution as a core part of their business models and activities.
Figure 1 below depicts the segments of the digital and traditional media industries that collectively comprise what we call the network media economy.
Figure 1: The Network Media Economy in Canada–What the CMCR Project Covers
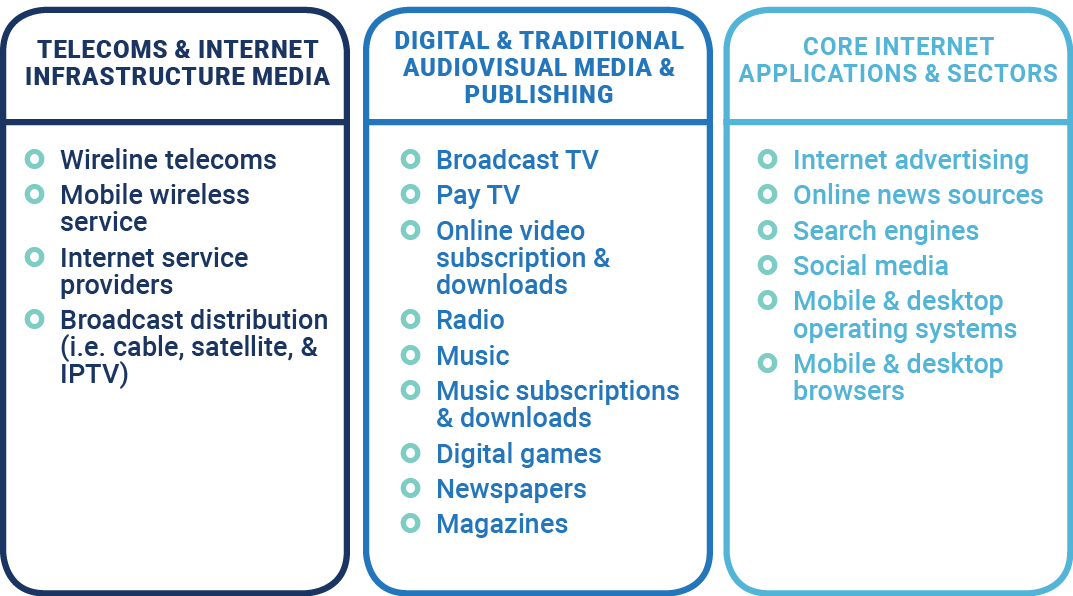
The research method that we use is simple: we begin by examining the individual components of the network media economy (i.e. the sectors indicated in Figure 1 above). This involves collecting, organizing, and publishing stand-alone data for each media industry individually. We then group related, comparable industry sectors into three more general categories: the “telecoms and Internet infrastructure media”, the digital and traditional AVMS and finally, “core Internet applications and sectors”. Ultimately, we combine them all together to get a bird’s-eye view of the network media economy, taking care to explain how the sectors interact with one another and fit together to form the network media economy as a whole. We call this the scaffolding approach.
Following this approach ensures that we start with a clear, precise definition of “the media” so that readers know what is included in our analysis and what is not. It also helps to ensure that apples-to-apples comparisons are being made with other studies and research reports, both within Canada and internationally. Too often, debates in this area proceed without such an explicit definition. As a consequence, some researchers cast a conceptual net so wide that the defining details of specific media are difficult to discern in their analysis, while others cherry pick sections of the media that support the story they want to tell.[1]
The scaffolding approach not only allows us to focus on the details and relative scale of the various individual segments of the network media economy, but it helps to see how they all fit together, and to understand where the many different actors fit within each sector and the network media economy as a whole. In concrete terms, this allows us to see how major domestic actors stack up when measured against the activities of major global players within the Canadian context. Lastly, this approach reveals which of these industries are growing, which are stagnating, which are in decline, and which appear to be recovering after years of misery. Table 1, below, offers a high-level snapshot of where things stood at the end of 2019.
Table 1: The Growth, Stagnation and Decline of Media within the Network Media Economy, 2019

Beyond the overall direction of developments within specific sectors over the past year, the report identifies several major ongoing developments in Canada’s network media economy:
- The overall story is one of ongoing growth, upheaval and increased complexity for the network media economy rather than a Cassandra story of widespread crisis.
- Despite a continued focus on advertising revenue in much communication and media scholarship, public debates and policy circles, the reality is that revenue from subscriber fees and direct purchases are at the centre of the media economy. Indeed, revenue from subscriber fees and direct purchases outstrip advertising revenue by a nearly 5 to 1 ratio. It is also critically important to note that the total scope of advertising spend for all media has been relatively fixed over time, and actually fell or stagnated for much of the last decade in inflation adjusted terms, on a per capita basis and relative to the size of the overall economy. At the same time, advertising revenue continues to shift to Internet behemoths such as Google and Facebook. This means that those sectors of the media and firms dependent on advertising are battling some of the world’s largest Internet companies to retain a share of relatively stagnant pool of advertising dollars.
- Contrary to narratives overly focused on broadcast television, Canada’s audiovisual media services market continues to grow swiftly, bolstered by a raft of online video services. The story is even stronger for investment in Canada’s film and television production sector, which has nearly doubled in the past decade.
- Rather than looking to historical approaches to broadcasting regulation, governments should heed experiences in telecom and banking regulation to inform their policy responses to the network media challenges of today. These approaches take seriously the need for structural and behavioural regulation of platforms, and potentially extending fiduciary duties to the inputs of the digital economy.
Ultimately, our goal is also to bring a wealth of historically- and theoretically-informed empirical evidence to bear on contentious claims about the media industries. Within a context where the role of policy and regulators looms large, knowing both the details and the broad sweep of the network media economy allows us to make informed contributions to the debate from an independent standpoint. This is especially necessary given the ongoing Parliamentary responses to recently concluded reviews of, for example, the Telecommunications Act, Broadcasting Act, Copyright Modernization Act and Personal Information Protection and Electronic Documents Act (PIPEDA). In light of such realities we need the best, most independent view of the landscape that we can get, and that is what we strive to do with our annual reviews and regular updates to our public data sets.
This informed and independent view is also a key input to what could be considered the preeminent debate in this area of policy, the role of digital giants in the future of Canadian and global media markets. Indeed, in the last four to five years alone, there have been at least eighty public policy examinations of the digital platforms worldwide, as governments from India and Australia to the Netherlands, the United States and Canada all grapple with the potentially far-reaching implications of these new actors and their impacts on journalism, the media, economy and society (Winseck & Puppis, 2020).
Fundamental questions about whether the very business models and extraordinary market power of Internet giants such as Facebook and Google are inherently primed for nefarious possibilities[2], regardless of their owners’ best intentions to connect the world and foster community, are now on the table like never before.
Questions are also being raised about whether these entities have become too big to effectively govern—either through self-regulation or by existing democratic institutions[3]. As a general principle, unless the rules shaping such companies’ conduct are guided by duly constituted legal and democratic oversight by parliaments, the courts, or administrative agencies—as was the case for the recent changes to the Canada Elections Act—demands for the digital platforms to better govern themselves will likely make their “black box” character even more opaque than they already are. That Amazon, Facebook or Google could be broken up just like AT&T was in 1984 is no longer a far-fetched idea (Khan, 2017; Vaidhyanathan, 2018; United States Judiciary Committee, 2020; Wu, 2018). Indeed, the issue is no longer if the platforms and Internet content will be regulated but when and how they will.[4]
We are fully supportive of concerns regarding the scale of these companies, their clout, and the threats that they pose to the Internet, some media, democracy and society. We are also fully supportive of the idea that a whole new generation of Internet regulation may be needed to regulate them for precisely these reasons.
However, our analysis also suggests that claims that the Internet hypergiants’ fortunes are being made by cannibalizing the revenue that journalism and the music, movie, television and publishing industries need to survive should be met with a healthy dose of skepticism. There is also a need to be vigilant that the push for a new generation of Internet regulation does not just translate into harnessing the Internet-centric communications and media arrangements of today to protecting approaches to broadcasting regulation and cultural policy of the past. There is also ample reason for concern that the tough structural and behavioural regulatory remedies that are needed to counteract problems of consolidation at every level of the communications, Internet and media ecosystem, and the unlimited personal data harvesting models—that fuel the commercial Internet services but which are proving to be so corrosive of people’s trust, social relationships and democracy, are thoroughly addressed—rather than the pronounced tendency at present to skip those steps in favour of directly regulating Internet content in a misdirect gambit to solve all of society’s perceived ills by cleaning up the Internet and so-called “harmful content” online.[5]
To help understand this tangled knot of issues we need to better appraise where the Internet giants currently stand within Canada. And in so doing, our first question needs to be, of course, we know that these entities loom large, but how large and how will we know?
Our data show that the US-based Internet giants are consolidating their dominance of digital advertising markets in Canada and becoming increasingly dominant across the advertising landscape as a whole. Indeed, the shift to the “mobile Internet” has helped Google and Facebook, in particular, to consolidate their lock on both online advertising and, increasingly, advertising spending across all media, as we will show later in this report. In addition, as the global Internet giants increasingly aggregate and distribute media and cultural content, existing media groups are becoming more platform-dependent, potentially jeopardizing their own economic, technological and cultural autonomy for uncertain benefits (Nieborg & Poell, 2018; Myllylahti, 2019). All of this is critical to comprehending the bleak place in which many advertising-based media now stand.
However, while the growing clout of Internet hypergiants such as Google and Facebook is unmistakeable, it is a mistake to generalize from the digital duopoly’s dominance of the Internet advertising market in Canada to the $91.3 billion network media economy writ large. The same applies globally. Indeed, treating developments in the advertising-based sectors as representative of the overall direction of the industry obscures the reality that these sectors constitute a small and receding proportion of the network media economy as a whole. Moreover, while the influence of the big five digital platforms—i.e. Google, Amazon, Facebook, Apple and Microsoft, aka GAFAM—and Netflix is significant, within countries (Canada in particular) they continue to be outstripped by a large margin by the biggest national telecommunications and media groups, as this and the next report in this series will show.
Ultimately, the media’s place in the economy, society and our everyday lives is changing dramatically and is currently up for grabs in ways seldom seen. Some communication historians call times like these a “critical juncture” (McChesney), or a “constitutive moment” (Starr), when decisions made will become embedded in technology, markets and institutions, and then press down on us, for perhaps a century or more if the lessons of “the industrial media age” offer any guide to the contemporary debates surrounding the “Internet” or “digital media age”. The CMCR Project does its best to engage with such realities in a bid to help secure the communication and media that we need and deserve.
- The network media economy has more than quadrupled in size, from $19.4 billion in 1984 to $91.3 billion last year, and continues to grow at a quick pace overall.
- Mobile wireless and Internet access services continued to grow briskly, as revenues rose to $29.2 billion and $12.7 billion, respectively; while revenue for cable, IPTV and satellite TV continued to slide to $8.3 billion in 2019. The communication networks that connect people to one another, to the Internet, other media and other services across the economy and society—i.e. mobile wireless, Internet access, cable, satellite and IPTV services—accounted for 70% of total revenue for the network media economy last year ($63.5 billion), while the media content sectors take up the rest ($27.6 billion). In short, bandwidth, not content, is king in the network media economy.
- Revenue for digital audiovisual media services (AVMS)—online video, music, gaming and app stores—soared to over $5.6 billion last year. Add Internet advertising ($8.8 billion), and the digital AVMS sectors constituted a $14.4 billion pillar of the network media economy in 2019, or 16% of all revenue.
- As a result of these developments, global actors like Google, Amazon, Facebook, Apple, Microsoft and Netflix (the so-called GAFAM+ group of Internet giants) become central figures on the media landscape in Canada. Combined, they had $9.2 billion in revenue last year.
- While communication and media companies in Canada face intensifying competition in digital AVMS as a result, the “big 5” companies in Canada still account for nearly three-quarters of all revenue across the network media economy: Bell, Rogers, Telus, Shaw (Corus) and Quebecor. In contrast, the GAFAM+ group’s combined market share is 10%. As this report also emphasizes, the Canadian situation is unique insofar that all the major commercial TV services are owned by telecommunications firms whose operations span many aspects of the network media economy that go far beyond television and internet advertising.
- Although broadcast television is in dire straits, the TV marketplace is thriving due to the addition of new pay TV sectors over time, including over-the-Internet video services. Total TV revenues soared to $8.8 billion in 2019. Netflix had year-over year average of 6.4 million subscribers and $1.1 billion in revenue in Canada last year. At year’s end, 46% of households subscribed to Netflix (the CRTC reports far larger figures but we are skeptical of its estimates for reasons explained in this report). Record high levels of investment in television and film production continued last year, with total investments of $9.3 billion.
- As a result of downward pressure on total advertising revenue over the past decade and the rise of Internet giants such as Google and Facebook, media sectors that depend primarily on advertising are in crisis, e.g. broadcast TV, radio, newspapers and magazines. Collectively, these sectors have lost $4.9 billion, eight broadcast television stations have gone dark and numerous daily newspapers have been closed or pared back their publishing schedules since 2008.
- Newspapers are in turmoil with revenue plunging from a high of $4.7 billion in 2008 to $2.2 billion last year. After rising steadily between 1987 until 2013, the number of full-time journalists has dropped by 30% in the last 6 years. As the number of journalists shrinks, the void is being filled by a vast expansion in the ranks of public relations, advertising and marketing professionals.
For nearly a decade, the CMCR Project has put out an annual series of reports on the state of the telecoms, Internet and media industries in Canada. This report is the first installment in this year’s series. It examines the development of the media economy since 1984, with the “media” defined broadly to include data for nineteen different sectors grouped into three categories, as depicted in Figure 1 below:
Figure 1: Key Sectors of the Network Media Economy in Canada, 2019
Ultimately, we combine all of these separate sectors together to get a bird’s-eye view of the network media economy.
The aim of this approach—and this report—is to get the best sense we can of how all the different sectors of the telecoms-Internet and media industries have developed over time, to understand the scale and pace of the changes that are taking place, and to see how all of the sectors that we cover fit together to form “the network media economy”. To this end, our approach begins by assembling a multisectoral body of data for the telecoms and Internet access, audio-visual media services and core Internet applications listed in Figure 1 above that collectively comprise “the network media economy”. The objective is also to determine which of these media sectors are growing, stagnating or in decline, while also highlighting those that have found renewed paths to growth, such as the music industry. To this end, the report pays close attention to, for instance, whether online audiovisual media services such as Netflix, Crave and Spotify, and online gaming, apps and app stores (digital games), are cannibalizing established media or helping to expand the size and diversity of the media economy. Other trends such as cord-cutting and cord-shaving are also examined.
Over the past three-and-a-half decades, the rise of entirely new media sectors–e.g. mobile wireless, Internet access, pay and specialty TV, digital AVMS, and so forth—has added immensely to the size and complexity of the media economy. As a result, between 1984 and last year, total revenue for the network media economy in Canada more than quadrupled from $19.4 billion to $91.3 billion. In contrast to those who claim that the media economy in this country is a pygmy amongst giants, especially relative to the United States, it is important to highlight the fact that of the thirty countries examined in Who Owns the World’s Media, the sum total of which account for roughly 90% of the world’s media revenues, Canada ranked as having the 9th largest media economy (Noam, 2016, pp. 1018-19).
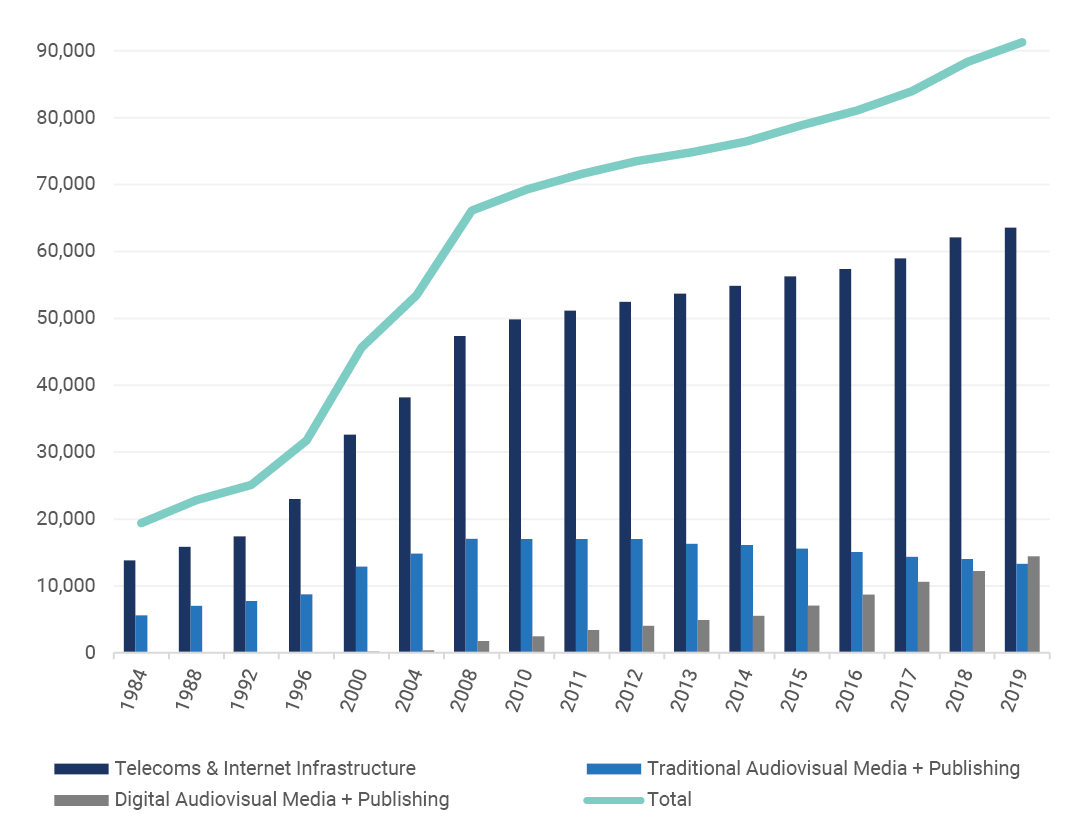
Figure 2 below illustrates the immense growth and transformations of the network media economy in Canada that has taken place over the past thirty-five years.
Figure 2: Development of Telecom & Internet Access Services vs Digital and Traditional Audiovisual Media, 1984-2019 (current $, millions)
Source: see the “Media Economy” sheet in the Excel Workbook.
While all segments of the telecoms-Internet and media industries have grown substantially over the long-run, there are several trends and unique differences among them that merit closer attention. A key development identified in this report, for instance, is the extent to which advertising-funded media (i.e. broadcast television, radio, newspapers and magazines) have been steadily eclipsed by the telecoms and Internet access sectors as well as “pay-per” audiovisual media services.[6]
By 2019, the telecoms and Internet access segments—i.e. the pipes, bandwidth, and spectrum-based connections that are now central to effective participation in society, the economy and daily life—had total combined revenues of $63.6 billion, or 70% of all revenue generated within the network media economy, compared to the $15.6 billion generated by the advertising-funded media content industries. These sectors have grown far more quickly than others and are vastly larger than the content side of the media.
Adding to the shift away from ad-supported media, the combined revenue for online video, music, digital games and app stores has soared from $720 million in 2011 to $5.6 billion last year. In fact, combined revenue for telecoms and internet access services as well as subscription-based digital AVMS services now outstrip that of advertising-funded media, including Internet advertising, by a nearly five-to-one ratio. The upshot of these developments is that, in an increasingly Internet- and mobile wireless-centric world, it is network connectivity and subscriber fees, not advertising-supported media, that are king (see Odlyzko).[7]
While there is no doubt that advertising is and will continue to be an important part of the media economy, it only underpins a relatively small and steadily receding subset of the media. Altogether, advertising-funded media account for a modest 17% ($15.6 billion) of the $91.3 billion media economy. Moreover, as we will see, for those media that depend primarily on advertising revenue, a decade of intermittently slow, stagnating and slumping growth after the financial crisis of 2008 has had devastating effects. As a result of this “lost decade”, revenue for broadcast television, radio and magazines, for example, fell by a third, while newspaper revenue collapsed to levels less than half of what they were a little over a decade ago. That all of this took place at the moment when the global Internet giants such as Google and Facebook were coming into their own obviously dealt those media that rely mainly on advertising revenue a serious blow.
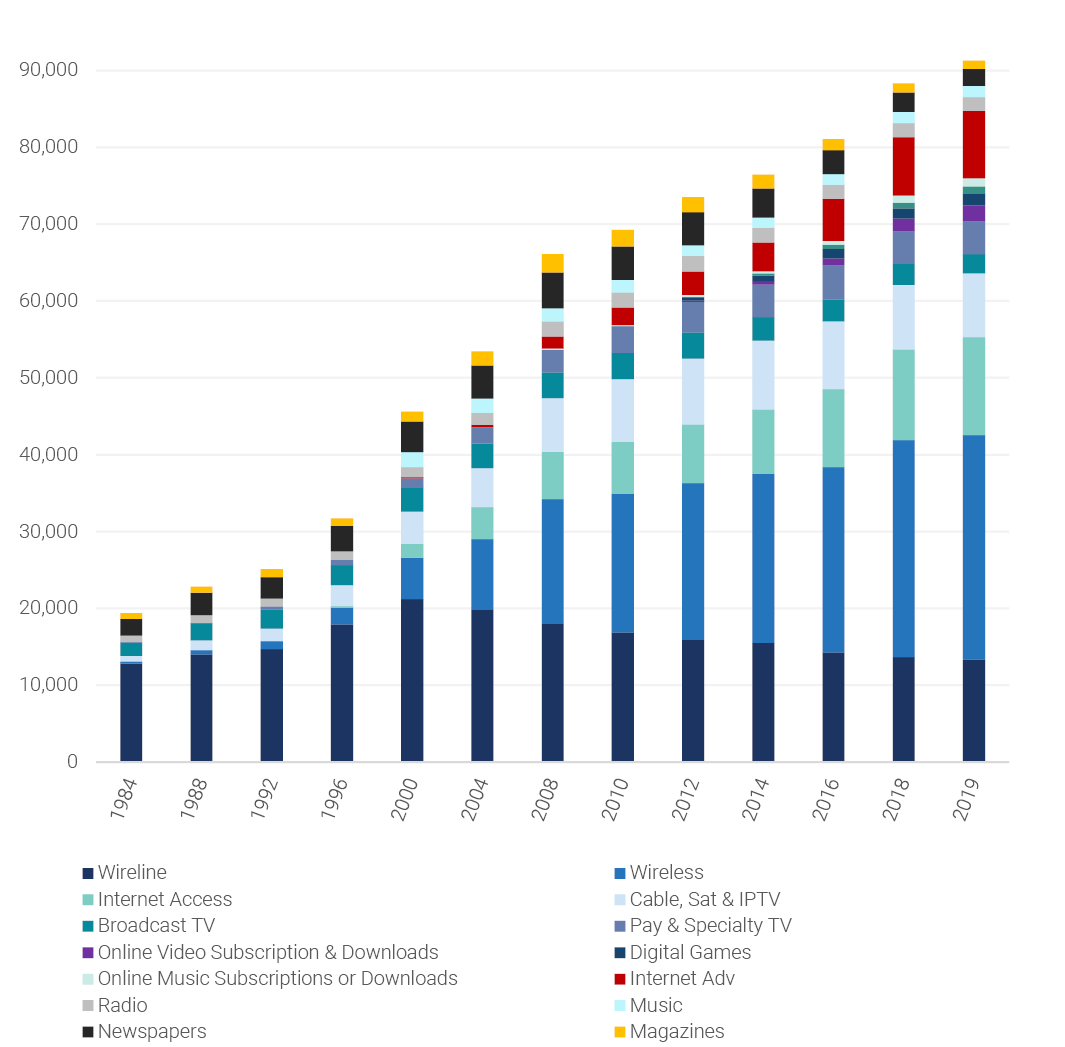
Figure 3 below goes a step further by separately depicting each sector covered in this report and its evolution over time. While all areas of the telecoms-Internet and media industries have grown substantially over the long-run, and changes have been especially fast moving with respect to the digital AVMS sectors in the last five or six years, there are also unique differences among all of them that merit closer attention.
Figure 3: Separate Media, Distinct Evolutionary Paths and the Network Media Economy, 1984–2019 (current $, millions)
Source: see the “Media Economy” sheet in the Excel Workbook.
To be sure, communication and media companies in Canada are facing intensifying competition with Google, Amazon, Facebook, Apple and Microsoft (the so-called GAFAM group of Internet giants) as well as Netflix over this bigger pie as the latter move more deeply into various aspects of the media landscape in Canada than ever before. As they take on a growing role in the aggregation and distribution of media content, for instance, existing media groups are becoming more platform-dependent, at the risk of jeopardizing their own economic and cultural autonomy—and for uncertain benefits (see van Dijck, Nieborg & Poell, 2019; Myllylahti, 2019).
These developments have ignited fierce debates over the impact of GAFAM on the media in Canada—as well as other countries around the world—and are a key driver of calls for aggressive new forms of digital platform regulation that would have been unfathomable just a few years ago. They have also re-ignited long dormant debates over cultural nationalism and technological sovereignty that have not been seen with such intensity since the 1970s and 1980s.
These concerns have been coming to head in the last few years as scholars and policymakers around the world intensely scrutinize a litany of problematic practices arising from the growth of the tech giants. These include: the rise of platform power and “digital dominance”; potential threats to domestic media and cultures; privacy and data protection; “fake news” and hate speech; national sovereignty; the integrity of elections; and antitrust. Consequently, governments from India and Australia to the Netherlands and Canada are all grappling with the implications of these developments. Indeed, there have been at least eighty such public policy examinations in the last five years alone, as one ongoing tally of these inquiries chronicles (Winseck & Puppis, 2019).
Anchor Findings
• Mobile wireless and Internet access services continue to grow at a brisk pace, but Canada’s struggle to meet its targets for universal, affordable broadband internet access continues to be a significant issue.
• Canada’s adoption of IPTV is high relative to other countries, but it severely lags international peers in “fibre to the premises” access, the gold standard for communications infrastructure.
• Following favourable regulatory outcomes related to minimum service standard and net neutrality in the mid-2010s, a change in CRTC leadership has put the future of broadband regulation into question.
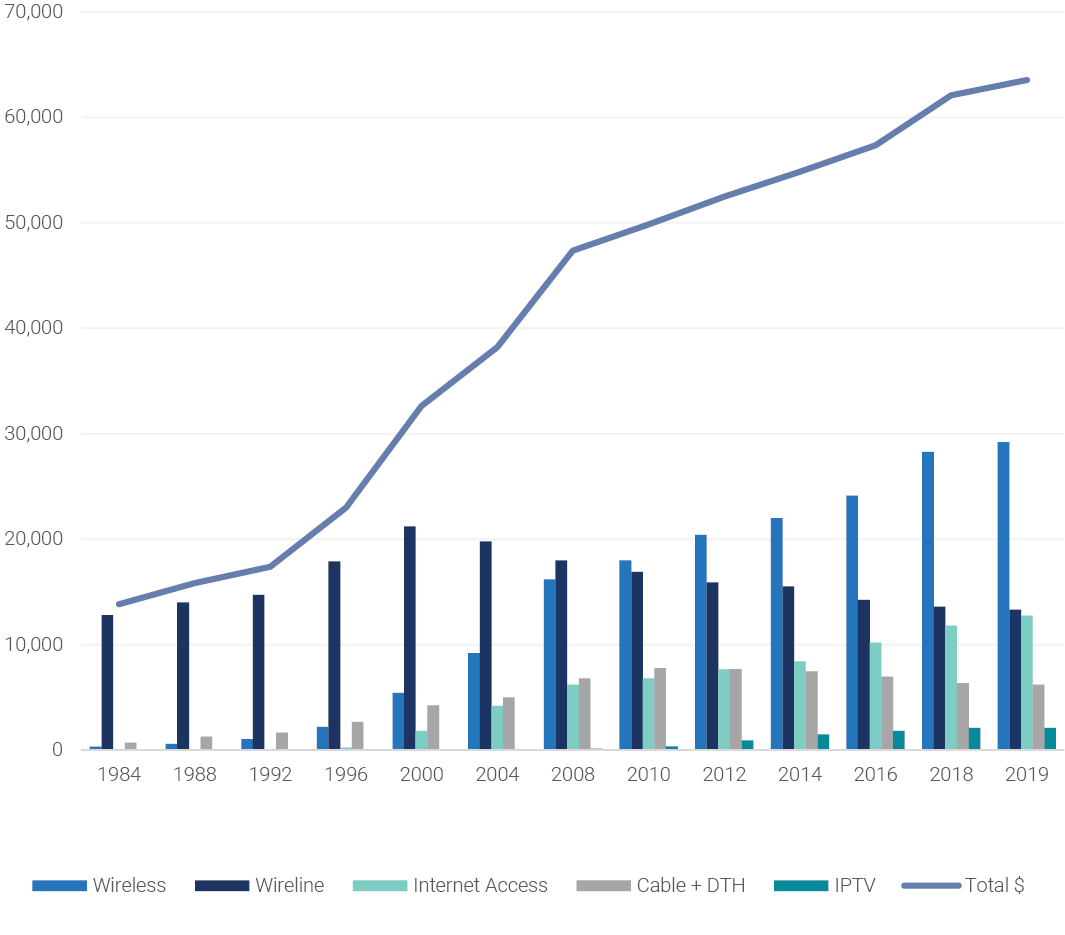
The telecoms and Internet access industries have grown enormously, from $13.1 billion in 1984 to $63.6 billion last year. They account for approximately 70% of all revenue, and are thus the fulcrum upon which the media economy pivots. Figure 4 illustrates their development over time.
Figure 4: Revenues for the Telecoms and Internet Access Sectors, 1984-2019 (current $, millions)
Source: see the “Wireline”, “Wireless”, “ISPs” and “CableSatIPTV” sheets in the Excel Workbook.
Mobile wireless services have expanded quickly since the turn-of-the-21st century to become a cornerstone of the digital media ecology. They overtook plain old wireline telephone services in 2009 based on revenue, while in 2014 the number of Canadian households subscribing exclusively to mobile services for their voice calling needs exceeded those relying exclusively on landlines for the first time (CRTC, 2015, p. 1). The centrality of mobile wireless services is also underscored by the fact that they are now the largest sector of the network media economy, by far, with revenue having grown nearly six-fold from $5.4 billion in 2000 to an estimated $29.2 billion last year.
The sustained growth of mobile wireless services has tracked an expanding array of devices that people use to connect to mobile wireless networks—a sector that once primarily connected “feature phones” and pagers now provides connectivity to a constantly expanding range of different smartphones, tablets, and connected laptop PCs. As providers begin to debut “5G” networks, it is expected that this array will continue to expand in both scale and scope, with the emphasis shifting even further in the direction of data-based broadband services, rather than the traditional voice-based services that gave mobile services their start. Consistent with this trend, mobile data traffic doubled in Canada between 2012 and 2013, and has continued to grow in the 40-60% range every year since. Cisco projects that mobile data traffic will grow four-fold between 2017 and 2022.
Despite this fast growth, mobile broadband (i.e. the mobile internet) adoption and usage in Canada continues to rank poorly against other OECD countries. Indeed, Canada ranks a lowly 32nd out of 37 OECD countries for broadband wireless penetration as of December 2019—a further drop in rank by one place of where it was last year and at levels well below those in the US, UK, Denmark, Australia, and the vast majority of other OECD countries. Figure 5, below, illustrates the point. Moreover, this is a position that Canada has languished in for a decade-and-a-half (Benkler, Faris, Glasser, Miyakawa, Schultze, 2010; OECD, 2011).
Figure 5: OECD Wireless Broadband Subscriptions per 100 inhabitants, by Technology, December 2019
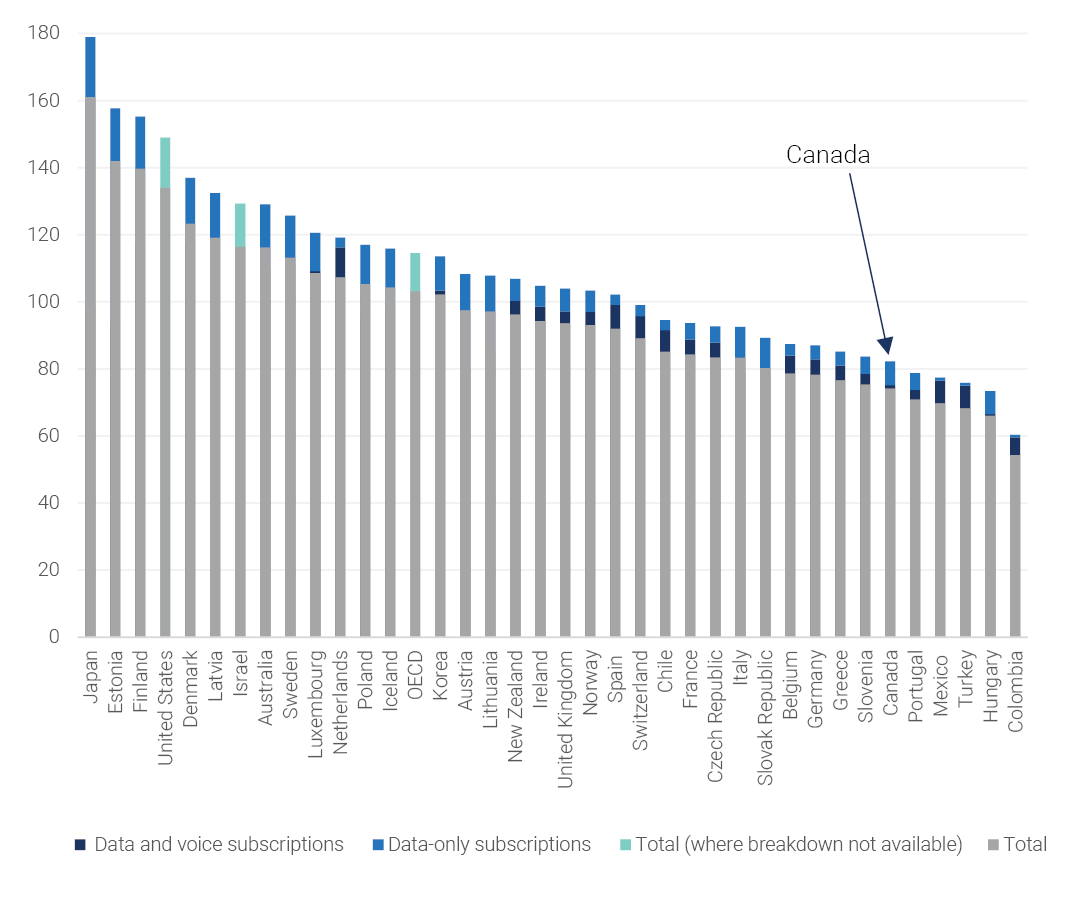
Source: OECD Broadband Portal.
Like other sectors, revenue growth in mobile wireless slowed post-2008. Already as early as 2013, some observers argued that this was the result of a maturing market (Church and Wilkins, 2013, p. 40), but this explanation is myopic and ignores the under-development of the mobile wireless market in Canada relative to all but a few of its OECD peers. In addition, the intervening years have shown this prediction to be incorrect. Although revenue continues to grow at a significant rate, adoption levels in Canada have not improved substantially, either in absolute terms or relative to our peers.
For households in the lowest income quintile, more than one-in-four do not subscribe to a mobile wireless service, while just a little over one-in-seven of those on the next rung up the income ladder stand in the same position. At the opposite end of the income scale, however, mobile wireless penetration is nearly universal at 97%. Figure 6 illustrates the levels of adoption for mobile phones by income quintiles in Canada as of 2017 (which is, unfortunately, still the most recent data from Statistics Canada), as well as for broadband Internet, home computers and cable television.
Figure 6: Household Adoption to Information and Communication Technologies by Income Quintile, 2017
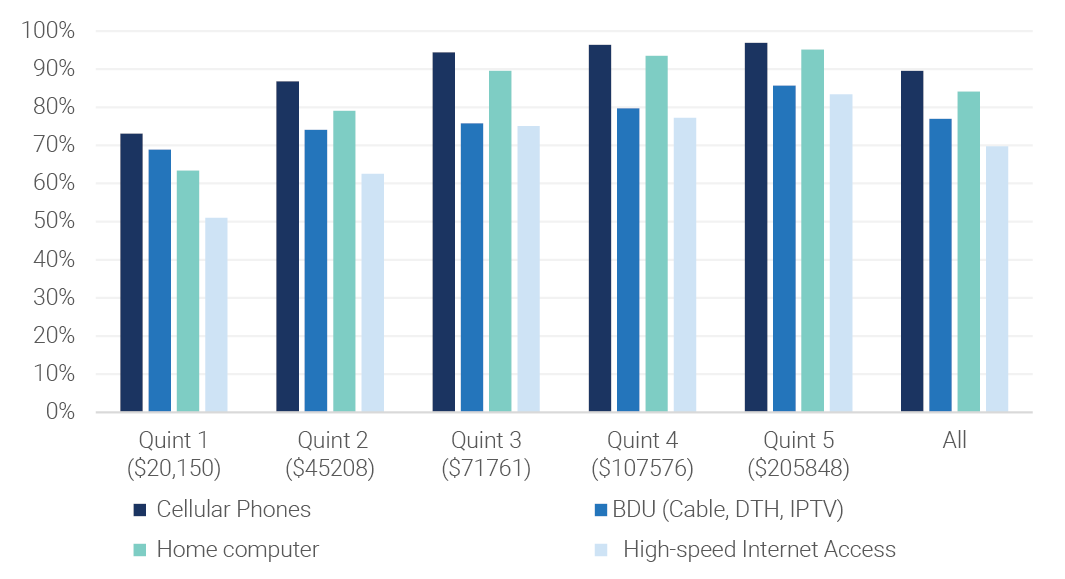
Source: Statistics Canada (2019). Dwelling characteristics, by household income quintile in Canada. In Statistics Canada, 2018. Survey of Household Spending.
In the past, Rogers, Bell, Telus, and other observers who are content to serve “economic” customers (while ignoring those who struggle to afford access to this crucial service) have attempted to distract attention from these low levels of penetration by touting the supposedly large number of subscribers who have smartphones. However, as the OECD data presented above show, adoption of mobile broadband services in Canada—smartphone connectivity, that is—remains woefully low by international standards (OECD, 2019).
Canada does not fare well in terms of mobile data usage either, ranking 31st out of 35 OECD countries for which data was available last year. With an average of 2.9 GB of mobile data usage per subscriber per month last year, Canada was well below the OECD average of 5.8 GB per month, and dramatically behind usage levels in countries such as Finland (23.5 GB, the leader), Austria (19.1 GB), Denmark (9.6 GB) Sweden (8.9 GB) and considerably less than in France (7.7 GB), as well as the UK (4.1 GB) and Australia (7.6 GB) (OECD, 2019).
There are many reasons for this state of affairs, but price and affordability are certainly two key considerations (OECD, 2018; Klass & Winseck, 2019). The concentrated structure of mobile wireless markets and diagonally-integrated nature of the firms that operate in them are also key factors. Incoherent policies and inconsistent actions by the CRTC, Competition Bureau and ISED/Industry Canada also contribute greatly to this state of affairs (see Middleton, 2017 and Benkler, et. al. 2009). At present, the CRTC is undertaking a review of its policies directed toward the mobile wireless sector, with a specific focus on determining whether current levels of competition are sufficient to serve the interests of users. The above adoption and usage data suggest that they are not; we, along with many others in Canada, anxiously await the result of this consultation.
While wireless services now occupy the centre of the media universe, the wireline telecoms infrastructure that supports plain old telephone service (POTS), value-added business services, internet access, cable and IPTV networks continues in its place as a pillar in the network media economy. Combined, these services accounted for over half of all telecoms and internet access revenues (50.6%) in 2018, while mobile wireless services accounted for the rest.
On its own, however, plain old telephone service revenue fell to $13.4 billion last year—far off the high-water mark of $21.2 billion in 2000, but with the steep drop-off flattening out in recent years. Those decreases, however, have been offset by gains in internet access, IPTV and cable revenues. Most of the telecoms and cable companies such as Bell, Telus, Rogers, Shaw, Quebecor and Cogeco were also acquiring data centre operations in the early part of this decade but in the past few years, the latter three have reversed course and sold off their data centres to firms specializing in cloud computing. More recently, some firms have moved into the provision of specialized services; for instance Telus has begun to offer healthcare-related services accounted for within the ambit of its wireline division. The lack of available disaggregated data does not allow us to gauge the scale of these activities with any precision, but it is worth noting that they may be coming to play an increasing role in the wireline activities of major Canadian telecommunication companies.
Internet access revenues have grown immensely in the past decade, similar to mobile wireless. Internet access revenues were roughly $12.7 billion last year, up from $11.8 billion the previous year, and more than six times what they were at the turn-of-the-21st century ($1.8 billion). The adoption of wireline Internet access in Canada is high relative to other OECD countries, but so too are prices, while available speeds are mediocre, household data use comparatively low (192 GB per household per month in 2018), and data caps commonplace, whereas in most comparable countries they are rare and overage charges not nearly as punishingly expensive (OECD, 2018; FCC, 2017; ITU, 2018; Cisco, 2017).
Also, like mobile wireless services, high-speed and broadband Internet access are far from universal. According to Statistics Canada’s most recent data (2017), 86% of households have adopted high-speed internet access service (i.e. > 1.5 Mbps). If we consider the uptake of services that meet the broadband universal service target of 50 Mbps up and 10 Mbps down adopted by the CRTC in 2016, half of Canadian households met that target in 2018 (CRTC, CMR 2019, p. 255). There are also significant disparities in access between urban versus rural and remote areas, and people’s adoption of broadband is divided starkly along income lines as well. Figure 7 below illustrates the point.
Figure 7: High-Speed Internet Adoption by Income Quintile, 2017
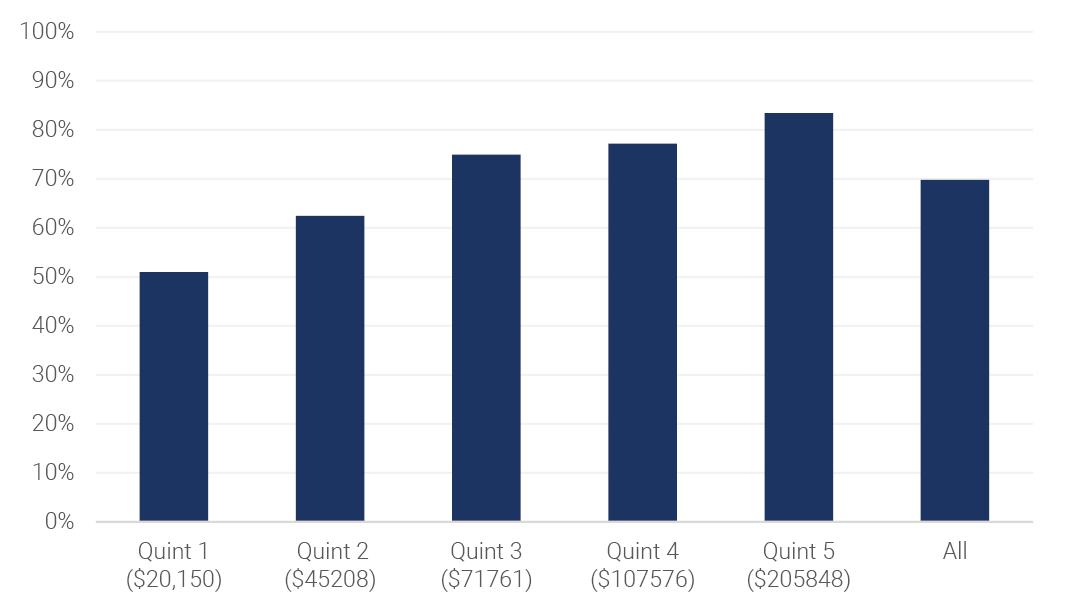
Source: Statistics Canada (2019). Dwelling characteristics, by household income quintile in Canada. In Statistics Canada, 2019. Survey of Household Spending.
A key development over the past decade-and-a-half has been the growth of the telephone companies’ (e.g. Telus, Bell, SaskTel) Internet Protocol TV (IPTV) services. This took place slowly at first but since 2010 the pace of IPTV development has quickened. By the end of last year, the incumbent telcos’ managed Internet-based television services had over 3 million subscribers between them. As a result, the telco’s IPTV services now compete extensively with traditional cable television services in cities across the country. Figure 8 below shows the growth in IPTV subscribers over the past decade-and-a-half.
Figure 8: The Growth of IPTV Subscribers in Canada, 2004-2019

Source: see the “IPTV” data sheet in the Excel Workbook.
The telcos’ revenue from IPTV service has also increased sharply from $1 billion in 2013 to nearly $2.1 billion last year–again, nearly double the amount six years earlier. Figure 9 below shows the trends.
Figure 9: The Growth of IPTV Revenues in Canada, 2004-2019

Source: see the “IPTV” data sheet in the Excel Workbook.
The addition of IPTV as a new television distribution platform has brought the telecoms operators deeper into the cable companies’ traditional turf. MTS, SaskTel and Telus first began to deploy IPTV in the prairie and western provinces in the mid-2000s, with Bell only following suit in the early 2010s, perhaps because it did not want to cannibalize its direct-to-home satellite television service. Fast forward to 2019, and the number of IPTV subscribers and revenue have grown considerably, accounting for over a quarter of the TV distribution market. Moreover, the fact that telecoms operators’ IPTV services have gained market share at the same time that “cord cutting” has picked up steam in the past five years has significantly added to the competitive pressure that the cable companies now face from the telcos’ IPTV services.
Figure 10 below illustrates these points.
Figure 10: Cable & Satellite Provider vs IPTV Revenues, 1984-2019 (current $, millions)

Sources: see the “IPTV” and “CableSatIPTV” data sheets in the Excel Workbook.
As Figure 10 also shows, cord cutting—the process whereby people drop their cable, IPTV or DTH service in favour of accessing audiovisual media services directly over the Internet (or over the air, or not at all)—has gained traction over the past five years. Thus, even though IPTV has grown substantially over the past decade, the number of subscribers for all broadcast distribution undertakings (BDUs as they are called in Canadian regulatory parlance) has slipped from 85.6% of households at its highpoint in 2011 to 75% last year. In short, the phenomenon of cord-cutting is real.
The loss in BDU subscribers that has taken place, however, has resulted only in modest revenue losses to the BDU sector; revenue fell from $8.9 billion in 2014 to $8.2 billion last year—a decline of 7%. This is largely because at the same time that cable subscribers were starting to cut the cord there have been steep increases in subscription prices for BDU services. Crucially, just as people have turned to access online subscription-based and download AVMS directly in lieu of a cable subscription, the price of Internet access has also jumped. In fact, the price of subscriptions for cable TV and Internet access have risen well above increases in the consumer price index, as Figure 11 below illustrates. The sharp rise in Internet access prices since 2010-2011, just as cord cutting was starting to cut into the cable operators’ revenues, is especially noteworthy.[8]
Figure 11: The Price of Communication Services and Devices vs the Consumer Price Index, 2002-2019

IPTV services are also critically important because they are the cornerstone of the telecoms operators’ efforts to bring next generation, fiber-based Internet networks closer to subscribers, mostly to neighbourhood nodes and increasingly to people’s doorsteps. In fact, the distribution of television and entertainment services are critical to driving the demand, and thus the revenue, that the telecoms operators need to invest in bringing next generation fibre optic broadband networks to people’s doorsteps (see below).
The rate of IPTV adoption in Canada has been relatively high by international standards. Just over 20% of households in Canada subscribed to IPTV services in 2019. While comparable international data for 2019 is not publicly available, this level of IPTV adoption is comparable to adoption levels for 2016 in Spain (where uptake of IPTV reached 20% of households), China (where it was 21%) and Sweden (17%) but well above the US (9%), Japan (8%), Germany (6%), the UK (7%) and Australia (7%). However, IPTV uptake in Canada still lags far behind where adoption levels were as of 2016 in France (40%), Korea (32%) and the Netherlands (30%) (Ofcom, 2017 p. 106).
While Canada has done fairly well with respect to IPTV availability and adoption, the picture changes for fiber-to-the-premise/doorstep (FTTP), which, as Susan Crawford (2019) observes, represents the gold standard of telecommunications networks, and will be a requirement for future economic growth. Indeed, just 17.2% of broadband connections in Canada use FTTP compared to the OECD average of 28%. At the high end of the scale, in Norway, Finland, Sweden, Japan and Korea, one-half to four-fifths of all broadband connections are fiber-based. According to the OECD, Canada ranked 26th out of 36 countries on this measure as of December 2019. Figure 12 below illustrates the point.
Figure 12: Percentage of Fibre Connections Out of Total Broadband Subscriptions (December 2019)
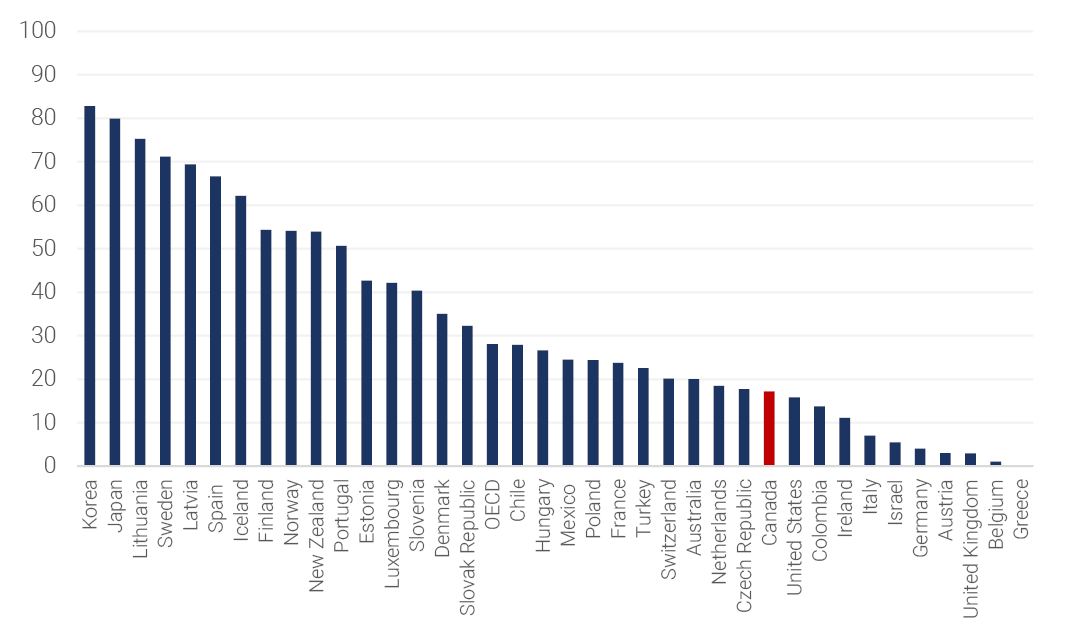
Source: OECD (2020). Broadband Portal, Table 1.10.
In sum, when it comes to fibre-optic networks, the prairie telcos and Telus were the first do deply them in the mid-2000s while Bell only began to do so in a substantial way after 2010. Globally, Bell’s late turn to IPTV and FTTP in Ontario, Quebec and Atlantic Provinces means that Canada continues to lag significantly behind comparable countries on this measure.
The general evolutionary pattern that we see replays a long-standing practice for new services to start out as luxuries for the rich before a combination of competitive markets, public pressures and public policies turn them into affordable necessities for people at large (see Richard John with respect to the US history, Robert Babe for Canada). Current debates over access to broadband infrastructure are the latest iteration of this old story (Winseck Reconvergence, Winseck and Pike, John, Babe, Middleton). In fact, this could be seen at the end of 2016, when the CRTC set new standards for universal and affordable broadband Internet service: minimum speeds of 50 Mbps up and 10 Mbps down to 90% of the population by 2021 (and the rest of the country a decade to a decade-and-a-half later), and with an unlimited option on offer—that is, an Internet connection with no data cap. While the idea of unlimited Internet service was the norm in Canada before 2010, and remains so for most people in the developed world, today it is just one available options amongst others and expensive in Canada. Policymakers have recognized that access to the Internet is no longer a luxury, and this has been made especially clear during the Covid-19 pandemic of 2020, large strides will be needed to ensure that aspirations meet the reality on the ground, as Canada’s standing with respect to deployment and adoption of fibre-to-the-doorstep reminds us.
A similar relatively large view of the public’s interests was pursued in early 2017 under the previous CRTC chair when the regulator adopted new rules that stop the telcos and ISPs from using zero-rating to pick and choose some services, apps and content that won’t count against subscribers’ monthly mobile wireless data caps while everything else does. While zero-rating can be attractive to the companies as a way to differentiate their services from those of competitors, and to some consumers who see this as way of getting data for “free”, such practices are better seen as marketing gimmicks propped up by artificially low data gaps and limited choices. In places where data caps are large or non-existent, zero-rating is rarely used, whereas in countries where they are low, like Canada, it is far more common—at least until the CRTC’s ruling that effectively banned it.
While mobile wireless markets tend to be highly concentrated wherever one looks around the world, it is the absence of stand-alone mobile network operators and maverick firms—a case that fits Canada—where data caps tend to be the lowest and the most extensively used. This phenomenon is further aggravated in contexts where telephone companies also own TV and entertainment services, as is in Canada, because under circumstances where vertical integration is the norm, carriers have both the incentive and the ability to zero-rate their own services while counting everything else towards subscribers’ monthly data allowance. In other words, several structural features of broadband and mobile wireless markets in Canada bias them toward low and restrictive data caps and pressure from service providers to adopt “zero-rating” as an alternative to giving subscribers bigger data allowances, or even making unlimited services the norm rather than an expensive and rare option (see, for example, Rewheel/Digital Fuel Monitor, 2018).
Ultimately, questions about zero-rating embody a philosophy of communication, one that says that when data caps are high or non-existent, people can use bandwidth to communicate, entertain, express themselves, work and do with as they want— within the limits of the law, of course. When they are low, however, what people can and cannot do with “the means of communication” at their disposal is restricted. Seen from this angle, the issues at stake are not just about prices but whether the speech and editorial rights of people, “content creators and distributors”, apps makers and service providers come first or whether those of the telephone companies and ISPs are paramount. In early 2017, the CRTC ruled in favour of the first group, and drew on the principles and history of common carriage[9] to do so (see Klass, Winseck, Nanni & McKelvey, 2016).
Both rulings—the new basic service standard and the zero-rating decisions—staked out a fairly ambitious view of what Canadians need and deserve in “the digital media age”. On the one hand, it includes affordable access to high quality communication services and gives priority to the speech and expressive rights of people, content creators, apps developers and service providers over the those who own broadband Internet access and mobile wireless networks. Consequently, people do not have to accept only what the market gives them because communication needs have been recast in a more expansive way in the light of conditions in the 21st Century.
On the other hand, the telephone companies do not like this run-of- events and have wasted no effort fighting to change it over the course of the last year. Thus far, however, their main success appears to have been only to slow down the pace of change. The ongoing reviews of the Telecommunications Act and Broadcasting Act, and the swapping out of the public interest friendly J.P. Blais for an industry insider in September 2017, however, are fraught with risk and there is already some evidence of back-peddling by the Commission.
When the new Chair of the Commission, Ian Scott, was given the reins of the CRTC he was met with skepticism but also a willingness amongst critics, reformers and public interest advocates to suspend judgement because in the recent past their early suspicions of appointees who seemed too close to industry—i.e. Tom Wheeler’s position at the helm of the FCC in the US in 2013—or too close to the government—i.e. Daniel Therrien, a former national security specialist in the Harper Government, as the head of the Office of the Privacy Commissioner a year later—ended up pursuing courses of actions that confounded early expectations, and with impressive results. That well of goodwill, however, is beginning to run dry in light of, for example:
- the new Chair’s seeming deference to industry insiders,
- the call to “harness” the internet to a model of cultural policy created over a half-century ago and maintained since, reinforced by a call from the Chair for an ISP levy in support of Canadian content (CRTC, 2018),
- the constrained basis for the Commission’s rejection of an industry proposed website blocking scheme designed to combat piracy (CRTC, 2018, TD 2018-384),
- and a seeming reluctance by the Chair to gird the CRTC’s collective spine to face the realities of persistently high levels of concentration and sky-high levels of vertical integration in key communications and media sectors that have that have not served citizens, consumers, creators or the public sphere well.
It may still be too early to render a final judgment on the current approach to policy and regulation at the CRTC. However, numerous warning signs have been sounded that should not be ignored.
Traditional and Digital Audiovisual Media Services (AVMS): From Ad-Supported Content Media to Fast Growing Subscription-based Digital Media
The remainder of this report shifts gears to examine ongoing developments in the media content sectors—also referred to as the AVMS sectors—in the context of the following four over-arching trends:
- the explosive growth of online advertising;
- the faltering growth for the rest of advertising spending across all media. Although advertising spending has remained fairly fixed relative to the size of the Canadian economy for decades, over the past decade it has fallen by about 10%, or approximately $1.5 billion per year based on the value of advertising spending last year. As a result, traditional media sectors and firms that depend primarily on advertising funding as the core of their business model are battling internet giants like Google and Facebook for a stagnant/shrinking pool of revenue;
- the core of the media economy is not advertising but a rapidly growing group of pay-per media and digital AVMS that are based primarily on subscriber fees and direct payments, although after growing rapidly for three decades, specialty and pay TV services have seen their revenue taper off since 2016.
These over-arching trends, in turn, are taken up in relation to an analysis of the following digital and traditional audiovisual media services (AVMS) that make up the content media sectors of the media economy:
- Internet advertising
- broadcast TV;
- pay and specialty TV;
- online video subscriber and download services such as Netflix, Crave, Amazon Prime Video and Illico;
- radio;
- music, including recorded music, live concerts and revenues from publishing royalties;
- online music subscription and download services such as Apple iTunes and Spotify;
- online gaming, gaming applications, game downloads or in-game purchases;
- app stores (e.g. Google Play and Apple Appstore);
- newspapers;
- magazines;
- online news.
Anchor Findings
• online advertising continues to grow rapidly, with nearly all growth captured by Google and Facebook.
• regulators must contend with the consequences of this duopoly not only in online advertising, but also to curb their ability to leverage that dominance into adjacent media sectors.
While overall advertising spending has been buffeted by unsteady economic conditions for more than a decade, the growth of online advertising has continued to surge ahead. By last year, Internet advertising revenue in Canada had reached $8.8 billion—up from $7.7 billion a year before that and worth more than four times what it had been a decade ago.
It is clear that the two biggest beneficiaries of this soaring growth have been Google and Facebook, with estimated revenue from online advertising of $4.4 billion and $2.6 billion, respectively, last year. Google single-handedly now accounts for half of the Internet advertising market, while Facebook’s share is rapidly approaching the one-third mark. Together, they controlled four-fifths of the online advertising market in Canada in 2019—up significantly from a little over two-thirds share of the market five years ago.
Moreover, a majority of the new growth in Internet advertising revenue between 2018 and 2019 ended up in their coffers, although the pace of this development was down substantially from previous years when Google and Facebook took four-out-of-five dollars in new growth. In short, the digital duopoly now stand in a league of their own and their grip on the online advertising market is tightening.
Open the lens wider to examine the adverting spending in all media, e.g. Internet, television, radio, newspapers, magazines and out-of-home—and the picture, however, becomes more complicated.
First, total advertising spending in Canada last year reached $15.6 billion, but growth remains sluggish. Yet, within the context of the much larger but sluggish overall advertising market, Google and Facebook have emerged as the two biggest recipients of advertising revenue as well, light years ahead of Bell, Shaw, Rogers, Quebecor, Postmedia, Torstar and the CBC, in that order. Google, for example, now accounts for 28% of all advertising spending in Canada, while Facebook’s share has risen rapidly to just under 17% last year.
In sum, the digital advertising behemoths had an outsized 45% stake of the advertising market last year, up from 36% two years earlier. Bell, by comparison, attracted just over 10% of all advertising spending in Canada at the time. All told, these changes have propelled Google into being the fifth largest company operating in the media economy in Canada, after Bell, Rogers, Telus and Shaw; Facebook comes seventh after Quebecor.
That said, it is essential to simultaneously grasp the quick growing influence that Google and Facebook have amassed while not overstating the scale and scope of their clout across the media landscape. In the present case, for example, while their dominance of online advertising is clear-cut, their influence on the advertising market across all media requires a more nuanced assessment.
On the one hand, there is little doubt that controlling more than a quarter of all advertising revenue in Canada gives Google enormous power over the advertising market. Google and Facebook’s combined market share of 45% points in a similar direction. On the other hand, however, the assessment is mixed when using standard indicators of market concentration. For example, using the CR4 method[10], the “total advertising market” is only modestly concentrated, with the top four firms—Google, Facebook, Bell and Shaw (Corus)—accounting for 62% of the market. However, by the lights of the HHI approach, it remains highly competitive, with the HHI score of 1272 being at the low end of the scale (see “Internet Advertising Market share, 2014-2019” and “Ad$ All Media” sheets in the Excel Workbook). We will deal more with the implications and possible responses to Google and Facebook’s lock on online advertising, and their growing influence over the advertising market writ large, and potential regulatory responses to that growing clout, in the second report in this year’s series.
Within Canada and globally, Google’s dominance of online advertising is girded by the fact that it has vertically integrated its search and online advertising functions with its own proprietary digital advertising exchange, to say nothing of the dominant position it holds in relation to mobile and desktop browsers, the Android mobile operating system, and Google Play app store (typically in duopolistic rivalry with Apple in each of these areas). The cornerstone in Google’s sprawling reach across the Internet stack, however, is the online advertising system that it has assembled through a series of acquisitions over the last decade (e.g. DoubleClick, AdMob, etc.). By assembling its own online advertising exchange, Google has, in essence, erected a walled garden around its services as well as the buying and selling of audiences on the Internet, a stark contrast from its early promise to help people navigate the ‘open Internet’ and slay the walled gardens that had emerged in the late-1990s.
While Facebook does not have its own digital advertising exchange, both it and Google share the fact that they control the common currency used to buy and sell audiences and advertising inventory on the Internet: detailed and intimate knowledge of their audiences. Each company also has its own audience measurement and rating system that allows them to control the terms of trade upon which the online advertising system functions.[11] By controlling the building blocks of the online advertising system both companies are able to effectively hold third party advertising campaigns hostage because neither of them interconnect with one another, or with other digital platforms. Consequently, advertising campaigns, and the data, costs, and labour behind them, are not portable between competing advertising exchanges, thereby allowing Google and Facebook, in effect, to use this control to hold audiences and advertisers hostage. This raises the prospect of using mandated data portability, network interoperability and interconnection obligations to put a dent in their dominance(another point we will return to in the next report).
For its part, Facebook had 21.5 million users in Canada at the end of 2019 and revenue of $2,614 million. The company has benefitted in particular from the shift from “desktop Internet” to the mobile Internet. Thus, while Facebook had only a few dozen people working on the mobile Internet version of its app as late as 2012, by the end of that year it had done an about face as it set out to make the mobile Internet its new frontier of expansion. As a result, the mobile version of Facebook’s service is now the centre of the companies’ operations.
The growth rate for the number of people using the company’s three main services—Facebook, Instagram and WhatsApp—in Canada has been swift, to say the least, over the past decade but it has slowed in recent years. Slowing growth in the size of Facebook’s user based has not caused revenue growth to stall, however, because the company has focused on sharply increasing the monetary value of each user. And it has succeeded at this as well. The annual average revenue per Facebook user (ARPU) in Canada last year was $121.58—double what it was three years ago and ten times what it was in 2011.[12]
Figure 13 below depicts the growth of Facebook’s revenue and ARPU in Canada since 2011.
Figure 13: Facebook’s Revenue (millions$) and Average Revenue Per User (ARPU) Soar, 2011-2019
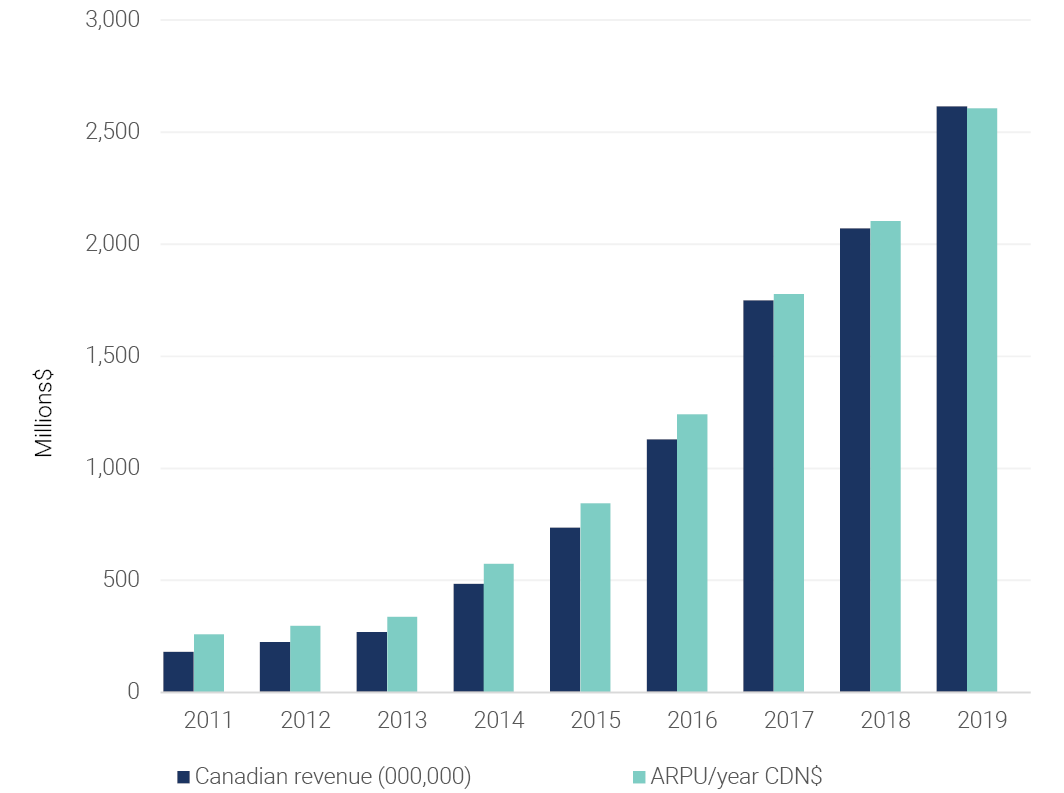
Source: see “App Economy” sheet in the Excel Workbook.
In sum, Google and Facebook have become major players in Canada in a short period of time. They form a duopoly in Internet advertising and the scope of their influence is growing in relation to the overall advertising market. Based on these trends, it has become an article of faith in many quarters—academic, industry, think tanks and advocacy groups, policy-makers and regulators—that Google and Facebook are primarily to blame for the existential crisis now being faced by the media in Canada. While this account of the domestic media industries being decimated by a clutch of rapacious Internet giants headquartered in Silicon Valley might seem to be compelling at first blush, it is superficial and deeply misleading.
For one, most sectors of the content media are vibrant and have grown considerably over the thirty-five years covered by our project. However, there are four exceptions to this general rule: broadcasting television, radio, newspapers and magazines, all of which rely primarily on advertising funding and have been in decline since 2008.
While advertising continues to be the most significant source of revenue for the media content sectors, it is swiftly being eclipsed by others that depend mainly on subscriber fees and direct payments. For example, revenue for specialty and pay TV services doubled in the last decade to $4.4 billion in 2016, before tapering off to $4.2 billion last year. Simultaneously, however, subscription-based and download video and music services as well as online games, apps, downloads and app stores are rapidly becoming the engines of growth across the AVMS sectors. The combined revenue for these sectors soared eight-fold from $719 million to $5.6 billion between 2011 and last year. Taken in their entirety, and in sharp contrast to the usual story, there is no general crisis of the media in Canada and the content media sectors have grown immensely over time: their revenue in 1984, was $5.6 billion; last year it was $27.7 billion.
Figure 14 below depicts the long-term growth of the content media sectors over the period covered by this project.
Figure 14: Rising Revenues for the Content Media Industries, 1984-2019 (current $, millions)
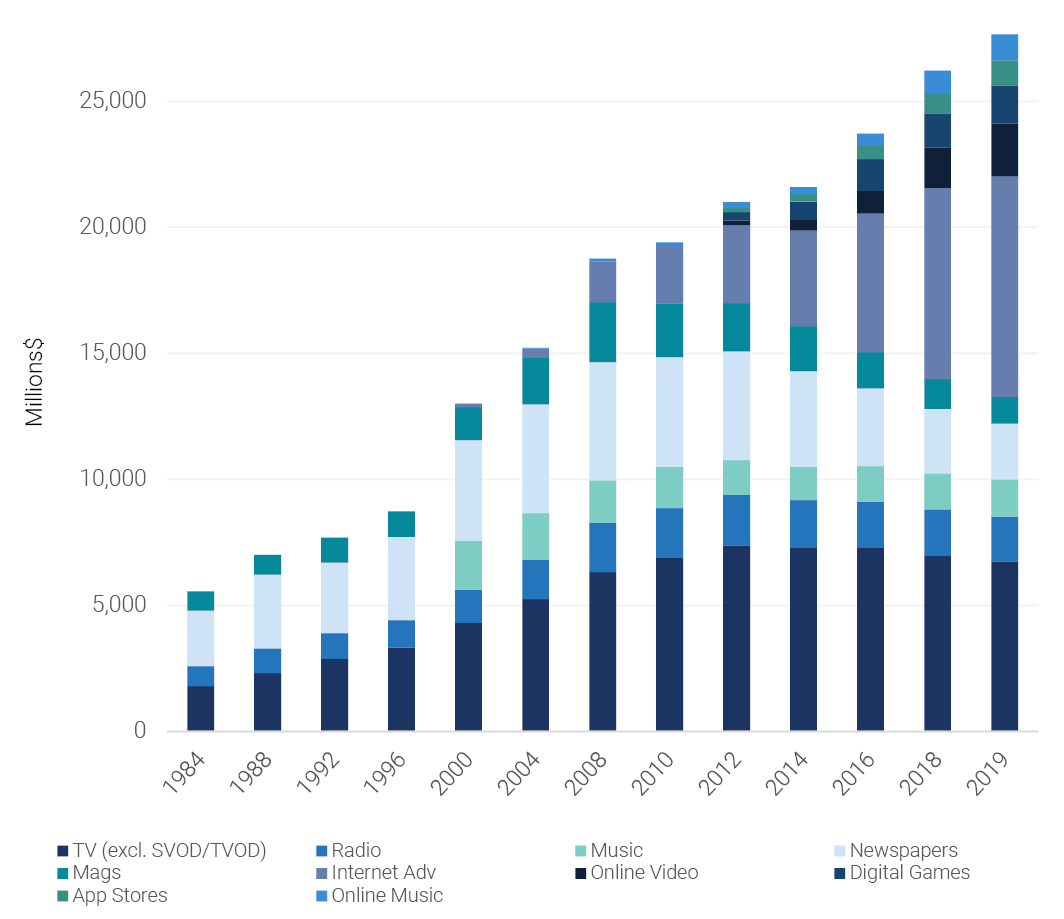
Source: see the “Media Economy” sheet in the Excel Workbook.
Growth for nearly all content media sectors was steady, even brisk, until the financial crisis of 2008, except for several years in the early 1990s recession and again just after the collapse of the dot.com bubble at the turn-of-the-century. Since 2008, however, revenue for advertising-funded AVMS sectors have fallen sharply, while those based on subscriber fees and direct purchases have proved far more resilient and, in the vast majority of cases, have grown rapidly. These ongoing trends and patterns reflect the fact that advertising spending—and thus the fate of advertising-funded media—follows the twists and turns of the economy in lockstep fashion (see Picard, Garnham, Miege, and Vogel).
Since 2008, total advertising spending has slowed, stagnated or shrunk, in real dollar terms, relative to the size of the Canadian economy (gross domestic income), in relation to the size of the media economy and on a per capita basis. Although this trend has abated in the past two- to three years, the “lost decade” before that brought about by slumping, stagnant and/or slow advertising growth since 2008 means that $800 million to $2.3 billion in ad revenue per year has vanished relative to what it would have otherwise been had “normal” growth rates held steady—roughly a billion-and-a-half dollars per year if we split the difference.[13] Figure 15 below illustrates the wreckage.
Figure 15: The Rise and Fall of Advertising-funded Traditional Media, 1984-2019 (millions, current$)
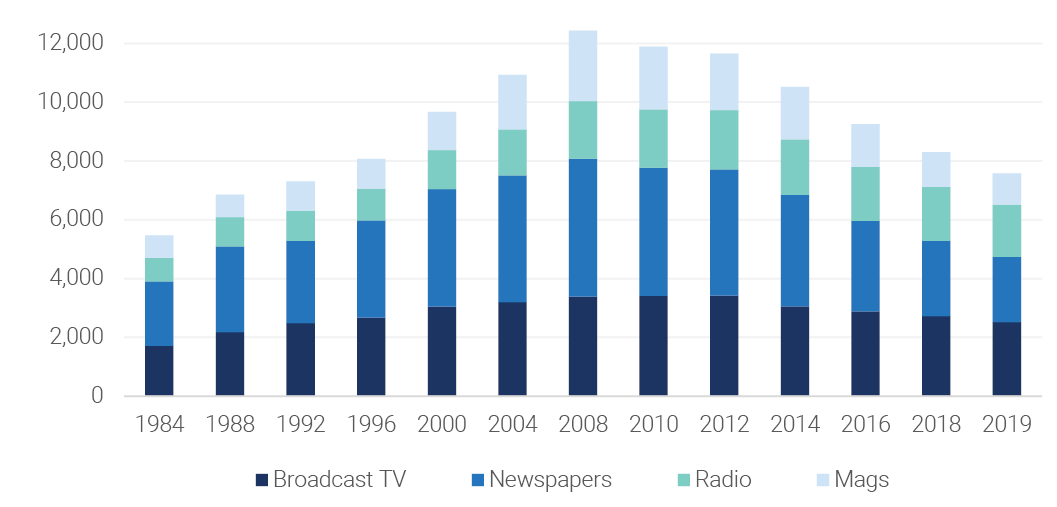
Source: see “Media Economy” sheet in the Excel Workbook.
All told, the contraction in advertising spending has hit the four sectors of the media that have historically been the most reliant on advertising hard: broadcast television, radio, newspapers and magazines. Collectively, their revenue has plummeted by $4.9 billion since 2008. This trend is unlikely to turn around any time soon.
That the fate of advertising spending—and thus the media that rely on it—hinges on the state of the economy can be seen by tracking the ups and downs of advertising revenue since 2008. During this time, for example, advertising spending grew from $11.5 billion to $15.6 billion in nominal terms. However, almost all of that growth occurred in the last three years. Also, if you switch the metric to real dollars, the story is even grimmer; revenue hovered between $13.5 and $14 billion from 2008 to 2015 (CAGR of .44%) before slowly rising again to $15.6 billion last year (i.e. CAGR of 1.3%).
Figure 16 below reveals the period of relatively low to no growth between 2010 and 2016, and the slow increase since, as well as changes over time in terms of which media type gets how much of the advertising pie.
Figure 16: The Stagnating Advertising Economy, 2004-2019, I—Advertising Revenue for Television, the Internet and “All Media” (real $ 2019, millions)
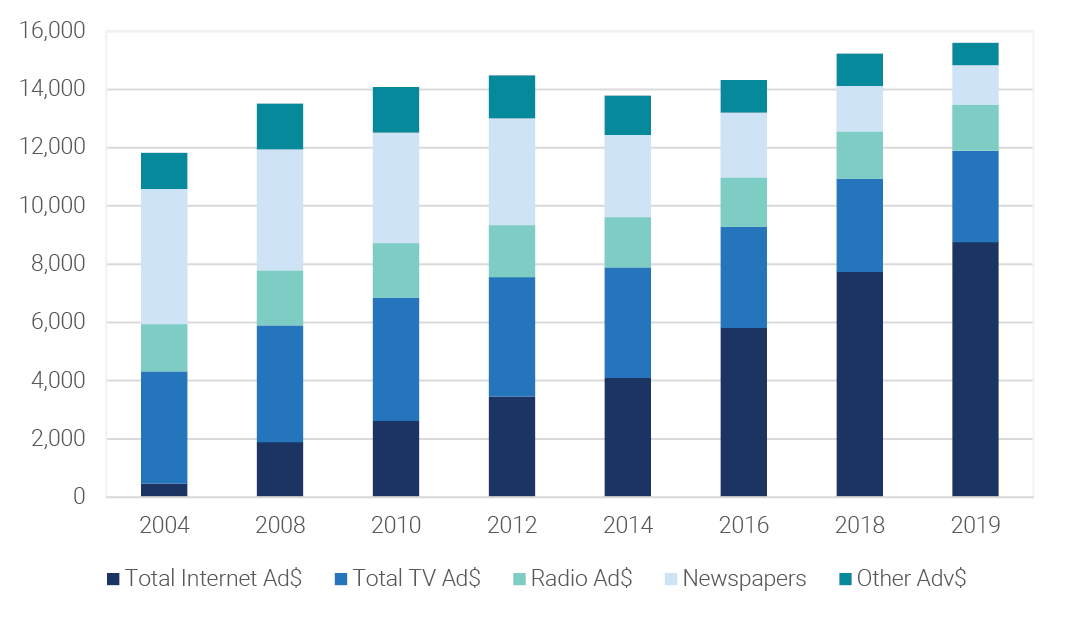
Source: see the “Ad$ All Media” sheet in the Excel Workbook.
Looking at advertising revenue on a per capita basis (in real dollars), advertising spending fell sharply from $405.90 per person in 2008 to $388.20, then bounced around at relatively low levels for a decade, before finally returning to its previous levels in the last year or two. In 2019, advertising spending was $420.10 per capita—a painfully slow CAGR of .33% for just over a decade. In terms of advertising earmarked for television, it has slid continuously from the first decade of the 21st Century when it hovered around $110-$120 per person (in real dollars) to $84.40 per capita last year. The fortunes of Internet advertising, of course, have run in exactly the opposite direction, quadrupling from $57 per person in 2008 to $233 last year. Figure 17 below depicts these points.
Figure 17: A Ceiling for Ad Spending?: Advertising Spend per Capita, 2004-2019 (real $ 2019)

Source: see the “Ad$ All Media” sheet in the Excel Workbook.
Figures 18 below also reveals a pattern of stagnating or shrinking advertising spending relative to the size of the network media economy over the last decade. In this case, advertising spending levels remain lower today than they were a decade ago.
Figure 18: Ad Spend as a Percentage of the Network Media Economy, 2004-2019

Source: see the “Ad$ All Media” sheet in the Excel Workbook.
The downward pressure on advertising can also be seen in terms of GDI, as shown in Figure 19 below. Historically, advertising spending as a portion of the Canadian economy has stayed relatively fixed at roughly .68 to .7% of gross domestic income (GDI), a rate, incidentally, that is significantly lower than in the United States, probably serving as an index of the less commercialized character of the media and society in Canada relative to the US. In 2019, however, after nearly a decade of anemic and unsteady economic growth, this measure, too, still sat at the lower ends of that range.
Figure 19: Ad Spending as a Percentage of Canadian Gross Domestic Income, 2004-2019
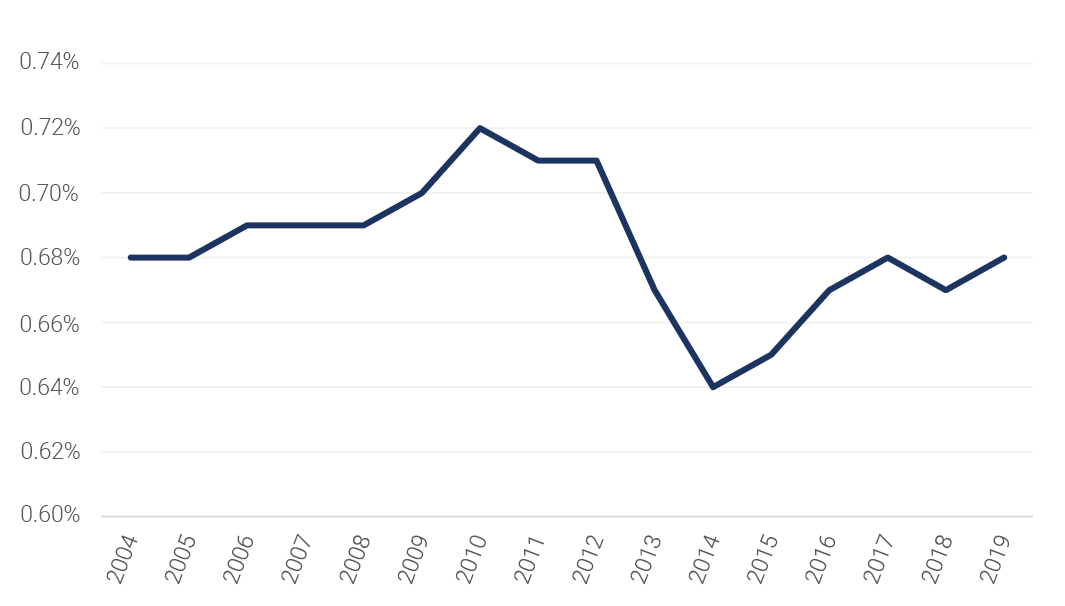
Source: see the “Ad$ All Media” sheet in the Excel Workbook.
The upshot of these observations cannot be understated. While Google and Facebook are undoubtedly implicated in the dire situation faced by those media sectors and firms that rely primarily on advertising revenue as the centre of their business models, they are not the primary cause of it.
Instead, the situation reflects a confluence of structural conditions stemming from the state of the economy as well as self-inflicted wounds incurred over a quarter-of-a-century of excessive mergers and acquisitions that have since taken their toll (see the next report for more detail). To date, however, those who blame Google and Facebook for stealing away ad revenue from media companies in Canada—and precipitating a “crisis of the media”—have had nothing to say about these other deeper and broader forces, preferring to focus the blame on a convenient scapegoat—the “Web Giants”—instead.
Anchor Findings
• Broadcast television has been in decline since 2011.
• After several decades of strong growth, specialty and pay television services have also seen revenue slip since 2016.
• Rather than cannibalizing existing revenues, online video services have substantially grown the market for audiovisual media content in Canada.
• Canada’s film and television production industry has seen record high investment in new productions in the past several years, with investment levels in 2019 nearly double what they were a decade ago.
• The integration of broadcasting and pay television industries with one another—and into the operations of the country’s largest telecoms operators—is unique to Canada and may have dampened competitive pressure and reduced their ability to respond to market developments and broader shifts in AVMS, as seen in other international markets.
Advertising for broadcast television grew more or less steadily until reaching a high point of $2.5 billion in 2010 and 2011. Despite suffering the initial shock of the 2008 financial crisis like the rest of the commercial media, advertising revenue for broadcast television rebounded for the next few years but the reprieve was short-lived. Despite some fluctuations along the way, advertising spending on broadcast television has dropped from $2.5 billion in 2011 to $1.8 billion last year. The shift of some advertising dollars to specialty cable and satellite channels such as Discovery, TSN, RSN, the Cartoon Network, etc. has helped to recover some of the slack, but overall advertising across the total TV landscape has declined from a high of $3.8 billion in 2011 to $3.1 billion last year.
We see similar trends playing out in the radio sector, where revenues peaked in 2011, at $2,016 million (including the CBC’s parliamentary appropriation). They have fallen slowly but steadily since, reaching $1,779 million last year (current dollars).
Cut-backs by the previous Conservative Government to the CBC of $126 million after 2012, and the loss of $121.1 million in payments from the Local Program Improvement Fund after 2013 until it was phased out completely by 2015, further compounded the woes facing the CBC and broadcast television stations earlier this decade (see the CBC, Annual Reports and the CRTC, CBC Aggregate Annual Return French and English for these years).
Overall broadcast TV revenues, including the CBC and its annual Parliamentary funding, slid from an all-time high in 2011 of $3,501.7 million to $2,518.6 million last year—a 28% decline. As a result of these trends, eight local TV stations have been shuttered since 2009: CHCA (Red Deer), CKNX (Midwest ON), CKX (Brandon), Sun News (Toronto), three of Rogers Omni affiliates in BC, Alberta and Ontario, and another station in Kenora that was closed by Shaw in 2017 (Lindgren & Corbett, 2020).
Alongside these trends, job lay-offs and cut-backs have become a constant theme. Between 2012 and 2015, for example, local news staff at broadcast TV stations was cut by 4%, according to Colette Brin’s contribution to the Reuters Institute’s 2016 Digital News Report (p. 80).[14]
A study prepared for the Friends of Canadian Broadcasting and Unifor by Peter Miller (2015) estimated that half the local TV stations in fifty-six small and mid-size cities across Canada, and an additional 900 jobs, could be lost by 2020 if the major policy changes advocated by the report were not adopted (pp. 14-15). While such outcomes would decimate local broadcasting if they came to pass, we have reached the date of that dire scenario and can say that the report’s predictions have not come to pass. This outcome, in turn, serves as a reminder that ongoing tallies of job losses as well as predictions from lobby groups and hired consultants along the lines just reviewed are often sensationalist and wide of their mark.
Conditions have been severe enough, however, to have spawned two reviews in 2016 of the state of local news and journalism in communities, one by the Canadian Heritage Parliamentary Committee and another by the CRTC. Both reviews added further insights into the situation but ultimately struggled to come up with workable solutions to the problems at hand. That said, they were part and parcel of broad ranging efforts in many quarters that led the Liberal Government later that year to add $675 million to the CBC’s annual funding envelope spread out over the next five years. While these new funds countered the cuts to the CBC undertaken by the previous government, they do not come close to offsetting the decline in advertising revenue at the CBC.
In sum, four points help to explain the stagnation and decline of broadcast TV over the last decade:
- declining advertising revenue since 2011;
- budget cuts to the CBC;
- the phasing out of the Local Program Improvement Fund between 2012 and 2015;
- the big four commercial TV providers – Shaw, Bell, Rogers and Quebecor – shift of resources from their broadcast TV holdings to the vast stable of pay, specialty and other subscriber-based TV services that they own (i.e. mobile, IPTV) (see the CRTC’s Individual Financial Summaries for a list of the 105 pay and specialty services the big four combined owned as of 2019).
While the dire condition of broadcast TV in Canada is obvious, a crucial question remains as to why things are so poor relative to conditions in the US and some other countries? To put this another way, while broadcast TV is not thriving anywhere, the turmoil in Canada is especially severe. Why?
While we must be cautious about identifying any one cause for the dramatically different situations in Canada versus the US (and elsewhere), one key difference stands out: broadcast TV providers in the US (and elsewhere) are not nearly as integrated into the telecoms-Internet sectors and specialty and pay TV services as they are in Canada (a point that will be taken up in greater detail in the second report of our annual series). In fact, broadcast TV ownership groups in the US are sizeable, independent entities in their own right, unlike Canada—where all of the biggest commercial broadcast TV as well as pay and specialty TV services are owned by one and the same players, e.g. Bell, Shaw (Corus), Rogers and Quebecor (see FCC, 2018, para 90). Other than Comcast’s ownership of NBC Universal, for example, none of the main broadcast TV ownership groups in the US have been owned by telecoms companies or BDUs (although this changed somewhat after AT&T’s take-over of a raft of pay television services, including HBO, when it acquired Time Warner in 2018) (see FCC, 2018, para 67).
Yet, even accounting for AT&T’s acquisition of Time Warner in 2018, Canada still stands alone from its international peers in terms of its extraordinarily high levels of diagonal and vertical integration across the entirety of the network media economy (for a fuller elaboration of this claim, see CMCRP, 2016). Despite this, the current chair of the CRTC acknowledges the high levels of vertical integration in Canada but appears to take a sanguine view of such matters when he, incorrectly, asserts that “this trend toward vertical integration was not unique to Canada” (Scott, 2019).
The existence of separate broadcast TV and pay TV ownership groups in the US creates conditions that drive them to compete head-on with one another rather than to function as arms of the telecoms giants that then operate with one eye fixed on their rivals and the other on ensuring that whatever competitive strategies they adopt do not side-swipe other aspects of their vertically and diagonally-integrated telecoms-Internet and TV operations. Conditions similar to those in the US also hold true in Europe.
Second, because of their independent ownership, stand-alone broadcast TV services in the US compete vigorously with specialty and pay TV services as well as online video rivals like Netflix, Hulu, CBS All Access, Disney+, Viacom-owned PlutoTV and Amazon Prime. Indeed, big broadcast groups in the US are sizeable entities in their own right; notable examples include CBS, Sinclair, TEGNA, Comcast, E.W. Scripps, Gray, Nexstar, Univision, Walt Disney, Fox, and Media General. Other than Disney (the ABC network) and Fox, however, broadcast TV ownership groups tend not to also own a fleet of specialty and pay TV services – again, unlike Canada—where all of the large commercial broadcast TV as well as pay and specialty TV services are owned by one and the same players, e.g. Bell, Shaw (Corus), Rogers and Quebecor.
Consequently, the US broadcasters are more eager to exploit the opportunities of putting their programming online to allow audiences to watch programs from anywhere using any device and to engage in “catch-up” viewing outside the constraints of the over-the-air broadcast schedule than their Canadian counterparts. Putting programming online also opens a new line of advertising revenue that they have exploited to far greater extent than Canadian broadcasters. As a result, online advertising has contributed more to the bottom line of broadcast television stations in the US than in Canada, growing from 5% of their revenue in 2012 to 8% in 2017 (FCC, 2017, para 119; (see FCC, 2018, para. 101). By contrast, online advertising revenue for television services in Canada lags considerably, rising from 3.2% in 2012 to 6% in 2019 (see the Ad$ All Media sheet in the Excel workbook).
In other words, common ownership of distribution and broadcast services has taken significant sources of revenue off the table for broadcasters in Canada. This has no doubt contributed to the severity of their woes. Yet, once again, instead of considering these self-induced structural sources of the plight of broadcasting in Canada, however, most observers are content to blame the Internet, GAFAM and Netflix.
In addition, as a result of their structural independence,[15] broadcast TV ownership groups in other countries are compelled to compete vigorously on their own—they sink or swim on the merits of their service offerings. Unlike their Canadian counterparts, they have no integrated or affiliated operations in adjacent markets to fall back on or strategically consider. The results of this dynamic can be seen, for instance, in the fact that the number of US households that are broadcast-only has steadily risen in recent years, from 10% in 2015 to 13% in 2017 (see FCC, 2016; FCC, 2018, para 109). Broadcast network affiliates’ and independent TV stations’ “total day share of viewing” has also increased from 30% in the 2012-2013 to 33% in the 2015-2016 season, while prime time viewing rose from 33% to 36% over the same period. Overall, broadcast TV revenue in the US rose from $24.3 billion in 2013 to $30.7 billion in 2017 as well (see FCC, 2018, para. 101; FCC, 2017, paras 116-119; FCC, 2016, paras 116-119).
For all the woes affecting broadcast TV, the overall TV universe continues to expand and to offer people a richer and more diverse range of choices. Looking beyond the Cassandra calls of industry-friendly policy rhetoric, one quickly discovers vibrant, new centres of development, while established operators are forced to adapt to changes in technology, the structure of markets, and how people watch and use television. As has been emphasized throughout this report, the real growth in television has been in subscriber fees and the pay-per and internet-based streaming and download audiovisual media services—a case that it is just as true in Canada as it is in many countries around the world.
The UK regulator, Ofcom, underscores the point: “Subscription revenues [worldwide] continue to be the key driver of this growth, rising by 5.4% to reach £125bn, just over half of total revenue”, and a cumulative annual growth rate of 5.3% over the last five years (Ofcom, 2015, pp. 139-141). As Ofcom’s (2017) most recent report observes, “Pay TV remains the largest source of TV revenue across comparators” (p. 97). The same applies to Canada.
Once we widen the lens to look at the fastest growing areas of television, it is clear the chorus of voices declaring the supposed “death of television” are singing off key. Specialty and pay TV services, online video streaming and download services, and IPTV have all done especially well. Pay and specialty TV services are a case in point. During the first decade-and-a-half of the 21st Century, the number of such services operating in Canada soared, and so did revenue, although that pace has stalled since 2016.
Specialty and pay TV revenue eclipsed that of broadcast TV in 2010, when revenues reached $3,474.6 million. By 2019, specialty and pay TV revenue was $4,233.1 million—down from its all-time high of $4,415.6 million in 2016. Today, the new engine of growth is shifting to online video streaming and download services.
Yet, as with broadcast television, the high levels of vertical integration between telecoms and cable operators, on the one side, and pay TV services, on the other, and diagonal integration between both broadcasting and pay TV services, has compromised the business viability of pay television services in several respects. First, as we saw a moment ago for broadcast TV, in the US, UK and Europe, where high-levels of vertical and diagonal integration do not hold sway, pay TV providers have been quicker to unbundle specialty and premium pay TV services from an underlying cable subscription and to make them available over the Internet. Examples include Time Warner’s HBO (although this, too, has been clawed back after Time Warner’s integration into AT&T), Disney’s ESPN and Disney+, several services owned by Viacom-CBS, and major sports leagues like the NFL and MLB. As AVMS providers only, these operators’ goal is simple: to get their programming before as many people across as many platforms as possible with less concern that offering their services over the Internet and mobile wireless networks might cannibalize the subscriber and revenue base of an affiliated BDU—at least not to the same degree, since BDUs are still their main source of revenue (see FCC, 2018, paras 76-81, 101).
In short, the highly consolidated and integrated structure of the television market in Canada discourages the development of stand-alone video-on-demand services delivered over the Internet by the big four vertically-integrated communications and media conglomerates, i.e. Bell, Shaw, Rogers and Quebecor. Thus, HBO in Canada, for example, is currently locked up with Bell under an exclusive contract that runs until 2025. All-in-all, these entities owned 105 of the most lucrative specialty and pay TV services last year, and accounted for four-fifths of all revenue in this sector.
By giving away their on-demand content “for free” in this way, independent pay TV services essentially abandon the potential to earn additional revenue from one of their most attractive assets: online access to their programming from anywhere, using any device. Moreover, they are also trading dimes on the potential dollars that they might obtain from going with a online VOD service such as Apple or Amazon.
In sum, the policy-driven state of consolidation and exceptionally high levels of vertical integration has put Canada into an undesirable league of its own. In so doing, what was supposed to be a panacea for Canada’s supposedly small media economy has, in fact, hobbled the business viability of television services significantly. Under the current arrangements, the benefits of choice and agency for users, as well as potential new streams of revenue and distribution opportunities for smaller players in the industry, are sacrificed in favour of preserving a handful of vertically-integrated “national champions” who stand astride the communications and broadcasting system in Canada. They may present themselves as guardians of Canadian culture when in fact they more closely resemble jealous gatekeepers preserving their own interests.
Lastly, the structure of the communications and television landscape in Canada also gives rise to one other crucial condition that continues to hobble the advent of online video subscription services. In this respect, it is important to note that not only are all the major commercial television services owned by telecoms companies but there are no stand-alone mobile wireless operators left after Shaw acquired Wind (now rebranded as Freedom) in 2016. This is important because, without a stand-alone, competitive mobile phone operator, prices for mobile phone service and data tend to be higher and data caps significantly lower, and the cost of exceeding them steeper. The upshot is that the steep price of data, restrictive data limits and expensive overage charges deter the use of new media to consume all forms of audiovisual content, including broadcast TV (see Rewheel, 2016; Rewheel, 2018). Forward looking communication and media policy should pay close attention to these considerations and evaluate what has been gained and lost by tying the fate of audiovisual media services to vertically-integrated national champions.
In order to complete the picture of the “Total TV Universe” we now examine online video subscription and download services. At the outset, however, it must be acknowledged that doing so is difficult given the dearth of reliable publicly available information, not only from the service providers (e.g. Netflix, Amazon Video, Apple, Bell’s Crave or Rogers’ SN Now) but from the CRTC as well. That said, it is possible to develop sound estimates based on these companies’ annual reports, recent changes to how Netflix reports its operating results to US regulators, taking into account year-over-year growth for other providers and using publicly available information.[16]
Since Netflix first entered Canada in late 2010, many new players have joined the fray, including BCE’s Crave, Amazon Prime, Apple TV+ and iTunes, Club illico, CBC Gem, Google Play as well as that company’s YouTube Premium and Subscription services, while a few services, such as Rogers and Shaw’s joint venture, shomi, have exited the scene. Others continue to enter the market on an ongoing basis, such as Disney+ entry into Canada late last year. The analysis in this report, however, focuses on the biggest online video services operating in Canada for the better part of 2019.
In 2019, estimated revenue for the online AVMS market in Canada reached $2.1 billion. Growth continued to be swift based with a compound annual growth rate of 33% over the past three years and revenues more than tripling from $648.1 million in 2016.
Netflix is the biggest online video service player in Canada by far. While it has been difficult to estimate its subscriber and revenue numbers in the past, this has become easier since December 2019, when the company changed how its reports its financial and operating results to the Securities and Exchange Commission in the United States. These changes allow us to break out revenue and subscriber figures, respectively, for the US, which leaves a residual in both cases from its broader US-Canada (UCAN) region that can be attributed to Canada (see Netflix (21/01/2020). Form 8-K SEC, pp. 13 & 15). These are the figures for the company’s operations in Canada that we cite in this report.
Thus, at the end of 2019, Netflix had 6.62 million subscribers in Canada, up nearly 350,000 over the previous year. As a result, nearly half of all households (46%) in Canada subscribed to Netflix by the end of 2019. The company’s Canadian revenue reached $1.1 billion last year, up from $822.6 million the year before and triple what they had been just five years earlier.
Bell’s streaming service Crave is the second largest SVOD service in Canada. Last year it had 2.6 million subscribers at year end and estimated revenue of $292.5 million. Apple, Google and Amazon’s estimated revenues for online video services in Canada in 2019 were $202.8 million, $147.4 million and $139.5 million, respectively. Add the estimated revenues for Rogers SNN ($172.7 million), Quebecor’s illico ($52.3 million) and CBC Gem ($13.6 million), respectively, and total revenue for online video services in Canada in 2019 was an estimated $2.093 million.
Figure 20 below depicts the revenues of the major digital AVMS operators in Canada last year.
Figure 20: Online Video Subscription and Download Services in Canada, 2012, 2015 and 2019 (current$, millions)

Source: see the “Top 20 with Telecoms” sheet in the Excel Workbook.
Our estimates diverge significantly from those that the CRTC has published in its annual Communications Monitoring Report for the past three years (see, for example, CRTC, CMR 2019, pp, 165-168). While the Commission has provided some useful insights into the fast-paced growth of Netflix, Amazon Video, Apple’s iTunes, etc., its estimates for the revenues and subscriber numbers for foreign online AVMS providers have been implausibly high. The recent changes to Netflix’s reporting methods, in fact, reveal that the CRTC’s estimate for Netflix’s 2018 revenue in Canada of $1,643 million is double what the company itself now discloses.
The same assumptions that led to these inflated results for Netflix also appear to underpin the Commission’s estimates for all of the other foreign streaming and download video services it covers: Amazon Prime Video, Apple, Microsoft Movies & TV, Google Play, and so on. The overall effect, in turn, is to inflate the bottom-line value of the online subscription and download video market as a whole. Last year’s figures from the CRTC, for example, reinforce that impression by stating that total revenue for subscription and download video services soared by about seventy percent, shooting up as a result from $1.8 billion in 2017 to over $3 billion last year. (compare, for example, CRTC, CMR 2019, p. 165 with CRTC, CMR 2018, p. 249).
As indicated above, a more accurate figure is about half that amount. The consequence is not just that individual companies’ revenues are inflated, but the influence of international online video services in Canada as a whole relative to domestic players such as Bell’s Crave, Quebecor’s Club illico, Rogers SNN, and the CBC’s Gem. Curiously, the CRTC does not publish results for domestic online video services, furthering the impression that the data is being selectively presented. It also unduly handicaps independent research.
Beyond questions about the veracity of the CRTC’s numbers, we are also concerned that its estimates are being used as a kind of “threat inflation” that serve its own interests in bureaucratic expansion while also playing into the hands of those who claim that the scale of international online video service operations pose a mortal threat to Canadian broadcasters and to Canadian culture. This looks a lot more like a captured regulator rather than one that is committed to furthering the public interest. At the same time, the publication of such erroneous estimates under the CRTC’s imprimatur gives them a sheen of legitimacy that others trade on in the context of domestic political and policy battles over what a new generation of Internet regulation in Canada should like. This is, for example, what the Broadcasting and Telecommunications Legislative Review Panel’s (2020) Canada’s Communications Future report does as it recycles the Commission’s estimates for Netflix, Apple, Amazon, Google, etc. to make the case for creating a new category of “media content undertakings” that it recommends bringing under the CRTC’s jurisdiction via a revamped Broadcasting Act (BTLR, 2020, p. 123). That roadmap, in turn, animates the proposed revisions to the Broadcasting Act recently tabled by the Liberal Government that seek to do just this (Canada, 2020).
Equally troubling, the Commission itself seems to be actively putting its thumb on the scales in favour of such policy outcomes given the current chair’s calls for an ISP-levy to fund Canadian content and sanguine views on the exceptionally high levels of policy-driven vertical integration and ownership consolidation that have taken place in Canada. A similar tone was also set in the Commission’s 2018 report, Harnessing Change: the Future of Programming Distribution in Canada.
Putting these differences between our estimates of the online video services marketplace and the views of the Commission aside, based on the evidence that we do have, the television marketplace is thriving, even if some of its elements (e.g. broadcast TV) are in deep trouble. Looking at the big picture that includes broadcast TV, specialty and pay TV services as well as online video services—and an unmistakable picture emerges: total TV revenue has grown nearly five-fold from $1.8 billion in 1984 to $8.8 billion last year.
Figure 21 below takes this big picture approach to illustrate the growth of the total television marketplace over time.
Figure 21: Growth & Upheaval in the Canadian Television Landscape, 1984-2019 (current$, millions)

Source: see the “Media Economy” sheet in the Excel Workbook.
The changes that have taken place in the last decade alongside the rise of the Internet are, indeed, significant. For instance, Netflix’s share of all TV revenue has grown from zero nearly a decade ago to more than 12% last year. It is now the fifth largest television operator in the country, after Bell, Shaw (Corus), Rogers and the CBC and more than twice the size of Quebecor. Add in Amazon Prime Video and Apple iTunes and, based on our estimates, the big three US-based digital AVMS giants had a combined revenue last year of nearly $1.6 billion in Canada, or about 18% of all television revenue across the broadcast, pay and specialty service and online video services. In sum, the online video services have added immensely to the size and diversity of the TV market, and their revenue still continues to climb strongly (more on this in the next report in this series).
The fact that TV services based on subscriber fees (rather than advertising) continue to grow briskly even in the face of economic headwinds over much of the last decade also reveals another crucial point: the TV business has shifted to the direct pay-per model. Subscriber fees, as noted at the outset of this report, are now the centre of the content media universe, and this is especially true for television, where advertising’s share of revenue since the turn-of-the-21st Century has shrunk from accounting for about two-thirds of all revenue to just over a third last year. This is also important because the pay-per model is more resilient to economic shocks compared to advertising revenue, although this shift raises pressing questions in terms of affordability and inequalities of access after nearly a century of policies that have tried to foster universal and affordable broadcasting services.
If we add cable, satellite and IPTV distribution to this portrait the trend is clear: sum up all the elements of “Total TV” and TV distribution sectors[17] and the TV marketplace accounted for nearly $17.1 billion in revenue in 2019 based on our figures, or $20.1 billion if the CRTC’s estimates are used. To put it another way, in 1984, all segments of the TV industry combined accounted for 13% of revenue across the media economy. That figure is now just under 20%–a slight dip over the last decade but a clear indication all-the-same that television is still a main pillar of the Internet- and mobile-centric media universe. Figure 22 illustrates the trends.
Figure 22: Television at the Centre of the Network Media Economy Universe, 1984-2019 (current $, millions)

Sources: see the “Media Economy” sheets in the Excel Workbook.
There is yet another indicator that television in Canada is vibrant and undergoing a phase of extraordinary growth: soaring investment in television and film production. Indeed, total television and film production in Canada jumped from $5.4 billion in 2008 to a record high of $9.3 billion last year. Figure 23 below depicts the trends. While Canadian investment rose modestly in the first half of the last decade, during the past five years it has been Netflix, Amazon and Hulu that have been driving the trend as the they ramp up their investment in original productions. Production and post-production facilities as well as film and television production crews in British Columbia, Ontario and Quebec have been the main beneficiaries (Nordicity, 2019, p. 60).
Figure 23: Film and TV Production Investment in Canada, 2000-2019 (current$, millions)

Sources: Nordicity (2020). Economic Profile, Exhibit 1-2 Total volume of film and TV production in Canada (Study prepared for CMPA, Heritage Canada, Telefilm Canada & Association Québécoise de la production médiatique); CMPA/Heritage Canada (2018). Economic Profile, Exhibit 1-2 Total volume of film and TV production in Canada; CMPA (2010). Economic Profile, Exhibit 1-1 Total volume of film and TV production in Canada. See the “Film & TV Production” sheet in the Excel Workbook.
Such trends are not unique to Canada, either. They are also visible in the United States and the EU, for example, where a revival of investment in film and television production by the traditional studios has taken place after it fell off in the immediate wake of the financial crisis a little over a decade ago. Similar to Canada, this increase is being driven by massive investments from streaming services such as Netflix and Amazon Prime (Spangler, 2020; IBIS, 2019a; IBIS, 2019b; Eurostat, 2020).
Policy in Canada has long sought to attract as much of foreign investment as possible into the production of film and TV for both international and domestic distribution, and on this measure, the policy has enjoyed much success. While some commentators complain that this new investment is for production in Canada by foreign companies destined for foreign markets, this is a short-sighted view because investments in foreign location productions—as this type of production is called—lead to lasting local capacity creation, in terms of creative talent, skilled production and production facilities, as Serra Tinic’s On Location: Canada’s Television Industry in a Global Market landmark study of these issues observed in the early 2000s. Once projects financed by Hollywood film studios or, in today’s context, Netflix and Amazon are done and gone, they still leave an enduring legacy that benefits that production of television, film and other kinds of media content in Canada.
The overall upshot of such observations is that television and film production in Canada is thriving and at record high levels. Thus, before we heed calls for an ISP levy, carving out even bigger exceptions to the Income Tax Act to tilt the playing field in favour of advertising spending in Canadian media versus US-based Internet giants like Google and Facebook, or similar such steps to “harness” future media and cultural policy to a very particular (peculiar) and constrained Canadian conception of television, it is useful to pause and reflect on the above observations to ask just what the problem is that these measures aim to solve?
Of course, all of the evidence does not point in one direction, either. For example, the time the people spend watching television “the old-fashioned way” has fallen by nearly three hours per week over the last half decade. That decline, however, has been more than offset by a rise in TV viewing over the Internet and mobile wireless connections (CRTC, CMR 2019, p. 144).
A recent Canadian Media Usage Study paints a similar picture, with time spent watching television weekly in Canada growing in the fifteen years once streaming services are included. As it observes, “all [o]ffline media have experienced declines in their ability to generate weekly reach over the last 14 years. The TV medium is the exception” (p. 4). Another recent version of that report also observes that TV viewing has grown by nearly 200 minutes per week during the last decade-and-a-half, with almost all of that gain being attributable to the growth of streaming television services.
Data from Cisco and Sandvine also suggest that television and online video are driving the evolution of the Internet, with more than half of all down-stream Internet traffic now accounted for by Netflix and Youtube. For the past few years, Netflix alone has accounted for at least a third of all Internet traffic in North America (p. 4). Additionally, watching television over the Internet and via mobile devices has resulted in television viewing time remaining relatively constant over time. Internet traffic also ebbs and wanes over the course of a day in ways that match traditional television viewing patterns. Elsewhere, I have called this the rise of the prime time Internet.
Of course, this does not mean that life is easy in the television business. Indeed, all its constituent elements must come to terms with an environment that is becoming structurally more differentiated because of new media, notably IPTV and services such as Netflix that are made available over the Internet, and because of major changes in how people use the multiplying media at their disposal.
Incumbent television providers have leaned heavily on the CRTC and Parliament to change the rules to bring online video services into the broadcasting regulatory fold. The BTLR’s (2020) Canada’s Communications Future report released earlier this year proposes to do just this by creating a new category of “media content undertakings” to be brought under jurisdiction of CRTC-cum-super-regulator, the Canadian Communications Commission and revamped Broadcasting Act (BTLR, 2020, p. 123). New legislation (Bill C10) introduced while this report was being written seeks to accomplish some of those goals, even if not exactly as the BTLR report proposed.
Others still, including the CBC, have pushed hard for a levy on Internet access and mobile wireless services in support of Canadian content, and to selectively lift data caps for Canadian content while applying them to “foreign” TV services and everything else that people do with the Internet and mobile phones. While strange bedfellows in the best of cases, the incumbent, vertically-integrated telecoms and TV service providers and reinvigorated cultural nationalists are rallying around the idea that keeping the BDU-centric TV model for as long as possible is a wise thing to do. Such sentiments informs the proposed amendments to the Broadcasting Act that are now under consideration (see Canada, 2020; BTLR, 2020; Bell, 2014, notably pp. 22-24; the Miller Report (2015) commissioned by the ACTRA, CMPA, Writers Guild of Canada, the Directors Guild of Canada, the Friends of Canadian Broadcasting and Unifor).
In sum, instead of cannibalizing the revenue of the television industry, developments in online video services and new modes of consumption using the Internet, IPTV and mobile wireless services have added greatly to the size and diversity of the AVMS marketplace. In fact, such activities are driving the uptake and use of mobile wireless services and underpin the Rogers, Telus, Shaw, Bell and Videotron’s business case for investments in next generation fibre-to-the-doorstep infrastructure. So, to paraphrase Mark Twain, rumours of television’s demise are greatly exaggerated.
Anchor Findings
• Broadcast television has been in decline since 2011.
• After several decades of strong growth, specialty and pay television services have also seen revenue slip since 2016.
• Rather than cannibalizing existing revenues, online video services have substantially grown the market for audiovisual media content in Canada.
• Canada’s film and television production industry has seen record high investment in new productions in the past several years, with investment levels in 2019 nearly double what they were a decade ago.
• The integration of broadcasting and pay television industries with one another—and into the operations of the country’s largest telecoms operators—is unique to Canada and may have dampened competitive pressure and reduced their ability to respond to market developments and broader shifts in AVMS, as seen in other international markets.
Beginning last year, we made some fairly dramatic changes that were designed to capture a broader range of audiovisual media services that are delivered over the Internet and which include more than just online video subscription and download services and Internet advertising. We continue that effort this year. The additional segments that we cover include:
- Digital games: Online gaming, gaming applications, game downloads or in-game purchases;
- App stores, in particular Google Play and Apple’s App Store;
- Music downloads and streaming music subscriptions.[18]
It is crucial to expand our coverage and analysis in this way because total revenue for online video, music, gaming and app stores—i.e. digital audiovisual media services (AVMS)—has soared from $1.7 billion in 2014 to $5.6 billion last year. Of this amount, digital games together accounted for an impressive $1329.1 million in 2018 (the latest year for which data is available), up from $738.2 million in 2014. Beyond significant growth through Apple and Google’s app stores, downloads, subscription revenues from companies like Valve and Activision/Blizzard, Microsoft’s Xbox platform, Sony’s Playstation, and Nintendo are driving the increases we observe. As of 2019, we estimate that app store revenues were $979.1 million. So, too, with online subscription and download music services, whose revenues have grown by more than five-fold from an estimated $190.9 million in 2011 to $1042.7 million last year (a point we will flesh out further in the next section of this report).
Add in Internet advertising of $8.8 billion last year (see further below), and these sectors constituted a $14.4 billion pillar of the network media economy, or 16% of all revenue. In sum, the fast-growing digital AVMS sectors have become a central pillar of the $91.3 billion network media economy in Canada in a remarkably short period of time.
Figure 24: Internet Advertising, Streaming Services and the App Economy, 2011-2019 (current $, millions)

Sources and Note: see “App Economy” sheet in the Excel Workbook. ** Top line figures for each category–e.g. Online Video Subscription & Downloads; Online Music Downloads or Streaming Music Subscriptions; and Digital games–exclude Google Play and Apple App Store revenues to avoid double counting.
The impact of the brisk pace of growth depicted in Figure 17 is also revealed by the fact that revenue for the digital AVMS sectors surpassed those of the traditional content media for the first time last year. Figure 25 below illustrates the point.
Figure 25: Digital AVMS vs Legacy Content Media Revenues, 2011-2019 (Current $, Millions)
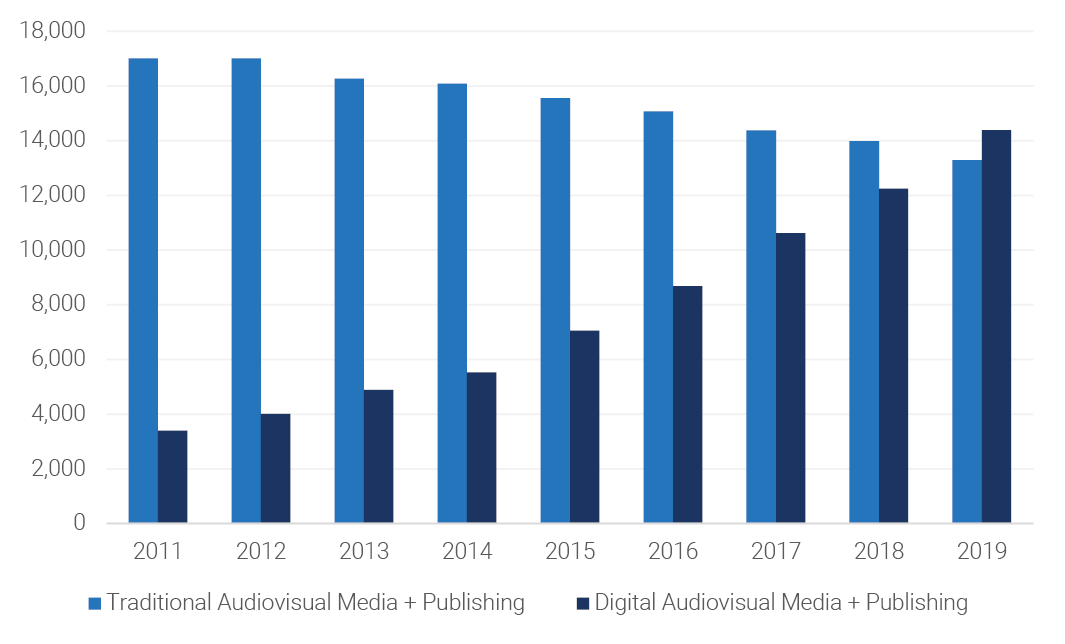
Source: see “App Economy” sheet in the Excel Workbook.
The digital media industries have added substantially to the size, complexity and diversity of the network media environment. In so doing, they have also brought significant global actors such as Google, Amazon, Facebook, Apple, Netflix and Microsoft deeper into the media landscape in Canada (and other countries around the world) than ever before. Indeed, Google’s dominant role in online advertising, where it has revenue of $4,412.3 million last year, is increasingly being complemented by its fast-growing presence in app store sales. We estimate the Google Play Store’s revenues to be $189.6 million from digital games, $147.4 million from its online video services (i.e. Google Play, YouTube Premium and YouTube Subscription), and another $84.3 million from music apps and downloads. All told, Google had a total revenue of $4.8 billion in Canada last year, or just over 5% of all revenue across the network media economy, making it the fifth largest actor in Canada.
While there is no doubt that the Internet giants have carved out a massively larger place within the network media economy in Canada a fairly short period of time, it is also crucial to keep perspective on things. On the one hand, we observe that the revenues of Google, Amazon, Facebook, Apple and Netflix have tripled in Canada in the last five years and, consequently, they have become major actors within the network media economy. At the same time, however, despite this extraordinary growth, in 2019, the “big five” global Internet giants’ combined share of the Canadian network media economy added up to just 10% of the total, while the “big five” Canadian firms—BCE, Rogers, Telus, Shaw and Quebecor—accounted for nearly three-quarters of the total.
It must also be borne in mind that while the digital platforms are becoming increasingly involved in the aggregation and distribution of media and cultural content, they also offer independent audiovisual media service operators a tempting alternative to the BDU-driven approach to broadcasting policy in Canada that, as noted earlier, can foreclose access to potentially lucrative new revenue streams and distribution opportunities. Indeed, whereas fees for independent television services such as APTN, OUTtv, Blue Ant, etc. that are carried by the BDUs are measured in dimes, revenue from online video subscription-based and download services like Amazon and Apple are measured in dollars (that said, this simplifies things because the BDU carriage deals offer access to audiences of a set size for a longer period of time whereas the digital platforms do not). The digital platforms also offer far more insight into the services that they distribute, who their audiences are, easier and faster billing and revenue splitting arrangements, greater marketing opportunities, and so on. Lastly, the platforms also offer access to global audiences rather than just domestic ones.
Indeed, for ambitious independent pay TV services in Canada, global growth rather than a continued fixation on domestic markets, is now the objective. Bell, Rogers, Shaw and Quebecor, in contrast, still seem to be intent on staking out their business model on the acquisition of foreign (mainly US) programming rights for distribution in Canada, rather than investing significantly in their own original programming that could then be distributed not just at home but around the world. That model’s days, however, are surely numbered as the big US and international actors go direct to audiences with their own services.
The music industry is, perhaps, the best example of the wrenching and protracted changes that traditional media industries have undergone before returning to significant new patterns of growth and development over the last five years or so. Indeed, while many have held up the music industry for the last two decades as a poster child for the woes besetting “traditional media” at the hands of digital media, rampant piracy and so forth, the music industry in Canada actually stands as a sobering counterpoint to such claims. Indeed, the music industry is not in crisis. The picture to be sure, is mixed but has steadily improved for the last five years to the point that it is probably now safe to say that it is in good shape.
The analysis that follows is also instructive in relation to the kinds of claims that, for example, Jonathan Taplin makes in Move Fast and Break Things, and those that we find in Public Policy Forum’s The Shattered Mirror report, Richard Stursberg’s The Tangled Garden or any number of other think tank and advocacy group reports that seem to gather an excessive share of people and policy makers’ attention. Each is a case study in how the selective use of data for one specific aspect of a media sector is misleadingly held out to stand for the whole when it does not. Taplin’s repeated references to the steep drop in revenue for “recorded music” is of this type. Why that is so misleading will become evident in the discussion of the music industries in Canada that follows immediately below.
Indeed, like Taplin, many observers have argued for close to two decades that the music industry has been in crisis. This began with the notoriety of file-sharing and peer-to-peer (P2P) networks from Napster in the late-1990s, to Grokster, Pirate Bay and the closing of Limewire in the first decade of the 21st Century, each phase of which reinforced the view of an industry under siege, and that this would only get worse as broadband Internet became more widely used and search engine giants like Google allegedly built their businesses on top of linking to other people’s content without permission or fair payments. For two decades, the Recording Industry Association of America and the International Federation of Phonographic Industries (IFPI)—two international trade associations that represent the music industries—consistently argued that the industry’s revenues were in decline and that the music business is the ‘canary in the coalshaft’ for things to come for the rest of the media.
And like Taplin, the evidence with respect to the deep and long-term plunge in “recorded music” revenue is clear cut and convincing, as Figure 26 below depicts.
Figure 26: The Collapse of the Recorded Music Industry in Canada, 1998-2019 (current $, millions)
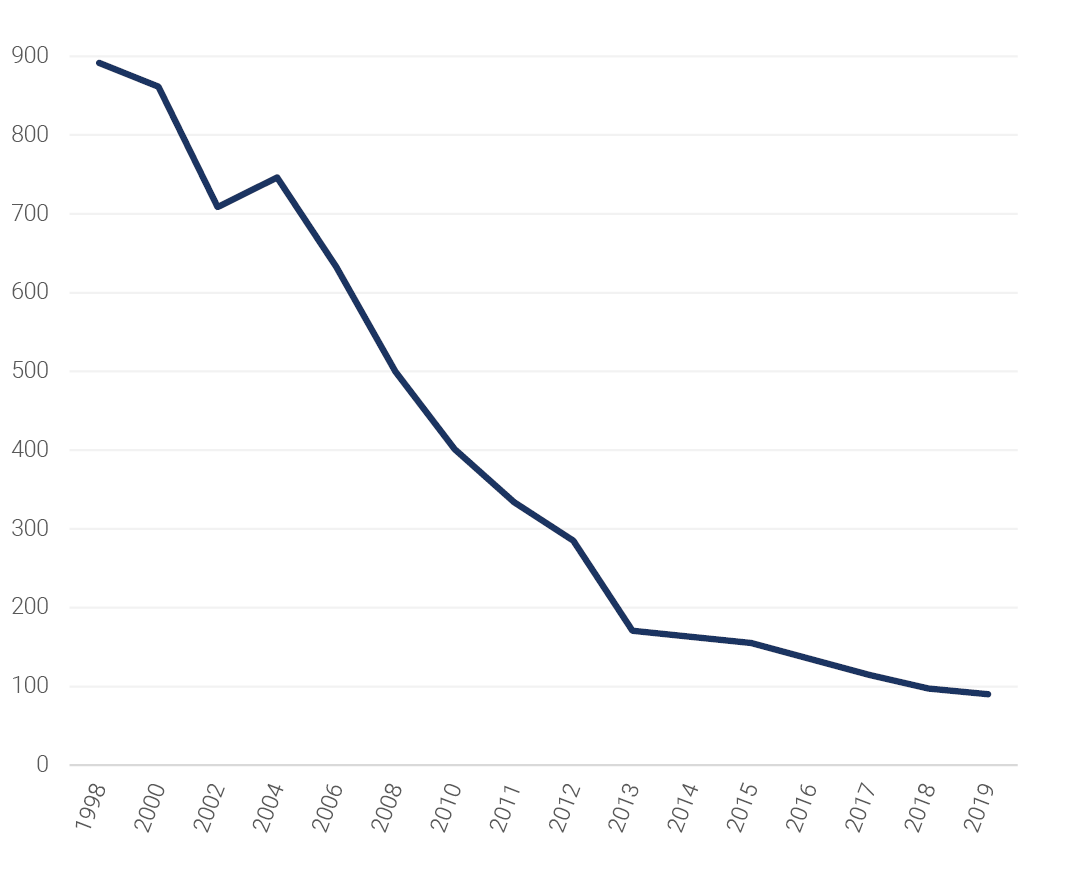
Source: Statistics Canada, Sound Recording and Music Publishing, Summary Statistics CANSIM TABLE 361-0005.
This image of a beleaguered industry, however, is misleading. This is because it refers only to the “recorded music” segment of the industry and lets that stand for the whole. Figure 27 below, however, tells a different story once the three other main segments of the music industry are brought into the picture: (1) concerts and live performances, (2) music downloaded or streamed on the Internet and mobile devices, and (3) publishing (lending rights + more digital and network distribution platforms).
Figure 27: Total Music Industry Revenues in Canada, 1998—2019 (current $, millions)

Sources: Recorded Music from Statistics Canada, Sound Recording and Music Publishing, Summary Statistics CANSIM TABLE 361-0005; Sound Recording: data tables, October 2005, catalogue no. 87F0008XIE; Sound Recording and Music Publishing, Cat. 87F0008X; Publishing from Socan, Financial Report (various years); Concerts and Internet from PriceWaterhouseCooper, Global Media and Entertainment Outlook (various years); USD converted to CDN$ using Bank of Canada Year Average of Exchange Rates. See the “Music” sheet in the Excel Workbook.
To be sure, from some angles, this is not entirely a “good news” story. “Recorded music” has gone into seemingly terminal decline. In addition, the sum of all revenues from the main elements of the music industry – i.e. recorded music, digital sales, concerts and publishing royalties – indicates that the music industry revenues declined from $1,889.7 million in 1998 to $1,578.9 in 2011, so there was a decade-long plus period when the the music industry as a whole suffered set-backs. However, since 2014 or so, revenues have rebounded and by last year they were higher than they had ever been at $2,514.6 million.
Recognizing that the music industry had clearly turned a corner, Socan, the trade association that represents music composers, writers and publishers in Canada, has boasted of “a banner year” and “record revenue” for the last half decade (Socan, 2015, pp. 1 & 8). In 2016, it claimed that it “record revenue” of $330 million, with the amount of money distributed to musicians and publishers up nearly five percent, international royalties up by nearly a third over the previous three years and Internet-related revenue more than doubling in that year (Socan, 2016 Annual Report, p. 5). 2017 was the year of “financial greatest hits”, the organization once again gloated (Socan, 2018, p. 2). The beat goes on, with “another impressive year in 2018 as the organization continues to break records for licensing revenue and distributions to our members” (Socan, 2019, p. 2). Revenue hit $405.6 million last year, and this is after deducting a one-off impairment charge of $42 million from the total. Once again, this brisk pace of growth has been propelled by a 38% increase in royalties from online services alone (Socan, 2020).
The turn-around in the state of the music industries has also been chronicled at the international level. Thus, as the IFPI stated in its 2013 Digital Music Report, “the music industry achieved its best year-on-year performance since 1998” (p. 5). In 2014, the same publication observed, “Recorded music revenues in most major markets have returned to growth” (p. 5). The IFPI struck a more measured note last year but was still upbeat, the upshot of which is that the lingering sense of an industry is in crisis is slipping into the past:
. . . After two decades of almost uninterrupted decline, 2015 witnessed key milestones for recorded music: measurable revenue growth globally; consumption of music exploding everywhere; and digital revenues overtaking income from physical formats for the first time. These are positive metrics of accomplishment. They reflect an industry that has adapted to the digital age and emerged stronger and smarter (IFPI, 2016, p. 5).
A common thread in each of these sources is that, because the music industries embraced digital/Internet sources of revenue earlier than other media, their fortunes have turned around more quickly. Already by 2012, the industry was obtaining about 15% of its revenues from online, mobile and digital sources compared to the single digit figures for newspapers and television that still prevail today. In other words, after having suffered the blows from the onslaught of the Internet and piracy early in the game, the music industry was out in front of others in embracing the realities of an ever-increasing Internet- and mobile-centric media world. These lessons may hold for other media as well.
The upshot is that after having gone through wrenching changes, the music industry has been recomposed along new lines. First and foremost, such lessons should be instructive for those currently wringing their hands over the ‘death of television’.
To illustrate the points further, Figure 28 below depicts the proportionate size of the music industries over the last two decades and its fundamental transformation away from one centred on recorded music to one where concerts, online music services, as well as publishing royalties play pivotal and growing roles.
Figure 28: The Structural Transformation of the Music Industries in Canada, 2000, 2008 and 2019 (current $, millions)
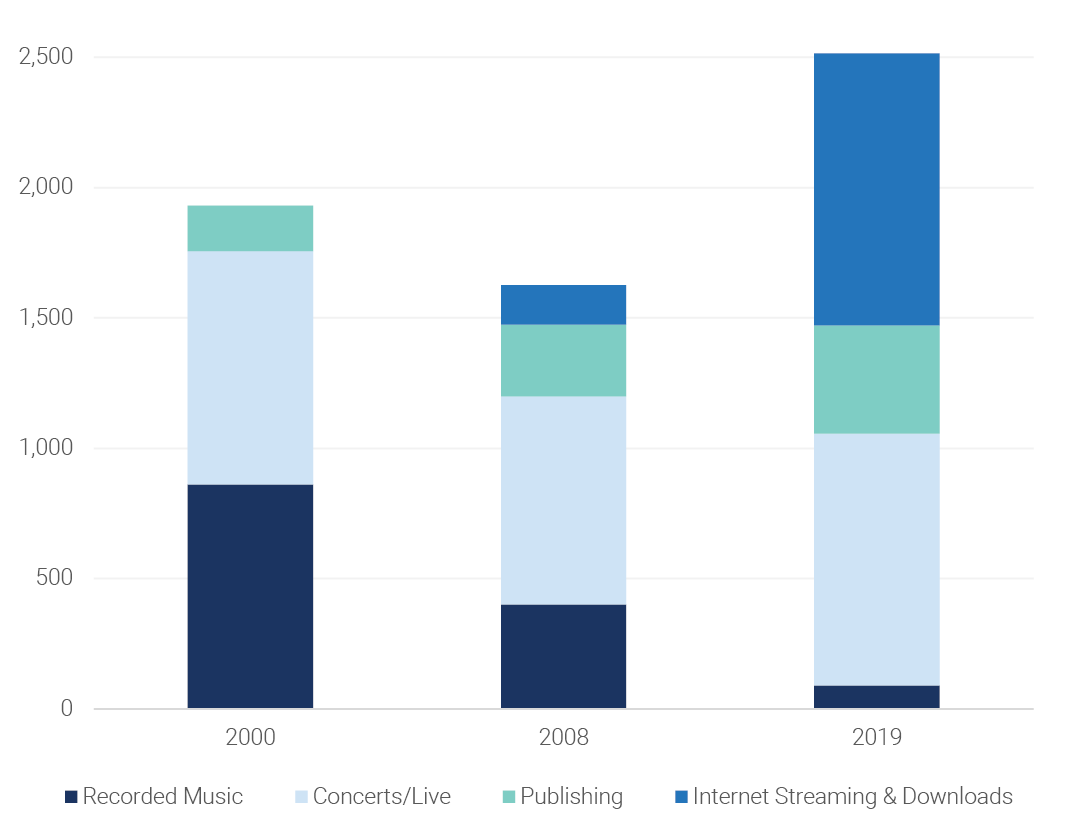
Sources: Recorded Music from Statistics Canada, Sound Recording and Music Publishing, Summary Statistics CANSIM TABLE 361-0005; Sound Recording: data tables, October 2005, catalogue no. 87F0008XIE; Sound Recording and Music Publishing, Cat. 87F0008X; Publishing from Socan, Financial Report (various years); Concerts and Internet from PriceWaterhouseCooper, Global Media and Entertainment Outlook (various years); USD converted to CDN$ using Bank of Canada Year Average of Exchange Rates. See the “Music” sheet in the Excel Workbook.
Perhaps the most dramatic tale of doom and gloom in the media economy comes from the experience of newspapers and magazines. While the crisis of journalism that could be clearly seen in the US and European countries by the late 2000s took longer to become as full blown in Canada, that lag has now vanished. While circulation has been in decline for decades, newspaper revenue had continued to grow until peaking between 2006 and 2008 at around $4.8 billion. Since then, however, it has plunged; by last year, newspaper revenue was less than half of what it had been a little over a decade earlier, as Figure 29 below depicts.
Figure 29: Newspaper Revenue, 2004-2019 (current $, millions)

Sources: See the “Newspaper” sheet in the Excel Workbook for industry revenues back to 1984. Newspaper Canada from 2000 onwards; Statistics Canada before.
Magazines stand in a similar position to newspapers. Similar to the press, magazine revenue also peaked in 2008 at $2.4 billion. Fast forward to 2019, and revenue has plunged to less than half of that level, i.e. $1.1 million. In short, the two media that basically pioneered commercial advertising, and which have depended extensively on it ever since—many critics would argue, excessively so— are now in a state of economic free-fall, with no end in sight (see the “Magazine” sheet in the Excel Workbook).
Newspaper publishers have tried to stanch the hemorrhaging business losses by erecting paywalls in order to obtain a new line of revenue. The extent of this effort can be grasped by noting that, prior to 2011, there were no significant daily newspapers with paywalls in Canada. That changed swiftly, however. By 2013, 27 dailies accounting for roughly 45% of daily circulation were behind paywalls. By 2015, the number had grown to 38 dailies, a number that still stood last year. Indeed, paywalls were erected so fast and extensively between 2011 and 2015 in Canada that they were more prominent in this country than in either the US or the UK (see here).
Figure 30: The Rise of the Great Paywalls at Canadian Newspapers, 2011-2019[19]

Sources and Notes: Newspaper Canada 2015 Daily Circulation Report and observations.
While paywalls have been part of newspaper publishers’ strategy of increasing digital revenues, the revenue gained has not come anywhere close to matching what has been lost. While online revenue has grown from next to nothing fifteen years ago to $220 million last year, this gain pales in comparison to the roughly $2.7 billion in lost revenue that has occurred since 2018. Moreover, online revenue has actually been declining for the last few years.
The fact that tough times continue can also be seen in the fact that since 2008 the number of daily newspapers has dropped from 139 to 75 (News Media Canada, 2020, p. 10). In fact, even this latter figure masks the fact that the industry itself has so fudged the definition of what a “daily newspaper” is over the past several years that it is no longer possible to compare such figures today with what they once referred to not-so-long ago.
The punishing effects of these trends in the publishing sectors are clear, with some of the more illustrative highlights from the past few years listed below:[20]
- In November 2018, Postmedia pared back its publishing schedule by one day per week at eleven local newspapers: the Kingston Whig-Standard, Belleville Intelligencer, The Brockville Recorder and Times, Chatham Daily News, Cornwall Standard Freeholder, Owen Sound Sun Times, Sarnia Observer, Stratford Beacon Herald, Woodstock Sentinel-Review, St. Thomas Times-Journal and Simcoe Reformer. This followed the closure of six other small town papers in June and publishing schedules cut at four others (J-Source; Canadian Press)
- In November 2017, Torstar and Postmedia swap 41 newspapers, mostly community papers, the vast majority of which (i.e. 37) were immediately shut down and 290 employees set to be laid off. The companies’ paper swap effectively divided Ontario into two zones of mutual exclusivity, or local monopolies—all of which begot an inquiry into potential collusion and anti-competitive behaviour by the Competition Bureau (2018) (also see Jackson, 2018).
- Postmedia’s Vancouver Sun and The Province cut twenty-six and thirty-three jobs being cut in 2017 while reduced publishing schedules adopted across Postmedia chain beginning in 2012 have been kept in place (the Calgary Herald, Edmonton Journal and Ottawa Citizen) and previous years (e.g. the National Post);
- Torstar cut 220 positions in 2016 and eighteen positions cut at the Globe and Mail in 2014 (i.e. nine editorial, three photographers, three copy-editors and three others, bringing the number of lay-offs to 100 since 2012). Voluntary retirement programs for journalists and editorial staff have been a steady feature at the paper ever since (here and here);
- Postmedia cuts 90-plus jobs in Vancouver, Calgary, Edmonton and Ottawa in 2016, with expectations that 50 more people would take voluntary lay-offs and a standing offer of buyouts and early retirement packages kept in place.
- La Presse announced the elimination of 102 full-time staff positions and fifty-six in September 2015;
- Smaller papers not exempt from such processes, either with twenty lay-offs at the Halifax Chronicle-Herald in 2014 and staff at the paper on strike for much of 2015 and 2016; lay-offs of nine editorial and photographic staff across the Brunswick News chain in the Maritime provinces; and six French papers in Quebec (Le Soleil, Le Nouvelliste, Le Quotidien, La Tribune, La Voix de l’Est, Le Devoir) were sold by Gesca/LaPresse to Group Capitales Médias in March 2015;
- even after some of the newly emerging journalistic organizations such iPolitics began to bulk up in the mid-2010s, they only had 15 full time journalists, five staff and a number of free-lancers, for example, as of 2015. Even that, however, did not secure a future for iPolitics as an independent news organization since it was acquired by Torstar in 2018.
A regularly updated tally of newspaper and broadcasting stations that have been closed, opened, or decided to either pare back or expand their publishing schedules, as well as journalism jobs gained and lost, can be found at the Local News Research Project created and maintained by researchers at Ryerson University, UBC and Royal Roads University (see Lindgren, Corbett, Hodson & Ritter, 2020).
The impact of the “crisis of journalism” can also be seen in the number of full-time journalist jobs lost over time. Statistics Canada’s data on the number of full-time journalists employed over the past three decades is probably the most complete and comprehensive source on the subject. Whereas lobby groups, think tanks and others have pointed to the loss of 10-15,000 journalism jobs over the course of the decade as they paint a dire portrait of a vocation vital to democracy that is allegedly being wiped out by the likes of Google and Facebook, Statistics Canada data allows for a much more nuanced and complex view than that, albeit by no means one that lets us look through the world with rose-tinted glasses and to be complacent.
The headline based on Statistics Canada’s Labour Force Survey data is that the number of full-time journalists in Canada has fallen from 13,000 to 9,100 since 2013—a drop of 30%. This is a big loss, to be sure, but it is much less than figures that are three- to four times that high that are endlessly circulated by lobby groups and think tanks like the Friends of Canadian Broadcasting, Public Policy Forum, News Media Canada and regularly regurgitated by journalists, all of whom know that the Statistics Canada data exists but refuse to acknowledge its existence. It is also important to note that, prior to 2013, the number of full-time working journalists working in Canada had stumbled upwards over the past three-and-a-half decades, growing by roughly fifty percent to 12,400 full-time journalists at the end of the 1990s, before inching upwards after that until reaching its peak in 2013, after which a wave of cuts over the last six years culled the ranks of professional full-time journalists in Canada by nearly a third.
Figure 31 below illustrates the twists and turns that have defined the uneasy fate of journalists in Canada for the last three-and-a-half decades.
Figure 31: Journalists vs the PR, Advertising and Marketing Professions, 1987-2019

Sources: Statistics Canada (2019) Employment by occupation: 1123 Professional occupations in advertising, marketing and public relations and Statistics Canada (2016). Employment in Journalism occupation, by province. Custom LFS tabulation. File on record with author.
The circumstances look even more grave once we consider that the modest increases that have taken over time did so against a media economy that has quadrupled in size as well as increases in the size of the economy and the general population. Moreover, as Sabrina Wilkinson observes, not only are the number of journalism jobs in decline, amongst those that do remain, fewer are permanent and much less job security is now the new normal (Wilkinson, 2019). Also consider the grim fact that even the modest growth in the number of journalists that did occur over the past three decades has been vastly outpaced by the growth of the PR, advertising and marketing professions. In 1987, there were four people working in the publicity business for every journalist; last year, the imbalance had ballooned to an astonishing 15:1.
Of course, several new commercial and philanthropic supported, Internet-based approaches to journalism and public commentary have also emerged over the past twenty years.[21] That many of these ventures have been launched by professional journalists is to their credit and is the fact that some of them have broken important news stories. Canadaland, in particular, is in this league on this score and has had added a vibrant and credible new source of news, information, media criticism and opinion to the otherwise insular media and journalistic culture in Canada. Others have offered specialized expertise in specific areas, such as iPolitics, Policy Options and the Hill Times’ suite of publications (e.g. The Wire Report). Academics-as-public intellectuals have also been brought back into the conversation in ways that are refreshing and that have added expertise and diversity to journalism and the public sphere. The revival of the partisan press, while unfortunately also fuelling vitriol and extreme political voices, can also offer new voices that enliven democracy by engaging people to be more actively involved in it.
Early on, the intersection between journalism and the Internet led some—including me—to be hopeful that we were seeing the emergence of vibrant “network free press” that would help to shake democracy out of its long-term stupor (Benkler, 2009). Such hopeful optimism has not come to pass. The crisis of journalism is real and the number of professional journalism jobs lost a real problem as well. Hopeful journalism start-ups run by professional journalists have been re-absorbed into the fold, for example, with Torstar’s acquisition of iPolitics two years ago. That acquisition also revealed that it is not only important to have seasoned journalists backing new digital journalism ventures but also wealthy patrons, given the role of the Molson family in bankrolling iPolitics from start-up to acquisition.
Crucially, none of these newer online outlets even ranks amongst the top 60 Internet news sources that people in Canada turn to. However, Canadians do use the Internet and social media quite extensively as “pathways to the news” (Reuters Institute, 2019). Furthermore, the range of Internet news sources that they consult when doing so is quite broad and diverse, consisting as it does of a mixture of new and old, as well as local, national and international news sources (a point we will return to in our next report). Even with the far greater diversity of online news sources available to Canadians, traditional news organizations are still amongst the most important sources of journalism that they consult (see the “Internet News Sources” sheet in the Excel Workbook, based on Comscore (2020) Media Metrix Multi-Platform Canada, News/Information Category, Sept 2019 – Sept 2020).
A key reason for mounting skepticism is that the central problem that has affected journalism throughout the history of democracy in its modern configuration is nowhere near being solved: i.e. the people have never paid the full cost for the news. For the past 150 years, advertising played an ever-increasing role in covering up that reality, but that façade is now collapsing before our eyes (John & Loeb-Silberstein, 2016; Pickard, 2019). As the Reuters Institute’s latest Digital News Report (2020) states, only 13% of Canadians are willing to pay for the new online (p. 90).
Given this unwillingness to pay for the news—historically and today—once the advertising subsidy that has been journalism’s main source of funding for the last century dries up, or is diverted to the Internet and into the pockets of Google and Facebook, who or what will fill the breach?
The major English- and French-language press groups have repeatedly called for subsidies in response to these conditions, and, unsurprisingly, that they in particular should be the beneficiaries.[22] The press group’s trade association, News Media Canada, ramped up its newest “Levelling the Playing Field” as this report was being prepared—with yet another report to flood the marketplace of ideas and public policy debates.
The Liberal Government responded to these calls in its 2019 Budget by announcing a journalism support program organized around the following three measures and worth $595 million over five years:
- A new refundable tax credit for journalism organizations.
- A new non-refundable tax credit for subscriptions to Canadian digital news.
- Access to charitable tax incentives for not-for-profit journalism (also see here).
Of course, the idea of public policy supports and public subsidies for journalism has been resisted in many quarters, not least by many of the new journalistic ventures that have emerged in recent years and which are still trying to become commercially viable (see, for example, Canadaland’s position statement on the issue). The view from those opposed to public policy interventions of any kind along these lines tends to be four-fold:
- First, taking subsidies from government will turn journalist watchdogs into politicians’ lapdogs, and be at odds with the liberal theory of the free press;
- subsidies will be used to preserve “legacy media” like broadcasters and newspapers that are better left to die;
- or worse, funds will be funneled to commercial enterprises and the CBC—both of which are exactly the incumbent players that new upstarts must compete against tooth-and-nail as they seek to carve out a place for themselves in the media world;
- crowd-funding, subscriptions or some other type of direct payments by consumers will do the trick while also avoiding all of the above threats.
Yet, the idea that paywalls, crowdfunding, subscriptions, backing by wealthy philanthropists, or some combination thereof might carry the day brings us right back to square one, however: people have never paid the full-freight for journalism. This is true today, and it is true historically (John, 1998; Pickard, 2019). From a historical point of view, and within the context of liberal capitalist democracies, there has always been some combination of three types of subsidies that have kept the “free press” afloat:
- Advertising, which came unto its own between the 1880s and 1920s in North America and Europe as the main source of income for the press (Baldasty, 1992; Pickard, 2019; Sotiron, 2005).
- Public funds provided by democratic governments, perhaps most innovatively and expansively beginning with the 1792 Postal Act in the US that used the development of a universal postal system to (a) bring “general intelligence to every man’s [sic] doorstep” and, even more audaciously, (b) as the foundation of a nation-wide news exchange system that allowed newspapers and magazine publishers to exchange a copy of their publications with other publishers across the country as often as they liked for free in order to promote the nation-wide, social circulation of the news and to promote the development of the press throughout the US. The use of public funds to create public service broadcasters throughout western democracies from the 1920s and 1930s onwards to the present day is a more familiar version of the use of public subsidies to support the development and economic viability of journalism in the public interest (John, 1998; John, 2011; John & Silberstein-Loeb, 2015).
- Wealthy patrons who have funded journalism to pursue political, ideological and philanthropic goals, notably in Canada by Conrad Black who started the National Post in 1998 and which was kept afloat for more than a decade by new owners, not as a profitable, business venture, or for the love of journalism as a craft, so much as a way to re-invigorate the conservative political movement and culture in Canada.
The question, thus, is not whether journalism will be, at least in part, subsidized but what kind of subsidies will be enrolled in the task of supporting public interest journalism fit for a democracy and promoting the functions that we think are essential to the well-being of ourselves, society and democracy?
Avoiding, or simply opposing, subsidies on the ground that they are antithetical to “market values” ignores the reality that paywalls, and the entire edifice of intellectual property upon which they are based, is a specially devised creature of “the state” designed to deal with the public good characteristics of news, knowledge, ideas and culture to begin with. Indeed, the whole institutional set-up of copyright is based on a basic predicate: these goods are not normal commodities traded in normal markets. That is why distinct “intellectual property laws” have been created for them, unlike most other kinds of “property” where the standard laws that govern property and market relations hold sway.
In a bid to encourage the production and consumption of news, copyright was not extended to news until after the turn-of-the-20th Century. Indeed, news itself wasn’t even copyrightable– i.e. treated as quasi-property—in the eyes of the law – in the UK until this time. Similar events took place in the US in 1918 (Tworek, 2015). As a matter of fact, subsidies and legal protections like copyright have been the twin pillars of journalism in liberal capitalist democracies for the last century, and both measures have been crucial to furthering the free press and free speech values that it embodies and that democracy needs to flourish (see John on how the US post service subsidized the development of the “free press” to the tune of tens of billions of dollars per annum in the late-18th and 19th centuries).
Once again, it’s worth noting that people have never paid the full freight for a wide variety of media and cultural productions. These go beyond audiovisual media to include libraries, education, basic research, archives, the arts, orchestras, statistical agencies, universities, etc., in sum, the media, culture and knowledge infrastructures of modern capitalist societies. As a general rule, the more of these things there are, and the better they are cared for in the public interest, the healthier, happier and more democratic a society is.
Information/culture/media goods are not public goods just because I say they are but because society does through the political process, and because they fit the criteria for public goods set out in mainstream and heterodox economic theory, historical experience, as well as normative ideas that directly link them to human development, citizenship and democracy. The economic ways and means used to produce such things through a combination of market and non-market forces are integral parts of the overall structure of the media economy not just in Canada but around the world—at least developed and democratic ones. The settlement struck during the ‘industrial media era’ that recognized these basic facts is coming undone, but without clear alternatives in sight.
Turning away from such realities for reasons of self-interest is understandable but avoids the nub of the issues before us. How to settle the problems raised by these issues is an open question. However, railing against the idea of press subsidies as if they are an aberration and endemically at odds with the liberal free press tradition is just wrong.
Once this is understood, then we can have a reasoned debate about what the Liberal Government’s journalism support measures do and do not do well. We can also face up to the reality that even if Google and Facebook are properly brought to heel through regulatory measures that curb their dominance of the online ad-tech system as well as the unlimited harvesting and exploitation of personal, social and environmental data that defines their business models—and surveillance capitalism, more broadly, as Shoshana Zuboff (2018) refers to the kind of society their practices anticipate, advertising is not the core of the media economy. We can also face up to the reality that even when advertising was more central to the commercial media model, this was not some kind of golden age but came with its own compromises and constraints that always rubbed uneasily with both people’s needs and the needs of democracy.
Some Concluding Observations on the Political Economy and Power of Communication and Culture Policy
This report has examined the development of the network media ecology over the past three-and-a-half decades. It has done so out of the conviction that too often discussion of “the media” proceeds without a consistent and solid, informative base of evidence, or even a coherent definition of what is to be studied. Consequently, too often the policy discussions and public debates that ensue are driven by actors whose interests and objectives are understandable but not necessarily in line with public interests.
The analysis that this report offers has proceeded step-by-step to examine each of the nineteen sectors of the telecoms, audiovisual media and online services and applications that comprise the network media economy. In so doing, it has revealed which sectors have floundered while also highlighting those that have flourished.
With respect to the former, it has identified four media sectors whose business models depend primarily on advertising that are in crisis, e.g. broadcast television, radio, newspapers and magazines. Collectively, over the last decade, these media sectors have lost $4.9 billion in revenue; eight broadcast television stations have gone dark; numerous daily newspapers have either been closed or pared back their publishing schedules and nearly 4,000 full-time journalist jobs have been cut since 2013. For these media sectors, and the critically important functions that they support—namely professional and local journalism—these are dark days indeed.
The problem, thus, is not that there is no “crisis of the media”. For some media, there is. However, as this report emphasizes, to the extent that there is a crisis, it applies to those media whose business models depend primarily on advertising, where advertising spending has been in decline in “real dollar” terms on a per capita basis and in relation to the size of the media economy and to gross domestic income for most of the past decade. This is one key cornerstone of the problems at hand and will need to be dealt with as such.
While the overall envelope of advertising has remained stubbornly fixed (or even falling on some measures), online advertising soared to $8.8 billion last year and now accounts for over half of all advertising spending (e.g. 56%) in Canada and just under ten percent of the value of the network media economy. Simultaneously, Google and Facebook’s combined share of online advertising is also consolidating rapidly and reached 80.2% last year. This combination of protracted downward pressure on advertising spending within the economy, the shift to online advertising, and ongoing consolidation of digital advertising has sharpened the conflict between Google and Facebook, on the one hand versus other, established media enterprises that still rely on advertising, on the other, and it is the latter that are clearly losing the battle.
Policy proposals by many media companies, trade associations, cultural policy advocacy groups and trade unions to expand changes to the income tax laws adopted in the 1970s that encouraged advertisers to advertise with Canadian broadcasters, newspapers and magazines rather than U.S. media to include online advertising are unlikely to be effective. This is because doing so will do nothing to address the relative decline of advertising. It also does not address the huge economies of scale that are driving the consolidation of online advertising, and which put local, regional and national media at a huge structural disadvantage when it comes to competing with the global Internet giants for advertising dollars (Hindman, 2018). It also leaves totally unscathed the other key drivers behind Google and Facebook’s rapid consolidation of Internet advertising: vertical integration over the former’s own digital ad exchange, control over the currency and audience measurement tools upon which such exchanges work, and the lax data and privacy protection rules upon which their business models are built. These should be the targets of a new generation of Internet regulation, and applied across the board to every player in the communications, Internet and media ecosystem, instead of the current approach that seems primarily to be about shaking down the international Internet giants for contributions to a narrow conception of communication and Canadian content.
Conversely, perhaps the biggest critique of the assertion that the digital giants have precipitated a crisis of the media is that, in fact, most media industries in Canada are vibrant and even thriving. As this report has shown, what we call the “pay-per media” (e.g. mobile phones, Internet access, cable television, pay TV, online-video, music and gaming subscription and download services and app stores such as Google Play and Apple’s App Store) are thriving, even if pay and specialty services have seen their growth begin to unwind in the past three years. In fact, these sectors have grown so extensively over both the long-run and the mid- to short-term, that the “pay-per media” now constitute the core of the network media economy, with total revenues that outstripped those of advertising-based media by a ratio of more than 5:1 last year.
The rapid growth of online advertising and digital audiovisual media services has seen major global actors like Google, Amazon, Facebook, Apple and Microsoft (the so-called GAFAM group of Internet giants) as well as Netflix move more deeply into the media landscape in Canada (and other countries) than ever before. In fact, combined, these entities had total revenue in Canada of $9.2 billion last year. As a result, communication and media companies within Canada are facing intensifying competition with these global Internet giants in AVMS services more than ever.
That said, however, it is essential not to exaggerate the influence of the GAFAM group of digital platforms and Netflix. To help keep things in perspective, it is crucial to keep front-and-centre in mind that their combined market share now adds up to 10% of all revenue for the network media economy. By contrast, the “big four” vertically-integrated communication and media conglomerates in Canada (Bell, Rogers, Shaw, and Quebecor) accounted for a combined 56.4% of all revenue. Bring Canada’s third largest communications company, Telus ( which is not vertically-integrated), Telus, into the fold, and the “big 5” Canadian players dominate nearly three-quarters of all revenue for the network media economy.
In other words, while there is no doubt that the GAFAM group of Internet giants and Netflix have become significant players in the media economy, their clout is more constrained than commonly assumed. The crisis narrative that is so widespread in certain circles obscures this reality, intentionally so it seems, because it helps to further policy measures intent on preserving incumbent interests as well as peculiar and anachronistic view of the “Canadian Communication System”: one that is insular and dominated by the industry’s biggest players, a handful of think tanks and consultants, and policy insiders, and where questions about power and dominance are “off-limits”.
This, however, should not be taken for a moment to mean that nothing should be done about Google and Facebook’s dominance of the online advertising market. In addition, attention and effort need to be directed at addressing, more generally, the broader tendency of the Internet giants to supplant the open, common protocols upon which the Internet has been built and designed for several decades with their own proprietary technical protocols; the lax privacy and data protection rules that have buttressed their market power; the take-it-or-leave stance that these actors impose on their users; their potential influence on elections and reluctance to open their “black box algorithms” to regulators; all of which are indicators of their clout, and the need to limit the potential harms that could flow from their unchecked power.
In this regard, there is much to be done and absolutely no reason to shy away from the task. That, however, will entail abandoning ideological shibboleths in order to get a better handle on what a new generation of Internet, communication and media regulation should look like. The choice is not whether there will be such regulation but whether or not it will serve public interests, promote free expression, and further the values of a democracy.
That being said, the critique of digital dominance must extend in proper proportion to which it exists across the network media economy. In this regard, Bell, Shaw (Corus), Rogers, Telus and Quebecor (Videotron) are still the biggest players in Canada, by far, and this must be acknowledged and dealt with accordingly. The fact that all the major commercial TV operators in Canada are owned by telecoms companies sets us apart from the vast-majority of countries in the world. This is not something to wave away, but rather to be dealt with as one of the most significant root causes of serious constraints on communication and culture in Canada—a point that we will document and address in greater detail in our next report. Indeed, handing over the defining pillars of the AVMS sectors to a handful of mobile phone/Internet access/BDU companies has foreclosed potential new business models and lines of revenue, such as retransmission fees, greater online advertising revenue and new distribution opportunities via the Internet as well as from the global subscriber-based video-on-demand services, as this report has shown.
Such realities prevail over-and-above the fact that the mobile wireless market continues to be underdeveloped by international standards, given the high price of service, extraordinarily low levels of adoption and mobile data usage levels that are half the OECD average, even after accounting for some improvements in recent years. These constraints should be seen not just at the limitations of uncompetitive and unresponsive mobile wireless markets but as constraints on how Canadians communicate with one another, use the media at their disposal and culture broadly construed. Instead, the tendency in mainstream policy circles is to wave away such realities as matters of narrow technical and commercial interest, almost philistine considerations—a stance struck by the Broadcasting and Telecommunications Legislative Review Panel’s preliminary report in its first few pages, for instance, before it turns to what it seems to think is the real crux of its remit: a narrow view of Canadian Culture drawn straight from the 1970s other than references to a supposedly more contemporary set of existential threats to the Internet now grounded in the Internet and a handful of American Internet giants. It also reveals itself in the words of far too many who think that, beyond “content”, everything else is housekeeping, as if questions about how people use the Internet and mobile phones to communicate with one another and to access so much else in the world, including a wide range of domestic and international media services, are for philistines.
The CRTC’s Harnessing the Future report from 2018 strikes such notes. Rather than trying to harness communication, culture and media to the realities of the Internet and “the digital age”, the broadcasting system is retained as the centre of the universe around which all else must be rotate, as if the myriad economic, social and personally expressive uses of the Internet and mobile phones are somehow both the proximate beneficiaries of the “broadcasting system” and subordinate to it.
A raft of familiar voices from industry, “cultural policy” advocacy groups and think tanks incessantly sing a similar tune. While strange bedfellows in many other ways, these groups form a choir as they harken back to policy tools created in the 1970s to serve as the touchstones for what needs to be done today: e.g. exceptions to the Income Tax Act that privileged advertising spending in Canadian media over foreign media outlets, a levy on broadcast distribution undertakings to foster Canadian content, and a view of the “Canadian Broadcasting System” as if it is and should be an integrated whole. In this view, that the telcos own all the biggest commercial TV services in the country passes by without comment. That the high price of connectivity, data and restrictive data caps are not seen as artificial constraints on people’s ability to communicate and do as they please with the connectivity (the bandwidth) at their disposal, but rather something that such realities should be harnessed to support the broadcasting system is taken as a given.
In fact, the BDU-centric model of TV seems to suit these groups just fine. To the extent that the Internet and mobile phones are given any thought at all, they are seen primarily as new delivery systems for broadcasting, a new revenue stream, and a means by which income can be diverted to support Canadian content. What could be easier, the “creator communities” say, than to apply a “small levy” on smart phones and Internet services to replenish the media production support funds that currently exist and apply them across an even wider variety of media, from TV, to music, to videogames, film, and so on today? And why not “zero-rate” Canadian Content while applying data caps to foreign content and everything else people do with their mobile phones and Internet connections, if that tilts the field in Canadian content producers’ favour?
While these options were spurned by the last Liberal Government (and the previous Conservative ones before it), the current Liberal government seems more inclined to accept such views, even if not whole cloth. The BTLR report’s warm reception by the Heritage Minister and the proposed changes to the Broadcasting Act that were announced as this report was being finalized and which will bring online video services under the act and the jurisdiction of the CRTC are indicators of this new dispensation. It is not the online video services should not be regulated at all but rather the framing of them as if they are simply an appendage of the broadcasting system that is problematic.
Further analysis and discussion of proposals now on the table will have to wait until next year’s report when they may be resolve (or not, given how long such things take). The point for here, however, is to draw attention to the way potential options for a new generation of Internet regulation and cultural policy are being framed by the kinds of faulty analysis, data and analogies highlighted in this report.
That the current battle is as intense as it is, highlights the scale of the interests at stake. Sorting through these competing interests without losing sight of the multitude of public voices who have something to say, rather than just those who have long colonized communication and culture policy in this country and wrapped their own private interests in the flag, is vital. It is also critically important to have a long-term, systematic body of evidence, set against a background of history, a realistic appraisal of politics and power, experience as well as scholarly independence that can be brought to bear on these issues. That is what this report, and the CMCR Project, aims to achieve. We hope that you find it helpful.
Appendix 1: The Rise of the Great Paywalls of Canadian Newspapers, 2011-2018

[1] This lack of conceptual definition has not stopped some researchers, however, from making brash claims about the allegedly dire state of the media, the impact of the global Internet giants on domestic media, the catastrophic scale of media concentration trends, and so forth Bagdikian, 2004; Taplin, 2017; Public Policy Forum, 2017; Stursberg, 2019; News Media Canada, 2020) while others, in contrast, use this same conceptual fuzziness to reach exactly the opposite conclusions: everything is fine, markets are working well and regulation is unnecessary (Eisenach & Soria, 2016; Thierer & Skorup, 2014). The results from both directions are often cherry-pick evidence and extremely politicized debates that allow rival interests to, essentially, paint whatever picture they want in pursuit of their own self-interested policy agendas.
[2] See: The revelations in early 2018 that Cambridge Analytical harvested personal information from 87 million Facebook users’ profiles—including 620,000 in Canada—and that such information was then used as part of questionable electoral campaign strategies and disinformation campaigns—i.e. the 2016 US presidential election, the Brexit referendum in the United Kingdom, elections in the Netherlands, Germany, Brazil and other countries around the world
[3] See: the Standing Committee on Access to Information, Privacy and Ethics’ report as well as the United Kingdom’s Information Commissioners Office’s report).
[4] For example, France’s President Emmanuel Macron speech to the Internet Governance Forum in November 2018 marked something of a watershed moment when he told those in attendance that the choice now was not whether to regulate the digital platforms but how to steer between the opposing poles of California, Silicon Valley ideology, on the one side, and Chinese-style authoritarian rule of the Internet, on the other.
[5] See: Jonathan Taplin’s polemic against the ‘vampire squids of Silicon Valley’, Move Fast and Break Things. Such sentiments have been embraced in Canada as well, where industry actors, think tanks, trade associations and labour unions that represent the “creative industries” endless recycle versions of his take as they vilify Google, Netflix and Facebook for allegedly laying waste to Canadian media. Such accounts are based on weak and selective evidence and do not seriously consider the long-term, multiple root causes of the real problems that do exist, and the even more pressing reality that, for the vast majority of media, there is no crisis (the Public Policy Forum’s Shattered Mirror and Democracy Divided reports, Richard Stursberg’s (2019) book, The Tangled Garden, and News Media Canada’s (2020) Levelling the Playing Field report are all examples of this tendency; also see Winseck, 2017 for a critique of the Shattered Mirror).
[6] Pay-per media refer to those media that people pay for through subscriptions or purchase directly. They include telecoms and Internet access as well as pay and specialty TV; Internet video and music services; music; digital games, app stores such as Google Play or Apple iTunes and Apple App Store, newspaper subscriptions, etc . They are different from media that are subsidized by advertising or government-funding (as in the case of the CBC) or wealthy patrons (as in the “high arts”). I take the “pay-per” term from Vincent Mosco’s Pay-Per Society (1989). The film and book industries are not included in this report because of data availability limitations but see PriceWaterhouseCooper’s Global Entertainment and Media Outlook for evidence that bolsters the point being made here.
[7] See the “Media Economy” sheet in the Excel Workbook.
[8] The trend indicated in Figure 11, in turn, partly justified the CRTC’s efforts to promote the unbundling of cable TV packages and pick-and-pay options in its trilogy of “Talk TV” decisions in 2015 and 2016–against the protests of industry and culture policy groups. The latter, in particular, want to retain and even extend the methods used in the past to the Internet—bundling content with access to the network, and the levy on distribution to subsidize content, while the former mainly want the Commission to stand aside and let the industry do as it pleases, or for the CRTC to be dismantled altogether and what’s left of its mandate handed to the Competition Bureau (see, for example, the reports by the C.D. Howe Institute, the Fraser Institute, the Montreal Economic Institute and the MacDonald Laurier Institute on this point).
[9] In contemporary parlance, the concept of “net neutrality” often serves as shorthand for core principles of common carriage.
[10] Concentration Ratios examine the market share held by the top X firms in a market. It is conventional to use the CR4 standard where the top four firms account for more than half the market share to consider this as prima facia evidence of a concentrated market.
[11] The entire online advertising ecosystem, not incidentally, was found by the Information Commissioner’s Office in the United Kingdom’ (2019) Update report into adtech and real time bidding to be rife with dirty data, fraud and deception, all of which it ordered to be remedied and made compliant with the EU’s General Data Protection Regulations as it contemplated precisely what—not if—regulatory steps it would take in response to this situation.
[12] A media industry term/measure for the value of the “audience commodity”.
[13] The range depends on which measure is used to assess the situation, e.g. real$ vs current$ and per capita spending or advertising spending as a percentage of GDI or the network media economy.
[14] In 2015 alone at least 1,200 full-time television and radio jobs were cut: 460 at Bell, 439 at Rogers, 244 at the CBC, and 129 at CHCH (see here, here, here and here). The following year, Rogers cut another 200 jobs at its television, radio and publishing divisions, while Corus (Shaw) cut another ten positions at Global News when it cancelled its investigative news program, 16X19. Bell made further cuts last year when it laid off twenty sports news journalists (Watson, 2017), while Shaw cut eighty positions but softened the blow by adding fifty, mostly local journalism jobs in Ontario (Brin, 2018). In 2018, Corus cut another 80 news production positions in February while its Global News division hired fifty new positions, mostly journalists (Sagan, 2018). French language broadcaster, TFO, also cut ten positions, five of which were part time (Canadian Media Guild). Cuts continued into 2019 at the CBC (35 news room positions cuts) (Craig, 2019), another eight at the video desk of the CP news wire service and several at Corus Entertainment (Thiessen, 2019).
[15] That is, not being vertically-integrated into cable and telecoms carriers, or diagonally integrated with pay TV services.
[16] The method we use to arrive at revenue and subscriber figures for each company examined in this section can be found in the notes attached to the individual cells of each company in the “Top 20 w Telecoms” sheet in the Excel Workbook. The focus is on subscriber video-on-demand (SVOD) services such as Netflix and Crave and transactional video-on-demand (TVOD), while advertising-based VOD services such as Youtube’s ‘open platform’ are excluded to avoid double counting online advertising revenue and to keep the focus on professional audiovisual media services rather than user created content.
[17] This includes broadcast TV, pay and specialty TV, online video services and BDUs.
[18] To arrive at our estimates, we draw on our own calculations for the online video subscription and download service, as discussed above, as well as custom tabulations from Statistics Canada’s Canadian Internet Use Survey and Digital Economy Survey for the online music, video games, apps and in-store purchases, Apple and Google’s annual reports as well as the Interactive Advertising Bureau’s annual reports on online advertising.
[19] The Toronto Star ended it paywall in 2015 with launch of Star Touch but resurrected it in September 2018. For a breakdown by when individual newspapers adopted paywalls over the period from 2011 until the present, see Table 1 in Appendix 1.
[20] Thanks to Sabrina Wilkinson, a former MA student at the School of Journalism and Communication at Carleton University and now a Ph.D. Candidate at Goldsmiths Univerity (London, UK) Her research has led me to many of these examples and sources, and their significance.
[21] See: the National Observer, The Tyee, Huffington Post, Buzzfeed, Vice, AllNovaScotia, Policy Options, Canadaland, Blacklock’s Reporter, iPolitics
[22] See, for example, Postmedia CEO Paul Godfrey’s call to the Canadian Heritage Parliamentary Committee along these lines, as well as similar calls from Quebec-based newspaper groups (see here).