Media and Internet Concentration in Canada, 1984-2016
Today, the Canadian Media Concentration Research Project is releasing the second of its two-part annual series on the state of telecoms-internet and media concentration in Canada. A downloadable PDF of the report can be found here.
The report examines the state of competition in the mobile wireless market, internet access, broadcast, pay and streaming TV services, internet advertising, newspapers, browsers, online news sources, search, social media, operating systems, etc. in Canada over the period from 1984 until 2016. We call the sum-total of these media “the network media economy”. We then use two common metrics—Concentration Ratios and the Herfindahl-Hirschman Index (HHI)—to determine whether these markets—individually and collectively—are competitive or concentrated.
This year’s report adopts a new tack as well by taking a closer look at the state of competition in local and regional mobile wireless, retail internet access and “cable TV” services. We examine the state of mobile wireless competition in Quebec, Saskatchewan and Manitoba, for instance, where, at least in 2016, the big three national carriers—Rogers, Bell and Telus—faced strong regional rivals like Videotron, SaskTel and MTS (before the latter was taken over by Bell this year). We show that competition has improved considerably in Quebec, for example, where Videotron has carved out a 13% market share for itself in the mobile wireless market (and about 15% based on subscribers).
Concentration levels are much higher in local retail internet access and cable TV markets, however, where the top two firms generally account for 88% and nearly 100% of the market, respectively. In short, there are strong reasons for concern in all these markets. Now is no time to let up on policy measures that have begun to bear at least some fruit, and perhaps good reason to double-down on them.
We also identify features of the network media economy that set Canada apart from other countries. In Canada, telecoms companies, for instance, own all the main TV services except for the CBC and Netflix. This is a distinguishing feature of the network media economy and needs to be recognized and dealt with as such. Vertical integration in this country is very high by historical standards and almost four times current levels in the United States.
Even if AT&T’s current bid to acquire the film and TV giant Time Warner gets past the strong headwinds it is encountering, vertical integration in the US would be just over half the Canadian levels. The policy principle of “common carriage” (popularly known as “net neutrality”) is built for conditions like these—albeit not contingent upon them.
The trends we observe differ across time, place and media. After intensifying in most areas of the network media economy from 2010 to 2014, and especially in TV, concentration trends have generally drifted downwards in the past two years.
Concentration levels have fallen, for example, in cable TV (when measured locally, but not nationally), internet access (at both the local and national level), wireline telecommunications, broadcast TV, pay and specialty TV and the “total TV marketplace” (which includes internet streaming TV), internet news sources and newspapers.
Concentration levels have stayed steady for mobile wireless services, except in Quebec. This is the most competitive wireless market in the country, and it shows in terms of more affordable rates for several tiers of services not just from Videotron but each of the national carriers competing with it in the province, and higher monthly data allowances.
Concentration levels have risen in search, mobile and desktop operating systems, mobile and desktop browsers as well as internet advertising. This suggests that, far from being immune to consolidation, “core elements of the internet” are highly susceptible to such pressures.
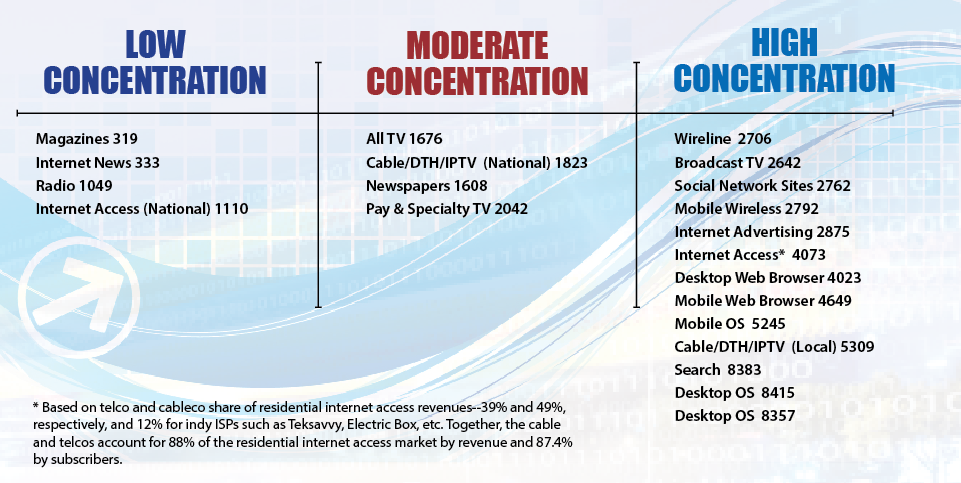
The following figure depicts the state of play in 2016 for each media covered in this report based on HHI scores.
We also pay particularly close attention to Google and Facebook’s fast growing dominance of internet advertising. In 2016, the two internet hypergiants’ took in nearly three-quarters of the $5.5 billion Canadian internet advertising market (72%)—up from their two-thirds combined share the year before. The shift to the “mobile internet” has allowed both companies to consolidate their grip on internet advertising and to resurrect the old “walled garden” vision of the internet that many have thought died after the dot.com bust at the turn-of-the-21st Century: now, however, Google has search, Youtube, the Chrome browser, Android operating system, undersea cables, and the cloud in its “stack”; Facebook has messenger, Instagram and WhatsApp in its—both seek to turn their platforms into all-in-one apps where people seldom leave.
Many observers denounce Google and Facebook on grounds that they are pillaging the revenue that traditional, advertising-based media industries need to support the production of entertainment, journalism and Canadian culture. Our last report cast doubt on these claims, and this one does too by raising and exploring the following three points:
- the $5.5 billion internet advertising market that Google and Facebook dominate is a tiny part of the $80 billion media economy in Canada;
- the “big five”—Bell, Rogers, Telus, Shaw and Quebecor—are many times larger than Google and Facebook based on revenue from Canada. Bell’s revenues were eight and sixteen times those of Google and Facebook, respectively, and forty times those of Netflix. To put things in perspective, Google, Facebook and Netflix were the sixth, eighth and fifteenth biggest media companies in Canada last year based on their estimated revenues;
- the perception that Google and Facebook are “vampire squids” is not entirely without merit but fails to realize that the real driving problem is probably that total advertising spending appears to have hit a ceiling in real dollar terms and is declining on a per capita basis and relative to the size of the network media economy. That Google and Facebook are carving out a bigger share of a shrinking pie is undoubtedly sharpening the conflict between them and those who see them as the source of all—or at least a lot of—their woes.
Additional headlines of this report include:
- after spiking between 2010 and 2014, concentration levels have drifted downwards across the whole network media economy in recent years;
- the top five companies—Bell, Rogers, Telus, Shaw and Quebecor—accounted for 71.1% of the $80 billion network media economy last year, down slightly from 71.5% the year before;
- Bell is the biggest player in Canada by far—nearly twice the size of its closest rivals, Rogers and Telus—and it single-handedly accounted for 27% of all revenue last year—unchanged from a year earlier;
- mobile wireless is still highly concentrated with Rogers, Telus and Bell accounting for 91.2% of the sector’s revenue in 2016—down one percent from a year earlier;
- new entrants Wind Mobile and Videotron’s share of the market ticked upwards to 4.1% in 2016—up from 3.2% the year before;
- the least concentrated mobile wireless market in Canada is in Quebec, where Videotron had 13% market share by revenue and 15% based on subscribers at the end of 2016;
- incumbent telephone and cable companies accounted for 88% of the residential retail internet access market in 2016 (i.e. Bell, Rogers, Shaw, Telus, Videotron, Cogeco, Eastlink, SaskTel and MTS).
- the quick pace of IPTV growth over the past half-decade means that the “cable monopoly” is long gone. A tight duopoly persists, however, and local markets are extremely concentrated by the standards of the HHI;
- there was a steep rise in TV concentration between 2010 and 2014 but the spin-off of some pay TV services by Bell and Shaw (Corus) and the rise of Netflix and other OTT services has helped turn the tide. The “big 5” TV operators’ took 81.1% of all TV revenue (including internet streaming) last year—down from 87% in 2014;
- the number of Canadian households with a cable TV subscription fell to 79.4% last year, down from 85% five years earlier but those losses have been offset by price increases in cable TV and broadband internet access that have outpaced the consumer price index by large margins;
- combined, Bell and Shaw (Corus) accounted for nearly half of the entire television universe (e.g. television distribution and services) by revenue as well as 130 television stations and services in 2016;
- Netflix replaced Quebecor as the 5th largest TV player last year with an estimated revenue of $534.1 million. Smaller TV operators such as DHX, Stingray, Blue Ant, Channel Zero, APN, V Interactions and CHEK have benefitted from these openings. However, their combined market share last year was significantly less than Astral Media’s alone on the eve of its take-over by Bell in 2013 (7.6%);
- Canadians get their news from a wide plurality of internet news sources, both old (CBC, Postmedia, Toronto Star, CTV) and new (Huffington Post, Buzzfeed), as well as domestic and foreign (BBC, Yahoo!-ABC, Guardian, New York Times);
- The scale of vertical integration amongst the “big 4” vertically-integrated giants in Canada more than doubled from 2008 to 2013. In 2016, Bell, Rogers, Shaw (Corus) and Quebecor accounted for 55.6% of the nearly $80 billion industry—nearly four times higher than vertically integrated companies’ share of the network media economy in the US;
- diagonal integration is where mobile wireless, wireline, ISPs and BDUs are owned by one and the same player, and is extensive in Canada as well, whereas in many countries there are stand-alone mobile network operators (MNOs), such as T-Mobile or Sprint in the US, or 3 in the UK, and Vodafone in many countries. The last stand-alone mobile wireless company in Canada–Wind Mobile–was acquired by Shaw in 2016;
- Vertical and diagonal integration tend to dampen competition between different ‘modes of communication’, raise prices, limit the size of monthly data caps, promote the use of zero-rating schemes that challenge the precepts of net neutrality (i.e. common carriage), etc. The use of data caps and zero-rating turns carriers into editors, or gatekeepers, and tilts the ‘model’ of the evermore internet- and mobile wireless-centric media universe towards a logic of integration, control and “walled gardens” vs “the open internet”.
- In recent years, the CRTC has rediscovered media concentration and taken steps to do something about it in a series of landmark rulings: e.g. its Mobile TV, Talk TV, regulated wholesale mobile wireless and wireline decisions, and last year’s “zero-rating” decision that girded the already strong “Net Neutrality” framework in Canada. Common carriage (or “net neutrality”) is crucial in a context where high levels of vertical integration obtain, although it does not turn on the point. Whether the Commission’s new chair, Ian Scott, will continue to hold the line in this regard, it is still too early to tell;
- Incumbent companies have flooded the courts with appeals of CRTC rulings and petitioned the Liberal Government to overturn others. Such efforts have been mostly unsuccessful. With the Telecommunications Act and Broadcasting Act slated for review, among the many policy initiatives underway, the years ahead will be critically important in terms of shaping how the network media economy will develop over the long-run.
The Canadian Media Concentration Research project is directed by Professor Dwayne Winseck, School of Journalism and Communication, Carleton University. It is funded by the Social Sciences and Humanities Research Council and has the mission of developing a comprehensive, systematic and long-term analysis of the media, internet and telecom industries in Canada.
Professor Winseck can be reached at either dwayne.winseck@carleton.ca or 613 769-7587 (mobile).
Acknowledgements:
Special thanks to Ben Klass, a Ph.D. student at the School of Journalism and Communication, Carleton University, and Lianrui Jia, a Ph.D student in the York Ryerson Joint Graduate Program in Communication and Culture, for assistance with the data collection and preparation of this report. Ben also made substantive contributions to the analysis and discussion of wireless services in Canada, and by lending a keen editorial eye to early drafts of this report.
Also, thanks to Sabrina Wilkinson, a graduate of the School of Journalism and Communication at Carleton University and now at Goldsmiths University in the UK, also offered valuable contributions to the sections on the news media and to Sarah Green of SiLK Web Solutions for help with the preparation of the various tables and figures and for maintaining the CMCR Project database and website.
Introduction
This is the second of two annual reports that review current developments and long-term trends in the telecoms, internet and media industries in Canada. Building on the first report in this series that examined the general economic conditions and trends within these industries, this second report zeroes in on another simple but profoundly important question:
have telecom, internet and media markets become more or less concentrated over time and how do we know one way or another?
This question is surprisingly difficult to answer because the issue is highly politicized and good data is hard to come by. As Philip Savage observed nearly a decade ago, debates about media concentration in Canada “largely occur in a vacuum, lacking evidence to ground arguments or potential policy creation either way”. That still holds true.
To help address these problems, this report analyzes concentration trends across the largest sectors of the telecoms, internet and media industries in Canada between 1984 and 2016: wireline and mobile wireless, internet access, television distribution (cable, satellite & IPTV), specialty and pay TV, internet streaming TV, broadcast TV, radio, newspapers, magazines, search engines, social media, internet news sources, internet advertising, desktop and mobile browsers, and desktop and smart phone operating systems—the core elements of what we refer to as “the network media economy”.
Each of these media sectors is examined on its own, and then they are grouped together into three more general categories: carriers/platforms; media content; and internet media. At the end, they are all grouped together to give us a view of the whole telecoms, internet and media landscape. Two common tools—concentration ratios (CR) and the Herfindahl-Hirschman Index (HHI)—are then used to assess the trends one way or another.
This research is conducted independently thanks to funding from SSHRC. As part of our mission of contributing to public knowledge and discussion of these issues we make all the data workbooks behind our reports available here and, for the first time this year, through the Scholars Portal Dataverse—a project spearheaded by a consortium of university libraries that aims to give scholarly research and writing a reliable home. Earlier versions can be found here, here, here, here and here). Anyone can freely use these reports and data sets for non-commercial and educational purposes based on the Creative Commons license.
Is Concentration Really a Problem: Four Schools of Thought
As our last report shows, the total size of the network media economy has more than quadrupled in size from $19.4 billion in 1984 to $79.3 billion last year. During this period, new segments have been added to our model of the media economy: mobile wireless, internet access, internet advertising as well as pay and internet streaming TV services, for example.
Currently, four hundred hours of video are uploaded to YouTube every minute; there were about 5.3 million Netflix subscribers in Canada last year; roughly 22 million Canadians had a Facebook account and many rely on it to get and share “the news”; expert blogs abound and whistle-blowers can and do set the news agenda; millions of websites are a click away; 689 TV services were authorized for service in 2016 and there were 1019 radio stations and 84 paid daily newspapers;[1] just over three-quarters of Canadians have a smartphone; access to a world of ideas (encompassing the best and the worst humanity has to offer) is just “a click away”. Canadians use all kinds of different information and communications technologies extensively: how can media and internet concentration possibly be a problem in this context of abundance?
In light of these realities, the first, and probably the most prominent, school of thought argues that if there was ever a golden media age, this is it (Thierer & Skorup, 2014). MIT Professor Ben Compaine (2005) offers a terse one-word retort to anyone who thinks otherwise: Internet. Media consultant Ken Goldstein argues that the pressing issue today is media fragmentation, not concentration (see here and here). It’s time for media companies to bulk up to compete, he thinks.
Large media conglomerates such as BCE tend to hold similar views: critics allege that media concentration is high, but the evidence “regardless of the metric employed—proves otherwise” (Bell, para 46). Think tanks like the Montreal Economic Institute, Fraser Institute, MacDonald Laurier Institute and C.D. Howe Institute offer a steady stream of reports and policy briefs fleshing out the arguments—which, in this author’s view are too often dutifully covered by the press without alternative and independent views getting similar treatment.
From this perspective, we are witnessing a battle of “the Stacks”. Vertical integration between telecoms companies and TV service providers is an integral part of dynamic competition and it is not only to be expected but welcomed because consumers like bundled services, while companies compete intensely not just on individual services but the whole bundle. From this view, any attempt to shackle telecoms and media companies with ownership restrictions will put them at more of a disadvantage as they increasingly compete with global digital media behemoths like Google, Amazon, Apple, Netflix, Facebook, and so on (Public Policy Forum, 2017; Skorup & Thierer, 2012). Bell underscores the point in its 2015 Annual Report: “digital advertising revenues . . . [were] lower . . due to [the] continued shift of advertising dollars to global players like Google and Facebook” (p. 68). In this view, competition does not just occur between providers of substitute goods, but across an entire ecosystem of related digital goods and service that some refer to as the “modular Internet” (Eisenach, 2016).
As proponents of this view see things, in the “digital ecosystem” there are telecoms operators on one side and “the stack”[2] ruled by Google, Amazon, Facebook, Apple and Microsoft (GAFAM) on the other. Each of them has moved up and down the stack, significantly diversifying their operations. Their activities now include not only, popular search engines, social media sites, online retail options, and software but a hierarchically organized stack that also includes, for instance, operating systems (e.g. Android, iOS), data centres (Amazon Web Service, with Microsoft’s Azure, Apple’s own data centres, Google Cloud), and even the fibre optic cables—overland and underseas—that carry much of the world’s internet traffic and which even Netflix now depends heavily upon to meet its gargantuan-scale needs for data storage and to bring its services closer to its subscribers’ doorstep. Amidst this “battle of the stacks”, many in this first school believe that focusing on “telecoms” and “media” is akin to looking at the future through the rearview mirror.
Think tank scholars and corporate consultants such as Jeffrey Eisenach who tout these ideas together with a radical brand of free market fundamentalism are also being regularly flown into Canada for industry conferences and as hired experts at CRTC hearings (see here). While such ideas were once the preserve of right wing, fringe institutes in the US they have since been swept into power with Eisenach and a few others serving as telecoms policy advisors to the Trump Administration. And those ideas are also being woven into the circuit of respectable views in this country for the reasons just observed (also see here). Such views have even made odd-bedfellows with a kind of resurgent cultural nationalism amongst many people in the “creative industries” who fear—not without cause—the internet hyper-giant juggernaut.
The lobbying agenda around these issues has also heated up in recent years. The C.D. Howe Institute, for instance, urges the Trudeau Government to do away with outdated regulation and unshackle the telecoms-internet and media operators to compete amongst themselves and with the global internet giants. Whatever dominance they might gain will be transitory, they say, channeling the ideas of Joseph Schumpeter (1943). Old laws need to be dismantled and new ones fit for new times adopted. A key component of this view is that most oversight should be shifted to general principles of competition law, while the CRTC’s sails need to be trimmed. A recent MacDonald Laurier Institute report by former CRTC Vice Chair Len Katz and Institute senior fellow Sean Speer exemplifies this position. The consequences of not doing so could jeopardize the incumbents’ attempts to invest in our future, they argue, and whatever gains consumers might achieve will be lost down the road as the next generation of broadband capabilities and a new era of television and entertainment are sacrificed on the alter of short-term expediency. Government must take the long view, they intone, rather than pandering to short-term populist politics (see e.g. the Fraser Institute, Montreal Economic Institute, C.D. Howe Institute, MacDonald Laurier Institute).
Seen from another angle, however, these reports’ intransigent rhetoric of futility, perversity and jeopardy sounds a lot like the “rhetoric of reaction . . . in which conservative public figures, thinkers, and polemicists have been arguing against progressive agendas and reforms for two hundred years” (Hirschmann). Rather than contributing to a genuine discourse about the relationship between markets, business and economics, their real goal seems to be aimed toward disarming governments from doing what they are supposed to do: govern in the public interest.
A second school quantitatively analyzes reams of media content to see how changes in media ownership might affect content, particularly in relation to the issue of bias. This body of research is often driven more by the ideological predilections of its practitioners, however, with those on the left typically finding that ownership consolidation reinforces a conservative bias in the media while those on the opposing side find that consolidation empowers media conglomerates to achieve laudable economic and democratic goals. The best of this kind of research tends to find that the evidence on the matter is “mixed and inconclusive”—a result that has stayed remarkably consistent for decades (here and here).
To my mind, however, reducing the questions to whether concentration plays to good or ill “effects” is like trying to draw a camel through the eye of a needle. Even the most judicious of such research proceeds as if change in content is the only concern worth reflecting on or, as Todd Gitlin put it in a classic essay on media effects research, as if “no effect” might not be better seen as preserving the status quo. If so, that would be a significant problem in its own right.
A third school includes critics of media, internet, wealth, and corporate concentration such as Robert McChesney (2014). McChesney does not deny that the digital revolution is changing the world, but emphasizes an often overlooked fact: the core elements of the internet are no less prone to concentration than media in the past. In his classic book The Media Monopoly, Ben Bagdikian also argued that the number of media firms in the US that account for most of the revenue plunged from fifty to just five between the early 1980s and the early 21st Century. Canadian critics decry what they see as similar trends, and the debasement of news and the political culture of the country that has ensued as a result (here and here).
Critics also see the internet as draining money away from the media and entertainment industries—newspaper advertising especially—and into the coffers of Google, Facebook, Amazon, and so on. McChesney, however, does not lament the loss of advertising-sponsored journalism. Instead, he stresses the fact that the diversion of ad dollars away from journalism to the internet giants exposes a fundamental truth about the news: it is a public good, and most people don’t want to pay full freight. Consequently, the number of daily newspapers and full-time journalists is plunging and under-employed journalists are flocking to public relations in droves. Similar trends apply to Canada, but have lagged behind the US by a couple of years (see the last report on this point). Now is the time to recognize this forthrightly and turn to what the United States did in copious amounts throughout the first century-and-a-half of its existence, and that European countries and, to a lesser extent, Canada, continue to do: subsidize the news as the public good it is—on normative and economic grounds (also see Picard & Pickard, 2017).
Other critics of the US internet giants, such as Joseph Taplin’s Move Fast and Break Things and the Public Policy Forum’s Shattered Mirror report, converge with their leftist critics on this point. Indeed, a renaissance of the anti-monopoly tradition is arising from multiple directions that cuts across left-right political lines with Amazon, Facebook, Google, and so forth, in its sights. A diverse range of concerns underpins this revival, including critiques of the blackbox nature of internet giants’ platforms and businesses (Pasquale); the possibility that lush profits in one market (e.g. Amazon’s cloud services division) are being used to cross-subsidize razor thin profits (or none at all) in other markets to crush existing competitors and deter new ones from emerging (Khan; Srnicek); the use of price discrimination not to benignly enhance efficiency, as its advocates claims, but to discriminate between those who will be served and those who won’t—all in ways that are unfair and opaque; a desire to rein in the unlimited strip mining of personal and public data to protect privacy, reputation and socio-cultural norms like trust that underpin viable markets, society, democracy and civilization as a whole (Pasquale; Zuboff); concerns that “fake news” is not a random fluke but an expected byproduct of the internet giants’ business model and dominant stature in the market and society (Tufecki); the crisis of journalism and the media, culture and entertainment industries (McChesney; Taplin) and so on (also see The Economist, Bloomberg, Fortune, Vox and Wired).
A fourth school—and one that I largely align with–agrees with the first school that the shift from the industrial media of the 19th and 20th centuries to the digital, internet-centric media of the 21st Century entails enormous changes. This ongoing shift has, in turn, unleashed a “battle over the institutional ecology of the digital environment” (Benkler, 2006, ch. 11), with the broad contours of what is to come up for grabs. This perspective is also informed by the idea that the history of human communication is one of recurring ‘monopolies of knowledge” (Innis, 1951) and oscillations between consolidation and competition (John, 2010; Babe, 1990). Seen from this angle, it would be hubristic—or naïve—to think that our times will be any different (Noam, 2016, Benkler, 2006; Wu, 2010; Crawford, 2012).
From this perspective, the core elements of the networked digital media may actually be more prone to concentration than was the case for traditional media, because digitization magnifies economies of scale and network effects in many areas: mobile wireless (Rogers, BCE, Telus), search engines (Google, Bing, Yahoo, DuckDuckGo), Internet access (ISPs), music and book retailing (Apple and Amazon), social media (Facebook), browsers, operating systems, and access devices (Apple, Google, Nokia, Samsung). At the same time, however, digitization and the internet reduce barriers to entry in other areas, allowing many small players to flourish. A two-tiered digital media system is emerging, with many small niche players revolving around a few enormous “integrator firms” at the centre (Noam, 2016; Wu, 2010).
Reflecting on the results of a thirty-country study, Noam (2016) observes that concentration levels for mobile wireless and other “platform media” are “astonishingly high” and that while the data for content media is mixed, the trend is an upward direction (see especially chapter 38, pp. 1307-1316). Understanding where Canada fits within this context—that is, does it rank high, low or in between by international standards on the issue of media concentration—is the key purpose of this report.
The “fourth school” shares some similarities with the critical school in its insistence that core elements of the network media economy and internet are no less prone to concentration than previous media. However, it does not see concentration as inevitable. In fact, it takes clashes between the “tech titans” and “telecom behemoths” as critically important for two reasons: first, they are examples of how different factions of business battle one another not just within markets but for access to capital investment, influence over policy, and for wealth and prestige as well as political and cultural clout. The attention paid to dynamic competition by the “fourth school” also sets it apart from “third school” critics who tend to see markets in more monolithic terms. In this sense, it is closer to the Schumpeterian views of the market fundamentalists in the first school, while also retaining a more appreciative role regarding the complexity of markets and the contingency of outcomes that are often painted as inevitable in retrospect (“history is written by the winners…”).
It also sees cross-cutting forces at work that vary by media, time and place. Consequently, much more attention is given to empirical evidence and the details of media companies and markets in comparison to what we usually find in critical approaches or those who think that things are just fine.
The “fourth school” also rejects the insinuation that the alternative to the Schumpeterian dynamic “clash of titans” is a static and anachronistic view of competitive markets. Unlike the market fundamentalists, it sees these clashes as constitutive of modern capitalism and the idea that we should accept this phenomenon as inevitable and consequently beyond investigation is a fantasy. Lastly, it rejects Schumpeter and the market fundamentalists’ disdain for people’s knowledge, the publics’ myriad interests, and democracy. Indeed, the extent to which neo-Schumpeterians skirt his elitism and disdain for democracy is astonishing given that the issues here are not just about any old set of markets, technology and policy but communications. The approach taken here, in contrast, sees the market as a means to an end and markets as being constituted by rules and laws forged in the hurly burly of politics and all the complexity of society. Those rules and laws will vary by time, place and media, moreover. In a democracy, the first rule of governments is not to shield themselves, technology and/or markets from the public and people’s interests but to govern in the name of those interests. In other words, these discussions are fundamentally inseparable from concerns with human well-being and democracy. The so-called “fourth school” strives to take a large and complex view of all such matters, while insisting on the need to keep a sharp eye on both the details and the broad sweep of the nascent “digital media age” (see Schumpeter, 1943/2010; Held, 1987; Keane, 2009; Habermas, 1985; Habermas, 1996).
Why Media Concentration Matters, or Who Cares?
The more that core elements of the networked media economy are concentrated, the easier it is for dominant players to use the control and influence over various layers and elements of “the stack” to blunt the sharp edges of competition (see here, here, here, here and here). Large companies straddling the cross-roads of society’s communications also make juicy targets for those who would enroll them in efforts to curb piracy, suppress “fake news”, filter and block adult content, serve the machinery of law enforcement and national security, and to promote cultural policy aims (see here, here, here, here, here and here). To take one notable example, the extent to which Google has been leveraged by copyright interests and governments to disable links to materials that are claimed to infringe copyright, remove offensive content, and disclose users’ information has soared in the last half-decade is an excellent example of this, as the company’s annual Transparency Report reveals.
In sum, the more concentrated the digital media giants are, the greater their capacity for mischief. Some concrete examples include efforts to:
- turn market power into gate-keeping power and moral authority by regulating which content and apps gain access to their operating systems and online retail spaces and which do not. Apple’s rules restricting adult content availability on iTunes and decision to remove a fund-raising app for Wikileaks on the AppStore illustrate are examples of this;
- discourage the use of virtual private networks and anonymizing techniques to reinforce the sanctity of national media content rights markets and the role of advertising in them but at the expense of making people’s media activities more identifiable, locatable and targetable (Ellis, 2016);
- be enrolled in efforts to further cultural policy goals by applying a levy on telecoms and internet access providers to support Cancon and other cultural policy goals, or to use deep packet inspection techniques to discover and prioritize Canadian content while discouraging access to “less desirable” content (Geist, 2015; Taylor, 2015);
- set the terms for owning, controlling, syndicating and selling advertising around user created content (Google, Facebook, Twitter) (van Couvering, 2011; Fuchs, 2011);
- use the media outlets they own in one area to promote their interests in another, as former Vice President Media at Bell, Kevin Crull, did several times before being ousted for meddling in CTV’s new coverage (see Telus intervention in Bell Astral, 2.0 pages 4-6 and here, here, here and here);
- set the terms for the distribution of income to musicians, journalists and media workers, and authors (Google, Apple, Amazon);
- set de facto corporate policy norms governing the collection, retention and disclosure of personal information to commercial and government third parties, as was the case with Bell’s Relevant Ads Program that was withdrawn under pressure from complaints filed with the Office of the Privacy Commissioner and the CRTC.
Good analysis adjusts to new realities, but in a way that does not dismiss long-standing concerns out-of-hand. This is the approach that we strive to follow. For example, consider the fact that in the 2011 Canadian federal election every newspaper (except the Toronto Star) that editorially endorsed a candidate for Prime Minister touted Harper. Indeed, 95% of editorial opinion expressed stumped for Harper—roughly three times his standing in opinion polls at the time and the results of the prior election.
In the 2015 election, seventeen dailies representing 71% of the editorial opinion expressed lined up behind the ruling Conservatives.[3] The owners of the Postmedia Group, most notably, directed the ten dailies that comprise its national chain of papers, and the six major Sun dailies in London, Toronto, Ottawa, Winnipeg, Calgary and Edmonton that it acquired in 2015, to publish an editorial endorsement of Steven Harper for Prime Minister (55% of expressed editorial opinion). The action ran roughshod over with the long-standing convention in journalism circles whereby local editors write their own editorial endorsements, and this raised the hackles of some of the chain’s journalists and editors but with no discernible effect. The ‘editorial endorsement from headquarters’ also broke Postmedia’s pledge to the Competition Bureau to keep the editorial lines of the Sun papers it had just acquired separate from those it already owned, but this too was met with impunity. The Globe and Mail took the odd position of endorsing the Conservatives but not Harper—meaning that the editorial support for the Conservatives was roughly two-and-a-half times their low 30 percent standing in the polls and final voting results.
There were, however, more cracks in the wall of editorial opinion in the 2015 federal election. For example, Torstar’s Toronto Star, Hamilton Spectator and the Guelph Mercury (21% of expressed editorial opinion) both endorsed the Liberals, as did La Presse (Power Corp) (8% of expressed editorial opinion) and the Charlottetown Guardian (Transcontinental) (1% of expressed editorial opinion). Le Devoir cast its lot with the Bloc Québécois (representing 2% of expressed editorial opinion) (see here for a fuller treatment of this issue). No major daily endorsed the NDP.
As this discussion suggests, ultimately, talk about media concentration is a proxy for larger conversations about the shape of the mediated technological environments through which we communicate, know and express ourselves in the world, consumer choice, freedom of the press, citizens’ communication rights and democracy. Of course, such discussions must adapt to new realities, but the advent of digital media does not render them irrelevant one bit In fact, it may make them more relevant than ever (Baker, 2007; Noam, 2009; Peters, 1999).
Methodology: How Do We Know if Media Concentration is Intensifying or Declining?
Measuring media concentration begins by setting out the media industries to be studied, as done at the outset of this post. Revenue data for each of these sectors, and for each of the firms within them with over a one percent market share, is then collected and analyzed. This handy dandy list of sources and others listed here were used.
Each media sector is analyzed on its own and then grouped into three categories, before scaffolding upwards to get a birds-eye view of the whole network media ecology: (1) platform media; (2) content media: (3) online media. Results are analyzed from 1984 to 2016, with an eye to capturing changes over time. Lastly, two common tools—Concentration Ratios (CR) and the Herfindhahl-Hirschman Index (HHI)—are used to depict concentration levels and trends within each sector and across the network media ecology as a whole.
The CR method adds the shares of each firm in a market and makes judgments based on widely accepted standards, with four firms (CR4) having more than 50 percent market share and 8 firms (CR8) more than 75 percent considered to be indicators of media concentration (see Albarran, p. 48). The Competition Bureau uses a more relaxed standard, with a CR4 of 65% or more possibly leading to a deal being reviewed to see if it “would likely . . . lessen competition substantially” (p. 19, fn 31).
The HHI method squares the market share of each firm in a given market and then totals them up to arrive at a measure of concentration. If there are 100 firms, each with 1% market share, then markets are thought to be highly competitive (shown by an HHI score of 100), whereas a monopoly prevails when one firm has 100% market share (with an HHI score of 10,000). The US Department of Justice embraced a revised set of HHI guidelines in 2010 for categorizing the intensity of concentration. The new thresholds are:
HHI < 1500 Unconcentrated
HHI > 1500 but < 2,500 Moderately Concentrated
HHI > 2,500 Highly Concentrated
At first blush, these higher thresholds seem to dilute the earlier standards that had been set back in 1992. While this may be true, the new guidelines can be seen as being even more sensitive to reality and tougher than the ones they supersede.
This is because they give more emphasis to the degree of change in market power when ownership changes take place. For instance, “mergers resulting in highly concentrated markets that involve an increase in the HHI of more than 200 points will be presumed to be likely to enhance market power”, observes the DOJ (emphasis added, p. 19).
Second, markets are defined more precisely based on geography and the details of the good or service at hand versus loose amalgamations of things based on superficial similarities. This is critical. It distinguishes those who would define the media universe so broadly as to put photocopiers and chip makers alongside ISPs, newspapers, film and TV and call the whole thing “the media” (e.g. Skorup & Theirer; Compaine). In contrast, the scaffolding approach we use analyzes each sector before moving to higher levels of generality until reaching a birds-eye perspective on the network media as a whole. It is important to note that this method allows us not only to draw general conclusions from the birds-eye perspective, but also to analyze developments at a much more precise level. Approaching the subject from multiple vantage points allows us to undertake integrated empirical analysis based on observations of dynamics at all levels, something that is simply not possible (and certainly would not be credible) without precise and meticulous attention to specific detail.
Third, the new guidelines turn a circumspect eye on claims that enhanced market power will be good for consumers and citizens because they will benefit from the increased efficiencies that result. What is good for companies is not necessarily good for the country (see Stucke & Grunes, 2012; Mazzucato, 2014).
Lastly, the new guidelines are emphatic that decisions turn on “what will likely happen . . . and that certainty about anticompetitive effect is seldom possible and not required for a merger to be illegal” (p. 1). In practice this means the goal is to nip potential problems in the bud before they happen. It also means that experience, the best available evidence, contemporary and historical analogies as well as reasonable economic theories form the basis of judgment, not deference to impossible (and implacable) demands for infallible proof (p. 1).
These assumptions overturn three decades of Chicago School economic orthodoxy and its grip on thinking about market concentration (see Stucke & Grunes, 2012; Stucke & Grunes, 2016; Posner, 2011). The focus is no longer just on horizontal integration within a market but also in terms of vertical and diagonal integration across markets. The emerging view also goes beyond assessing matters mainly in terms of potential consumer harms and benefits (e.g. how do we deal, for example, with “free” services like those on offer from Google or Facebook? How do mergers affect relationships among competitors or complementary goods and services?). Freed from a half-century long orthodoxy, and subordination of policy and politics to conservative economists, think tanks and judges, the new guidelines in the US set a tough hurdle for those with the urge to merge. It is just this kind of thinking that killed the bid by AT&T—the second largest mobile wireless company in the US—to acquire T-Mobile, the fourth largest, in 2011, for instance (also Stucke & Grunes, 2012). Similar concerns also loom at present as AT&T prepares a takeover bid for Time Warner.
For years, the toughening stance on concentration issues in the US and EU had largely passed Canadian regulators by but that has been changing recently. The CRTC’s tepid stance on such matters was exemplified by the Commission’s 2008 Diversity of Voices policy, which established a static measure for reviewing mergers that has no sense of trends over time or capacity to analyze the drift of events across the media. Not surprisingly, the Diversity of Voices policy has done nothing to stop consolidation within the broadcasting industries let alone between them and the telecoms and internet industries, as the evidence below demonstrates.
In contrast to the CRTC, the Competition Bureau does at least draw selectively from the US HHI guidelines. While it does not use the HHI thresholds, it does focus on “the relative change in concentration before and after a merger” (emphasis added, p. 19, fn 31).
The CRTC began to tiptoe in a different direction in 2012, and several decisions since suggest that it has rediscovered market power and the will to do something about it:
- the Mobile TV decision in which it shored up common carriage (network neutrality) principles by preventing mobile wireless carriers from unjustly discriminating against television programs and other types of communications delivered over the internet in favour of their own services. In doing so it effectively banned the nascent practice of zero-rating whereby some content service chosen by the carriers do not count towards your data caps, while similar types of services do. The decision is crucial because it reaffirms the principle that telecoms service and internet access providers are carriers not editors, a distinction that was upheld when the Federal Court of Appeal rejected an appeal of the Mobile TV decision by Bell;
- the Talk TV decision requiring the adoption of skinny basic cable TV packages and the unbundling of TV channels so that they are offered fully on an ala carte base by 2016;
- the mandated wholesale wireless framework designed to enhance competition in mobile wireless services by regulating wholesale roaming rates and other factors which affect the viability of would-be rivals such as Videotron and Wind (now Freedom Mobile after a 2016 takeover by Shaw);
- the mandated wholesale wireline decision that extends regulated wholesale access to the incumbent telecom and cable companies’ fibre-to-the-premise networks to help encourage competition in the retail broadband internet market while ensuring that rivals such as TekSavvy, Distributel, Primus and others can still compete as technology shifts from copper and coaxial-based networks to fibre-based facilities – all of which the incumbent telecoms and cable companies have fought tooth-and-nail, and which Bell has appealed to the Liberal Cabinet to overturn.
Several key principles underpin these decisions. One is the CRTC’s recognition that the “incumbent carriers continu[e] to dominate the retail Internet access services market” (CRTC, 2015-326, para 125). The wholesale mobile wireless decision arrived at the same conclusion with respect to the wireless market (CRTC, 2015-177, paras 35, 72-74, 86-88). Moreover, there is “limited rivalrous behaviour” between the incumbents, the Commission observed with respect to fibre-based broadband access networks (CRTC, 2015-326, para 123). The Commission was especially blunt when it stated that whatever “competition that does exist today is largely, if not entirely, a result of regulatory intervention” (CRTC, 2015-326, para 123).
The upshot of this recent turn of events is two-fold: first, concerns for the harmful potential of market concentration and market power are not just conjecture, but have been found to be factually based and significant by administrative tribunals such as the CRTC and the courts. Second, in the face of such realities, the regulator has stiffened its spine and acted in a manner that marks a clear break from the “regulatory hesitation” that has defined so much of the regulatory culture in Canada in the past (Berkman, 2010, p. 163).
Whether this will continue to be the case is a crucial issue. However, history and international experience teaches that in the face of intransigent and self-serving opposition from incumbents, only governments and regulators with a stiff spine and strong political can succeed in fostering more competition and improved developments in the communications and media fields (see, for example, Noam, 2013; Mazzucato, 2014; OECD, 2013, p. 23; Ofcom, 2012, pp. 67-68; Ofcom, 2012; Stucke & Grunes, 2012; Stucke & Grunes, 2016; US, DoJ, 2011; Berkman, 2010, pp. 162-168).
The Historical Record and Renewed Interest in Media Concentration in the 21st Century
While this regulatory about face may be new, a keen interest in media concentration is not. As a matter of fact, there has long been an abiding interest in the subject in Canada and the world over since the late-19th and early-20th centuries, even if it such interest ebbs and wanes over time.
In 1910, for example, early concerns with the ill effects of market concentration were registered when the Board of Railway Commissioners (BRC)—the distant cousin of today’s CRTC—broke up a three-way alliance between the countries’ two biggest telegraph companies—the Canadian Pacific Telegraph Company and the Great Northwestern Telegraph Company (the latter a division of the New York-based goliath, Western Union)—and the US-based Associated Press news wire service. Why?
It did this for much the same reasons that the CRTC gave in justification of the Mobile TV decision discussed a moment ago. That is, because carriers should not be editors who use their control over the wires (or spectrum) to decide who gets to speak to whom on what terms.
In this historical case, and in the face of much corporate bluster, the regulator was emphatic that while allowing the dominant telegraph companies to give away the AP news service for free to the leading newspaper in one city after another across the country might be a good way for the companies to attract subscribers to their vastly more lucrative telegraph business it would effectively “put out of business every news-gathering agency that dared to enter the field of competition with them” (1910, p. 275).
In a conscious effort to use telecommunications regulation (operating under the auspices of railway legislation at the time) to foster competing news agencies and newspapers, Canada’s first regulator, the BRC, forced Western Union and CP Telegraphs to unbundle the AP news wire service from their telegraph service. It was a huge victory for the Winnipeg-based Western Associated Press—the appellant in that case–and other ‘new entrants’ into the newspaper business as well. It was also the decisive moment when the principle of common carriage was firmly entrenched in Canadian communications policy and regulation (Babe, 1990).
In short, the BRC acted to constrain corporate behavior out of the conviction that concentration within the telegraph industry as well as vertical integration between telegraphs and news services would run counter to society’s broader interest in competitive access to communications and a plurality of voices in the press.
Throughout the 20th century, similar questions arose and were dealt with as the situation demanded. One guiding rule of thumb of communications policy, however, was that of the “separations principle”, whereby telecoms carriers–usually two of them (e.g. telegraph vs telcos in the early 1880s, the TransCanada Telephone System (TCTS) and CNCP for three-quarters of the 20th century, the telcos vs cablecos ever since, and the telcos’ consortium Stentor versus Rogers/Cantel in the early days of mobile wireless from 1985 until the mid-1990s) competed to carry messages from all types of users, and for all types of purposes–business, personal, governmental and broadcasting–but were prevented by law from directly creating, owning or controlling the messages that flowed across the transmission paths they owned and controlled.
A general concern also hung in the air in government, business, broadcasting and reformist circles that those who made communications equipment, or operated transmission networks, should not operate broadcast stations, make movies or publish newspapers, books, software, etc. That this was so could be seen, for example, when the original equipment manufacturing consortia behind the British Broadcasting Company in the UK and the National Broadcasting Company/Radio Corporation of America in the US, respectively, were ousted from the field in the 1920s during the remaking of these entities into the stand-alone broadcasters that they eventually became. Nor should telephone companies such as AT&T play an active role in the film industry, as was the case when, after having wired movie theatres across the US and the Hollywood production studios for sound, circa 1927, AT&T took on a larger role by financing and vetting films during the 1930s (see Briggs, 1995; Barnouw, 1966; Danelian, 1939).
The consolidation of broadcasting under the CBC in the 1930s brought private broadcasters into the core of the Canadian ‘broadcasting system’ from the get-go. The creation of the CBC also wiped out important local, foreign and educational voices, and even a small theatrical radio club in Winnipeg who were taking live theatre from the stage to the airwaves. In each case, it was the structure and organization of the communication/media system, and who owned what and in what proportions, that decided who got to talk to whom on what terms.
The separation of transmission and carriage from message creation and control was another principle that was worked out in a myriad of different ways. Aside from high-profile efforts to keep the telegraph companies out of the news business, and telephone companies out of broadcasting and the movie business, most of the time such issues were considered tedious, boring, and tucked away in obscurity in parliamentary papers, legislation and corporate charters.
Bell’s charter, for instance, prohibited it from entering into ‘content and information publishing services’, from radio to cable TV and ‘electronic publishing’, until the early 1980s, when more and more exceptions to the general rule were adopted. The same was true for other telcos, private and public, across the country, even though Manitoba and Saskatchewan began to lay fibre rings in a handful of provincial cities and to offer modest cable TV services in the 1970s (Babe, 1990; Winseck, 1998).
Media concentration issues came to a head again in the 1970s and early 1980s when three major inquiries were held: (1) the Special Senate Committee on Mass Media, The Uncertain Mirror (2 vols.)(Canada, 1970); (2) the Royal Commission on Corporate Concentration (1978); and (3) the Royal Commission on Newspapers (Canada, 1981). While these proceedings did not amount to much in the way of concrete reform, they left a valuable historical and public record.
Things lay dormant for more than two decades before springing to life again after a wave of consolidation in the late-1990s and at the turn-of-the-21st century thrust concerns with media concentration back into the spotlight. Three inquiries between 2003 and 2008 were held as a result: (1) the Standing Committee on Canadian Heritage, Our Cultural Sovereignty (2003); (2) the Standing Senate Committee on Transport and Communications, Final Report on the Canadian News Media (2006); (3) the CRTC’s Diversity of Voices report in 2008.
Things have not let up since. Indeed, they have been on a high boil in recent years, with a non-stop series of reviews at the CRTC that will go a long way to shaping the emergent network media economy for decades, including, for instance: (1) Bell’s take-over of Astral Media, (2) the regulated wholesale access decisions affecting both the mobile wireless and wireline telecoms markets, respectively, (3) the Mobile TV decision and (4) a series of recent cases that have tested the extent to which vertically-integrated telecom-media giants like Bell, Rogers, Shaw and Videotron can leverage their control over networks to influence the content made available over those networks (for example, Videotron’s Music Unlimited case or the Rogers GamePlus and Hybrid Video-on-Demand decisions). Another landmark decision by the regulator early this year to effectively ban mobile carriers and other ISPs from “zero-rating” specific content or applications in a bid to distinguish their services from those of rivals is another key example on this score.[4]
Three Phases of Telecom, Internet and Media Consolidation and the Rise of Vertically-Integrated Telecoms and TV Companies at the Centre of the Canadian Media Universe
All of this is taking place, as I noted in the last report, within an ever more internet- and mobile-centric media economy that has grown immensely from $19.4 billion in 1984 to $79.3 billion last year.
The early years of that period (the decade between 1984 and 1996), were characterized by the emergence of new players across the media landscape and the growth of broadcast as well as pay and subscription television channels. In terms of ownership, existing players and a few newcomers, such as Allarcom and Netstar, cultivated the field.
During this period, television and radio broadcasters were often owned by companies whose interests lay in other, unallied areas, such as real estate, as with the BC TV and radio group Okanagan Skeena, or Molson’s Brewery, one of the founders of Netstar early in that entity’s history. These companies share of the market grew steadily until they were taken over by the larger players of their time. Overall, though, the general direction of events was towards more players and more diversity in television ownership.
When consolidation did take place in the 1980s and 1990s it was mostly among individual players in single media markets, i.e. horizontal integration. Conrad Black’s take-over of Southam newspapers in 1996 symbolized the times, as did the amalgamation of local and regional television ownership groups in the late 1990s to create several national commercial television networks under common ownership: CTV, Global, TVA, CHUM, TQS.
While weighty in their own right, these amalgamations did not have a big impact across the media. The CBC remained prominent, but public television was being eclipsed by commercial television as the CBC’s share of all resources in the television ‘system’ slid from 44 percent in 1984 to much less than half that amount today (17%).
Media conglomerates were not unknown (Maclean-Hunter was a good example), but they were not the norm. Bell was a diversified communications colossus, to be sure, but it was not in the media business proper, and was prevented by its charter and by law from being so.
In contrast to broadcasting and most other content media industries, concentration levels remained sky high in wireline telecoms, while new mobile wireless telecoms services were developed by two sets of competing firms: between 1983-1984, Rogers-Cantel was licensed by the Department of Communication to offer national wireless service, while 11 incumbent telephone companies (e.g. Bell Canada, Telus, MTS, Sastel) received licenses to provide competing services in their respective operating territories (Klass, 2015, pp. 58-61).
Gradual policy reforms characterized the 1980s and early-1990s, before a more concerted shift took place. Long distance competition was introduced in 1992, while two new national competitors in wireless followed in 1995 (Clearnet and Microcell), and then local telephone competition was encouraged in 1997. The Chretien Liberals also gave the green light for the telephone and cable companies to compete in one another’s turf in 1996. Concentration rates fell across the board, except in cable television distribution.
In general, telecoms competition moved slowly from the ends of the network into services and then deeper into the network infrastructure, as it had done in one country after another around the world, aided and abetted by strong government interventions that used interconnection and network unbundling rules, access to spectrum, wholesale pricing regulation, and market liberalization to actively spur on competition. Competition gained traction in the 1990s as a result but the trend was thrown into reverse by the dot.com crash in late-2000.
Whereas gradual change defined the 1980s and early-1990s, things shifted abruptly by the mid-1990s and carried on into the 21st century when three waves of consolidation swept across the telecom, internet and media industries. A flurry of highlights will help to illustrate the trends:
Wave 1: 1994 to 2000: Rogers’ acquisition of Maclean-Hunter (1994), but peaking from 1998 to 2001: (1) BCE acquires CTV and the Globe & Mail ($2.3b); (2) Quebecor takes over Videotron, TVA and the Sun newspaper chain ($ 7.4b) (1997-2000); (3) Canwest buys Global TV ($800m) and Hollinger newspapers papers, including National Post ($3.2b); (4) BC Tel, AGT, and Edmonton Tel were also amalgamated at this time, giving rise to Telus, which then acquired Clearnet for $6.6B, the largest acquisition in Canadian telecommunications history at the time)(2000).
Wave 2: 2004-2007: Rogers acquires Microcell ($1.4B) (2004). Bell Globemedia re-branded CTVglobemedia; BCE exits media business. CTVglobemedia acquires CHUM (Much Music, City TV channels and A-Channel). CRTC requires CTVglobemedia to sell City TV stations – acquired by Rogers (2007). Astral Media buys Standard Broadcasting. Quebecor acquires Osprey Media (mid-size newspaper chain)(2006). Canwest, with Goldman Sachs, buys Alliance Atlantis (2007) (Showcase, HGTV, BBC Canada and the biggest film distributor in Canada).
Wave 3: 2010 – 2015: Canwest goes bankrupt (2009-2010), its newspapers acquired by Postmedia and TV assets by Shaw. BCE reacquires CTV (2011) and bids for Astral Media in 2012, but fails to gain CRTC approval, before succeeded to do so in 2013. Bell sells Teletoon (TELETOON Retro, TELETOON Retro, TELETOON / TELETOON and the Cartoon Network), Historia and Séries+ to Corus (Shaw), the Family Channel, Disney Jr. and Disney XD to DHX media, and MusiquePlus and MusiMax to V Media, as well as ten radio stations to Newcap (5), Pattison (3) and Corus (Shaw)(2)—as the Competition Bureau and CRTC required as a condition of approval of Bell’s take-over of Astral media in 2013; Telus acquires Public Mobile (2013); Rogers acquires Mobilicity ($465M)(2015); Postmedia acquires Quebecor’s English-language papers (e.g. including the six Sun dailies, 27 small dailies and 140 community weeklies) (2015) (also see Competition Bureau approval), and Shaw acquires Wind (early 2016).
The massive wave of capital investment that drove consolidation across the telecom, media and Internet industries during these different phases, as illustrated in Figure 1 below.
Figure 1: Mergers and Acquisitions in Telecoms & Media, 1985–2015 (Mill$)
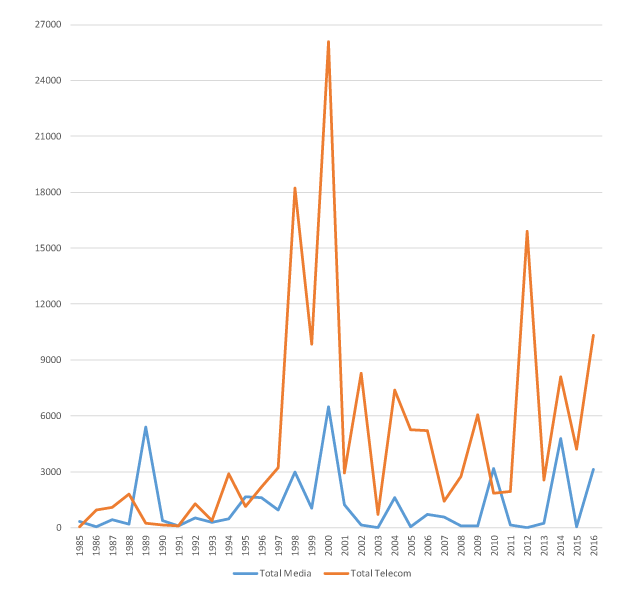
Sources: Thomson Reuters. Dataset on file with author.[1]
Mergers and acquisitions rose between 1994-1996 and spiked to unprecedented levels by 2000 but collapsed when the dot.com bubble burst. Consolidation regained steam between 2004 and 2007, plunged with the onset of the Global Financial Crisis (2007ff), and has been rising significantly since 2012. Once again, trends in the network media economy swiveled on those evident in the economy at large—a point that cannot be ignored but which too often is.
Consolidation in the telecoms industry had been modest in the latter half of the first decade of the 21st Century but rose significantly after Telus bought Public Mobile and Bell acquired the remaining stake in Bell Aliant that it did not already own in 2013 and 2014, respectively, while Rogers acquired (and then dismantled) Mobilicity in 2015. The Competition Bureau’s approval of Bell’s acquisition of MTS this year furthers the trend. It also calls into question the Bureau’s resolve on such matters given that its own analysis showed that oligopolistic behaviour by the big three national carriers—Bell, Rogers and Telus—is hobbling the availability of high quality, affordable mobile wireless services, especially in areas where there is no strong independent rival. Despite these findings, the Bureau approved the deal. Consequently, Bell’s take-over of MTS adds Manitoba to the list of provinces and regions without a strong independent operator (see our report opposing the deal).
Consolidation has also surged in recent years on the media side of things too, as Figure 1 illustrates. Shaw’s take-over of Global TV in 2010, with its suite of thirty specialty and pay TV channels and nine television stations, from Canwest (2010), kicked off the trend. Bell’s re-purchase of CTV (2011), acquisition of a joint-ownership stake (37.5%) with Rogers (37.5%) and Kilmer Sports (25%) in Maple Leaf Sports and Entertainment in 2012, and take-over of Astral a year later all fueled the trend (see the TV Services Ownership sheet in the CMCRP Workbook; BCE, Annual Report, p. 31). The latter set of deals turned Bell into the biggest TV and radio broadcaster in the country, with a suite of thirty broadcast TV stations, thirty-nine pay and specialty TV channels, and 105 radio stations in fifty-four cities nationwide.
Consolidation in the TV industry has been the result. More importantly, though, consolidation has yielded a specific type of media company that now sits at the apex of the network media universe in Canada: i.e. the vertically-integrated telecoms, internet and media conglomerate. Vertical integration has soared and is now very high relative to the past and to conditions in the United States and internationally. Figures 2 and 3, below, illustrate the steep increase in vertical integration occurred between 2008 and 2016, while Figure 5 (further down) offers a comparison with the state of affairs in the United States.
Figure 2: Vertical Integration and the Network Media Ecology, 2008
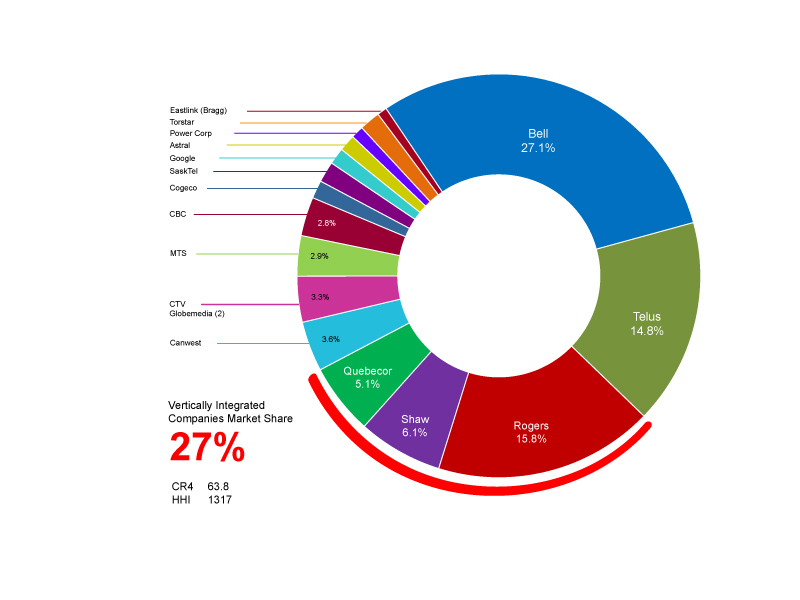
Sources: see the “Top 20 w Telecoms” sheet in the CMCRP Workbook.
Figure 3: Vertical Integration and the Network Media Ecology, 2016
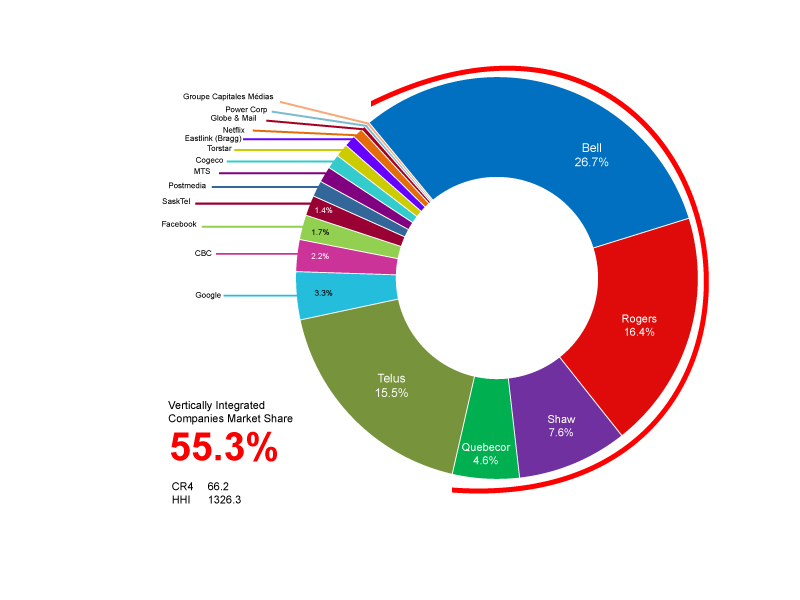
Sources: see the “Top 20 w Telecoms” sheet in the CMCRP Workbook.
As Figures 2 and 3 illustrate, in the span of half-a-decade, vertically-integrated companies’ share of the network media economy more than doubled. By 2016, four giant vertically-integrated conglomerates accounted for 55.3% of all revenue across the network media economy: Bell (CTV), Rogers (CityTV), Shaw (Global) and QMI (TVA), as Figure 3 shows.
These developments are important for several reasons. First, they distinguish the past from the present. Centre stage is currently occupied by four vertically-integrated telecoms, internet and media giants with a reach across the network media economy (one might also include Telus on account of its fast growing role in television distribution). Zero in on just telecoms and broadcasting, and the ‘big 5’ accounted for 80% of all revenue in 2016—up substantially from roughly two-thirds in 2010 (but down slightly from it’s all-time high two years ago).
Second, these five companies’ collective control over communications infrastructure is the fulcrum of their business. Their stakes in content media, while extensive, are modest by comparison; Telus is not in the content business at all beyond buying rights for its Optik IPTV and mobile TV services. For Quebecor, Shaw, Bell and Rogers, 70-90% percent of their revenues flows from their control over bandwidth and connectivity rather than from content creation and exhibition. Figure 4 below illustrates the point.
Figure 4: Connectivity vs Content within Canada’s Vertically-Integrated Telecoms and Media Companies, 2016 (Ratio by Revenue)
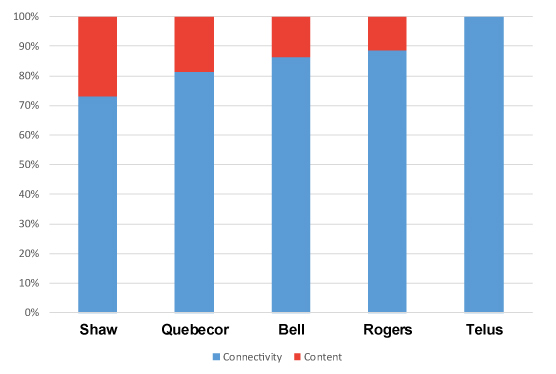
Sources: see the “Top 20 w Telecoms” sheet in the CMCRP Workbook.
Another way to put this is that content media are largely ornaments on the carriers’ corporate edifice. They are strategically important but their real purpose seems to be to drive the take-up of the companies’ more lucrative wireless, broadband, and cable, satellite and IPTV services. The fact that Bell owns roughly half of the services on its Mobile TV roster, for example, illustrates the point: e.g. CTV, CTV News Channel, CTV Two, BNN, Comedy Network, Comedy Time, MTV, NBA TV, NFL Network, E!, RDS, RDS2 and TSN, TSN2, etc.
The CRTC has already examined some of the results of these kinds of consolidation on the carriers’ behaviour. For instance, in the Mobile TV case the Commission determined that Bell was using its control over the means of delivering television programming to confer an undue preference on its services at the expense of subscribers, rivals and independent sources of content available over the internet. Bell appealed the ruling to the Federal Court of Appeal, but its appeal was rejected in mid-2016.
Other cases similar to Mobile TV, however, have emerged one after another in a never ending game of regulatory whack-a-mole: see, for example, the complaint initiated by J. F. Mezei and the Public Interest Advocacy Centre against Videotron’s Music Unlimited, which was later rolled into the regulator’s review of “differential pricing practices” (the zero-rating proceeding), or the Commission’s Hybrid Video-on-Demand decision, Hybrid Video-on-Demand decision, or Bell’s appeal of the wholesale vertical integration code, to name just a few. The thread connecting them all is the extent to which content is being tied to carriage in ways that raise fundamental questions about the future of common carriage (“network neutrality”) and ‘the open internet’, and the role that concentrated network ownership plays in these developments.
Two rulings last year under then chair Jean-Pierre Blais dealt with these issues in a way that constituted significant wins for common carriage (“net neutrality”), competition and cultural policy. In one of them, the Commission found that Videotron’s Unlimited Music program ran afoul of Canada’s telecoms law by giving undue preference to subscribers of the company’s highest tier data plans over the rest of its customers and to the music services included in its offering such as Apple Music, Google Play, Spotify versus those that are available over the internet and public airwaves but left out Videotron’s Unlimited Music offering, e.g. the CBC and commercial radio stations.
The CRTC also combined the lessons of that ruling with its 2015 Mobile TV decision and interim events to develop a general framework that effectively bans wireless operators and ISPs from singling out content-based services and apps for special treatment such as zero-rating, whether on the basis of commercial agreements or otherwise. The framework also banishes pay-to-play schemes like those in the US where certain content providers or in-house affiliates like AT&T’s DirecTV “sponsors data” so that the internet traffic generated by the use of the service does not count against AT&T subscribers’ monthly data allotments.
These rulings are clear victories for common carriage in Canada. They are clear that the long-standing telecoms policy principle of common carriage still applies to internet access and mobile phones. The rulings also clarify the idea that, when offering access to the internet, carriers are not publishers or broadcasters. In short, the basic idea is that when it comes to the selection and use of content, apps and services that are made available over the internet and via mobile phones, citizen-consumer-subscribers are in charge rather than the carriers. Seen in this light, the rulings are victories for the open internet and the idea that it is people’s expressive and communication rights that come first in a democracy rather than those who own and control the networks upon which day-to-day life, society and economic activity depend.
The cases are also especially important in the Canadian context because they address a unique feature of the media in this country: the extremely high levels of vertical integration that exists between telecoms companies and media services, especially television services. Indeed, the levels of vertical integration that now prevail in Canada are not just high by our own historical standards, but also relative to those in the United States and internationally. High levels of concentration, exacerbated by the extreme scale of vertical integration, have been significant enabling factors to the parade of harmful business practices described above.
Figure 5 below illustrates the point with respect to the United States.
Figure 5: Top Telecom-Internet and Media Companies in the US, 2016 (Market Share)
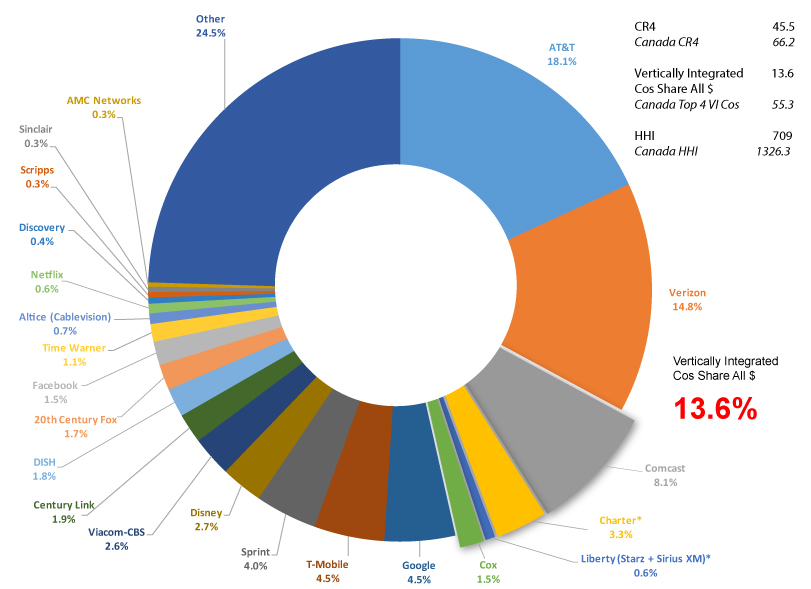
Sources: see the “Top US Telecom + Mediacos” sheet in the CMCRP Workbook.
The contrast between the extent of vertical integration in Canada shown in Figures 3 and what prevails in the United States, as shown in Figure 5, is stark. The first thing that jumps off the page in Figure 5 is just how modest vertical integration in the United States is at less than one-quarter what it is in Canada (14% versus 55%, respectively).
Whereas, as we saw earlier, Bell, Rogers, Shaw and Quebecor stand at the apex of the network media economy in Canada, in the United States, the only comparable company is Comcast. Even then, it accounts for about 8% of the US media economy whereas Bell’s relative share of the Canadian market accounts for more than three times that amount (i.e. 27%).
Despite being separate legal companies, Charter and Liberty can also be considered to be a vertically integrated operator because of the common ownership interests that stand behind them. Charter is the fourth largest broadcast distributor in the US while Liberty owned the pay TV operator Starz (Animal Planet, Discovery, Encore, Black, Starz, Movieplex, etc.) and Sirius XM until December 2016 when it was sold it to the independent film studio Lion’s Gate. Probably not incidentally, given that on a stand alone basis its incentives would likely shift from helping to protect Liberty’s much larger cable interests to getting access to as many people across as many platforms as possible, just before its sale, Starz launched its own stand-alone internet streaming television service and mobile app that is available over the internet without a cable subscription.
Cox is the only other significant vertically-integrated company in the US. It is the sixth largest cable TV operator and owns a relatively small number of broadcast TV and radio stations. Add them all up and the three vertically-integrated operators account for just under 14% of the network media economy in the US, as mentioned above—just one-fourth the prevailing level in Canada. Take Charter and Liberty out of the picture because of the spin-off and sale of Starz and the figure falls to just 10%. In practical terms, there are really just two vertically-integrated companies in the US: Comcast and Cox, and their scale relative to the rest of the US media pales in significance to the influence that the vertically-integrated companies exert on the media landscape (and policy) in Canada.
Of course, some might argue that this ignores, for example, Verizon’s “blockbuster” take-over of Yahoo this year. To put things in perspective, consider that Yahoo’s worldwide revenue last year was $5.2 billion. Verizon’s revenue in the United States alone was $121 billion—twenty-five times that of Yahoo. In other words, Yahoo is something of a pimple on the backside of an elephant. To be sure, it is not inconsequential, but given its size relative to that of Verizon and that it relies almost exclusively on advertising dollars rather than “pay-per” subscriptions to mobile wireless, broadband internet and limited pay TV services that Verizon has, Yahoo is a minor addition bolted on to a much larger corporate edifice. In sum, Verizon’s ownership of Yahoo lacks both the scale and the scope necessary for it to be considered comparable to the operations of media conglomerates in Canada (or Comcast in the US) whose holdings reach not only vertically up and down the stack but across the TV, radio and production domains.[1]
But returning to the Canadian context, that vertical integration and cross media ownership is exceptionally high in this country not just by historical and United States standards but also by international ones is depicted in Figure 6, below. It uses the most recent data available for the twenty-eight countries covered by the International Media Concentration Research Project and for Canada for the years covered by that project and 2013 in order to account for Shaw’s acquisition of Global TV in 2010 as well as Bell’s acquisition of CTV and Astral Media in 2011 and 2013, respectively.
Figure 6: Vertical Integration and Cross-Media Ownership — Canada in a Global Context, 2004 – 2013
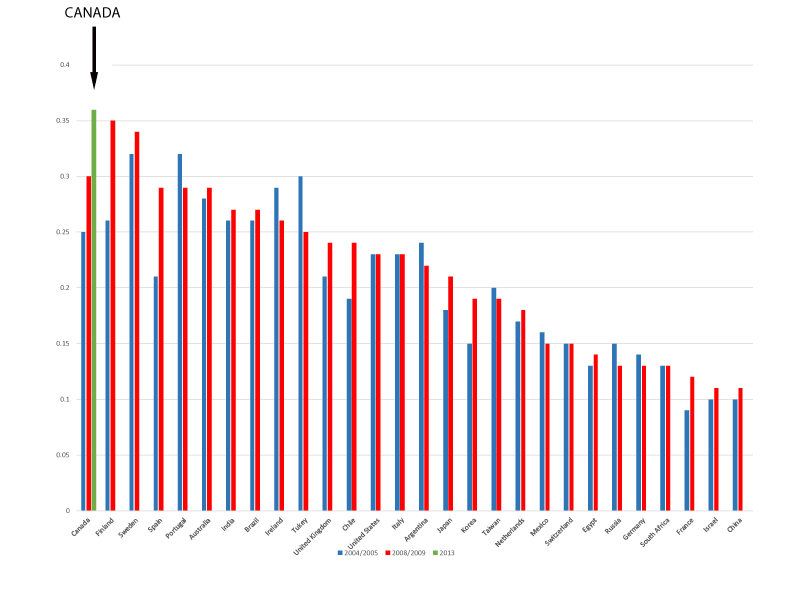
Sources: see the “CrossOwnership Canada vs World” sheet in the CMCRP Workbook and International Media Concentration Research Project.
While the data upon which Figure 5 is based is dated, it is still the best available and, furthermore, there are no developments that I am aware of to suggest significant changes across the countries depicted that would counter the conclusions being presented here.
With those comments in mind, Figure 5 indicates that, by 2013, after Shaw and BCE acquired Global TV, CTV and Astral Media, respectively, Canada had the highest levels of vertical integration and cross-media ownership out of the 28 countries studied. It also shows that Canada has been closer to the high rather than the low end of the scale throughout the period covered when it comes to vertical integration and cross media ownership. It ranked 19th out of 28 in 2004. By 2009, however, it had moved closer to the top of the scale, with the third highest levels of vertical integration, after Finland and Sweden.
There has, of course, been an increase in vertical integration in the US on account of Comcast’s acquisition of NBCUniversal in 2011. And things could shift again if AT&T’s bid for Time Warner goes through but there is no reason to be sanguine regarding its prospects (see here, here and here). If that scenario does come to pass, the extent of vertical integration in the United States would more than double. The upshot remains, however, that even taking account of these recent and possible developments, conditions in the US fall well short of what they are in Canada. Moreover, beyond the US, for most countries depicted in Figure 6 above, the trend over time frame has been away from vertical integration not to its embrace.
These kinds of observations have led scholars from across the political spectrum to observe that, while popular within the industry and amongst the mergers and acquisition crowd in the late-1990s, the tide toward vertical integration has reversed since the early-2000s. Since then, many media conglomerates have floundered badly, been dismantled or failed outright (e.g. AOL Time Warner, AT&T, Vivendi, Adelphia, Canwest, CBS-Viacom, News Corp, etc). Cast in this longer and broader context, Comcast’s acquisition of NBCUniversal in 2011 and AT&T’s potential take-over of Time Warner are fairly rare exceptions to the rule (Picard, 2011; Jin, 2013; Skorup & Thierer, 2012; Thierer & Eskelen, 2008; Waterman & Choi, 2010). The dominant trend, as Dal Yong Jin observes, since the mid-2000s has been toward vertical dis-integration and de-convergence. Conditions in Canada have run counter to that tide.
A Closer Look: Competition and Concentration Trends with Specific Media Industries
The following sections focus on developments sector-by-sector, and within the three main categories we use to group each of the sectors covered by the CMCR project:
- platform media (wireline & wireless, ISPs and cable, satellite, IPTV);
- ‘content’ (newspapers, tv, magazines and radio);
- ‘online media’ (search, social media, online news sources, desktop and mobile browsers as well as desktop and smart phone operating systems).
At the end, I combine these again one last time to complete the analysis and gain a bird’s eye view of the network media economy as whole.
Platform Media
The platform media category consists of the communications infrastructure and carrier segments of the network media economy: i.e. wireline telecommunications, mobile wireless, internet access and cable, satellite and IPTV. The first things that stands out about all sectors of the platform media industries is that they are all highly concentrated or at the high-end of the moderately concentrated scale. Table 1 below illustrates the point. This has long been the case, although with some important exceptions, past and present, as discussed below.
Table 1: CR and HHI Scores for the Platform Media Industries, 1984 – 2016
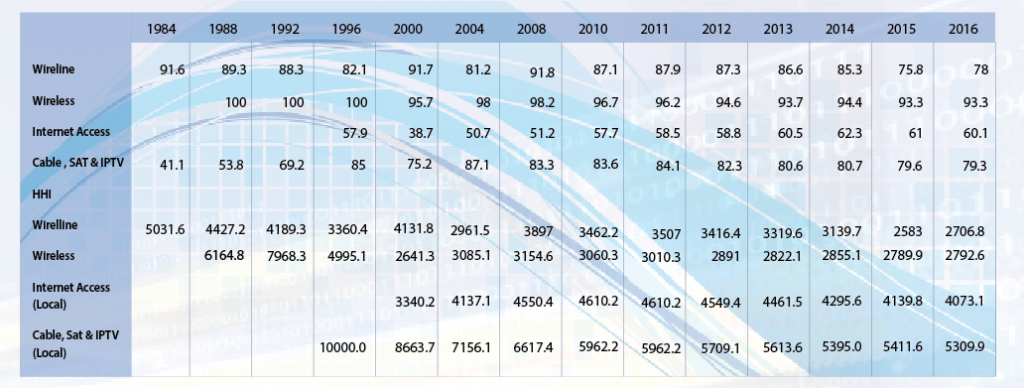
Sources: see the “CR & HHI” sheet in the CMCRP Workbook + individual sheets for each sector.
CR4 and HHI measures for wireline telecoms—which basically consists of “plain old telephone service” (POTS)—scores fell in the late-1990s as the first seeds of competition took root. This was sped along by the introduction of long distance competition in 1992 and local telephone competition five years after that. Concentration in this sector fell greatly between 2000 and 2004 as a result.
However, the collapse of the dot.com bubble wiped out many of the new rivals and the trend reversed course until 2008 or so (CRTC, 2002, p. 21). For the next several years there was a minor increase in competition and concentration levels fell steadily from 92% in 2008 to 85% in 2014 as a result. Concentration levels fell at a greater clip over the past two years and by 2015 they were at their lowest during the period we have examined, with the CR4 at 76% and the HHI just above the “highly concentrated” threshold. This was mostly due to MTS’s sale of Allstream to the US backbone network operator, Zayo, but small increases in market share for Telus, Videotron and Eastlink also played a part. That said, the wireline market remains highly concentrated by both the CR4 and HHI measures.
Mobile Wireless
In recent years, a number of studies have argued “that there is not a competition problem in mobile wireless services in Canada” (see here, here, here).[1] They also claim that, relative to international standards, concentration levels in mobile wireless services in Canada are at the low end of the range, and have fallen in recent years. The Canadian market is actually competitive and becoming more so, they claim.
In 2008, the Conservative government began to use spectrum policy and a series of new rules to more aggressively encourage new entrants to enter the market. Following the 2008 auction of “advanced wireless services” (AWS) spectrum, in which Industry Canada reserved spectrum exclusively for new firms, four “new entrants” joined the field: Wind, Videotron (Quebecor), Public Mobile and Mobilicity. Eastlink, a subsidiary of diversified conglomerate Bragg, won spectrum in the 2008 auction, technically making it a fifth “new entrant,” but for reasons unknown it waited until 2013 to launch service in its home territories in the Maritimes.
As a result of these efforts, levels of concentration in the mobile wireless section have come down, although they still remain firmly within the highly concentrated territory. The top three mobile network operators – i.e. Rogers, Telus and Bell – had a market share of 91.2% in 2016 down from 92.2% the year before and down appreciably from 96% when Harper’s Conservative government began its crusade to introduce a fourth wireless competitor in all areas of the country. Indeed, three of the new entrant mobile network operators—Freedom Mobile (previously Wind), Vidéotron, and Eastlink—have carved out a measure of success for themselves during this period as the pro-competitive policy measures put into place by the previous government gained traction.
In what follows, we present an analysis of recent developments in the mobile wireless market, to better understand these high level trends.
Following the 2008 AWS auction, the initial years were rocky for most of the new entrants. A challenge to Wind’s ownership was mounted by the CRTC in 2008/9 upon petition by Shaw and Telus; the Commission determined that Wind did not meet the foreign ownership criteria, creating uncertainty for the company’s future (Klass, 2015, pp. 74-76). The CRTC’s decision was overturned by the Conservative Cabinet in 2009, with the net effect being a major delay for the young wireless competitor. While this decision was also challenged, the issue became moot with a change to the legislated foreign ownership restrictions in 2012, which amounted to another prong in the Conservatives’ campaign to increase the competitiveness of telecoms markets across the land. By the end of 2016, Wind had approximately 1 million subscribers, a figure which was revealed when Shaw announced plans to acquire the “new entrant” provider. The transaction was completed in early 2016, a development which marks a qualitative shift in the wireless market with what, as we discuss below, are some very important implications.
Other new entrants have not fared well. Public Mobile failed in 2013, and was acquired by Telus. Similarly, Mobilicity was acquired by Rogers in 2015 following nearly two years spent under creditor protection. Over the second half of 2016, Rogers shuttered the Mobilicity brand and moved Mobilicity’s customers over to its Chatr flanker brand.
Videotron, by contrast, has made significant inroads in Quebec. By year end 2016, it had approximately 894,000 mobile subscribers in its operating territory (which, beyond PQ, also includes the National Capital Region). It has also struck network sharing agreements with Rogers in Québec, and in 2014 it purchased licenses for the desirable 700MHz spectrum in BC, Alberta, and Ontario, fuelling speculation that the company was preparing for a national expansion. That speculation was put to rest, however, when Videotron sold those spectrum licences to Freedom Mobile (Shaw) in June of 2017. Despite having forgone the potential to expand into the rest of Canada, Videotron’s market share within its home province of Québec continues to rise, suggesting that it has found a viable place in the wireless business.
At the end of 2016, the combined national marketshare of the remaining new entrants inched upward to just greater than 4%. Include MTS and SaskTel in the group and, combined, the new entrants and smaller regional incumbents accounted for nearly 8% of wireless revenues according to the CMCR Project’s data (see “Wireless” sheet in the CMCRP Workbook) or 9% according to the CRTC (see figure 5.5.6 of CMR 2017).
While the data reflect the success of Wind and Vidéotron, one detail that must not be missed is the fact that both are now part of large communications conglomerates, and as such it may no longer be entirely accurate to consider them “new entrants”, at least not in the same sense as the built-from-the-bottom-up companies that got their start almost ten years ago. Zoom out from a single focus on the wireless market, and we see that all wireless carriers in Canada are now part of diagonally integrated communications companies. Diagonal integration refers to a situation in which firms operate across distinct spheres of related markets (i.e. wireline and wireless broadband). This has important implications for understanding how firms offer services; for instance, as we have documented elsewhere, stand-alone mobile providers tend to offer more generous data buckets than mobile providers that are connected to wireline network operators. In short, expectations of disruptive behaviour from Wind and Vidéotron should be tempered in consideration of the fact that they both now operate as part of larger firms—in both cases regional cable companies–with often competing interests across the network media economy.
Some industry observers have taken the fact that the remaining entrants are now affiliated with vertically integrated regional cable companies as an opportunity to call for the government to end its policy of supporting the new entrants (see here). These voices argue that companies like Videotron and Shaw are not in need of “public subsidies” such as spectrum set-asides. Our analysis of the data suggests otherwise. The entrants’ spectrum holdings are still dwarfed by that of the incumbents; and so too is Freedom and Videotron’s marketshare. Until the entrants are able to provision networks that can truly compete against the incumbent carriers, their disciplinary effect on the incumbent oligopoly is likely to remain marginal. Removing measures designed to promote competition in this sector would, in our view, be premature to say the least. Were the government to reverse its supportive policy now, it would be tantamount to delivering the keys to the kingdom back into the hands of Bell, Rogers, and Telus at a crucial moment in the development of sustainable competition in the Canadian wireless market.
While the incumbents’ market share dropped noticeably between 2008 and 2013, it has remained virtually unchanged in the last three years. Rogers (33%), Telus (29%) and Bell (29%) accounted for 91% of the market by revenue at the end of 2016 (decrease of 1% over the previous year), or 89% when measured by the number of subscribers (see the “Wireless” sheet in the CMCRP Workbook and CWTA subscriber figures).
In 2016, the HHI score for mobile wireless increased to 2858 (from 2790 at the end of 2015). To be certain, this reflects an improvement over the 3000+ scores seen pre-AWS auction, but it is still far above the 2500 threshold that marks a highly concentrated market (see “Wireless” sheet in the CMCRP Workbook). The fact that concentration levels have remained steady highlights the persistence of the incumbent firms’ collective market power, a fact recognized by both the CRTC and the Competition Bureau, as we discuss further below.
Moreover, national measures of concentration understate conditions in specific provinces, regions and cities, but also overstate conditions in others. The least concentrated market in Canada is in Quebec, where Bell (30% share of subscribers), Rogers, (28%), Telus (27%) face challenges not only between themselves but from Videotron as well. Videotron’s share grew to 15% of Quebec subscribers at the end of 2016, according to the CRTC.
Compared to Ontario, Alberta, and BC, the competitive scene in Quebec appears to have resulted in price relief for certain service tiers—a Quebec Fido subscriber, for instance, pays between 40-50% less than an Ontario Fido subscriber would pay for the same high-usage plan(s), according to the provider’s online site—although it is worth noting that entry-level mobile tiers across the provinces just mentioned remain similarly priced. The difference in price can be directly attributed to the presence of a strong regional provider – in Quebec, that’s Videotron – a factor acknowledged to be substantial by the competition Bureau earlier this year.
Eastlink launched its own mobile wireless service in the Maritime Provinces in 2013, and expanded to a handful of towns and cities in Northern Ontario during summer 2016, but it is still too early to see the results—an outcome made all the more difficult by the company’s tight-fisted approach to the public release of information.
In Quebec, the top two wireless companies had a combined subscriber market share of 58% -down 1% from 2015—the lowest in the country by a large margin. The figures were in the 77-79% range in Alberta, Ontario and British Columbia in contrast (no change from last year), and much higher yet in Saskatchewan (81%), New Brunswick (81%), Manitoba (85%), Nova Scotia (87%), PEI (87%) and finally Newfoundland, Labrador and the Far North (97%) (CRTC, 2017).
Analysis of these figures, however, requires a caveat: they do not reflect the impact of Wind or Eastlink, which for unknown reasons has been excluded from the CRTC’s public data on province-level subscriber marketshare (CRTC CMR 2017, Table 5.5.8). Importantly, this makes it impossible to determine the magnitude of the impact Freedom Mobile has had in Alberta, Ontario, and British Columbia, and what effect Eastlink has had in the Atlantic provinces and Northwestern Ontario. Given the heavy emphasis that government policy and bodies such as the CRTC and ISED have placed on promoting entry by a fourth carrier in all regions of the country, it comes as a surprise that detailed data on the performance of two of the three remaining competitors is not made available at the provincial or regional level.
While the figures for national concentration levels have painted a relatively consistent story over the previous several years, province-level statistics tend to vary more. Overall trends tend to indicate competition between two dominant firms, varying by province, with rivalry from a weaker third and sometimes fourth carrier filling out the market. Where the dominant firms are national carriers (i.e. Rogers, Bell, and/or Telus), prices tend to be higher and data allotments lower than in provinces where the dominant carrier is provincial. An example of this can be found by examining the mobile wireless markets in Manitoba and Saskatchewan. Although Sasktel and MTS were the two most dominant wireless providers by provincial market share at the end of 2016, the competitive situation in the prairies evinces lower prices and a greater degree of choice amongst service offerings than found elsewhere in Canada, not just from the ILECs but from the competing national carriers as well.
For instance, both Sasktel and MTS offer mobile plans that include unlimited voice calling and unlimited mobile broadband usage on their province-wide networks, whereas ‘unlimited data’ is not to be found elsewhere in Canada, save within Wind Mobile’s footprint, which is largely limited to urban areas. Additionally, the national carriers have responded by offering prairie customers plans that feature much larger data buckets than those available at similar price points in other provinces (i.e. deep discounts), as Peter Nowak recently observed. Although CR4 scores are broadly similar across provinces, and HHI scores all fall within the “highly concentrated” range, competitive dynamics nevertheless differ from place to place, and understanding the facts behind the figures often benefits from this kind of analysis.
These differences will likely be coming to an end for Manitobans, however, as Bell completed its takeover of MTS in early 2017. Although Bell has committed not to raise wireless prices in Manitoba for 12 months following the merger, the resulting reduction in competition is likely to have predictable results, bringing Manitoba into line with other less competitive provinces, as we argued in a report submitted to the Competition Bureau (and in an oral presentation) as it reviewed the merger. This merger, aside from reversing the trend toward more competition in the Canadian wireless sphere, may have effects beyond the Manitoba marketplace: following the takeover, it has been reported that the Saskatchewan government is deliberating over the potential privatization and sale of its public telco, Sasktel. So, although competition from new entrants appears to be slowly taking root in some parts of the country, its progressive effects should not be overstated, and in some parts of the country, efforts to increase or maintain competitiveness for the benefit of Canadian citizens and consumers have faced substantial setbacks.
The limits to competition are also illustrated by the fact that two of the new entrants have failed: Public Mobile and Mobilicity. Public Mobile was acquired by Telus in 2013 and shut-down the next year. Mobilicity was taken over by Rogers last year and then dismantled in a complex series of spectrum exchanges, much to Wind’s—and ultimately Shaw’s—benefit, which picked up additional spectrum at set-aside prices in Manitoba before selling it on to MTS.
The demise of Public Mobile and Mobilicity have largely redounded to the benefit of Wind and Videotron, which together saw their share of the ‘national mobile wireless market’ rise to 4%. Whatever gains have been had in the past few years are still far off the high-water mark of the late 1990s when two new rivals, Clearnet and Microcell, garnered 13% of the market between themselves before being taken over by Telus and Rogers in 2000 and 2004, respectively. Plus ça change, plus c’est la meme chose, as Daniel Paré has observed.
The stubborn resilience of the national incumbents, and the steep uphill slog facing entrants to the wireless market, have not escaped the notice of federal policymakers and regulators. Beyond efforts by ISED/Industry Canada to use spectrum licencing to induce new entry into the market, there has been growing recognition that a firm, active hand is required from the government to ensure that wireless markets are delivering the goods to the population, regardless of where people live or how much they earn. Most notably, this recognition has led the CRTC to establish a framework to regulate the wholesale roaming rates national carriers charge to smaller competitors.
The CRTC was forthright in the 2015 Regulatory Framework for Wholesale Mobile Wireless Services decision in summing up what all this means for today:
- there has been very little change in retail market shares (either by revenue or by number of subscribers) in Canada in the past five years, despite entry into the market by several wireless carriers (para 35);
- the barriers to entry into the retail market are very high and the likelihood of new entry in the short to medium term is low (para 72);
- Rogers, Bell and Telus collectively possess market power in the national market for GSM-based wholesale roaming (para 74);
- Bell, Rogers and Telus “collectively possess market power in the national market for GSM-based wholesale MVNO access” (para 88); and
- “there is no rivalrous behaviour between the national wireless carriers in the provision of GSM-based wholesale MVNO access at a national level” (para 86).
The CRTC’s Wireless Framework decision highlights another interesting characteristic of the Canadian wireless market: the total lack of mobile virtual network operators, or MVNOs. As demonstrated by the CMCR Project’s 2014 report, Mobile Wireless in Canada: Recognizing the Problems and Approaching Solutions, MVNOs play an important role in wireless markets around the world, both from an economic and from a policy perspective. Recognizing this, many regulators have taken steps to foster open access to wireless networks in order to spur competition from MVNOs.
In its 2015 decision, the CRTC determined that the national facilities-based wireless carriers had market power over third-party access to their networks, and had denied service to would-be competitors. While it took steps to encourage the entry of MVNOs, it stopped short of mandating access to the national carriers’ networks. In the absence of such a mandate, however, it is unlikely that third party service providers will emerge to provide market discipline similar to the way companies like Teksavvy, Distributel, and Primus have done under the mandated access regime that applies to Canada’s wired broadband networks.
Several challenges were mounted to the CRTC’s decision not to mandate MVNO access to the national carriers’ networks. In August 2015, the Canadian Network Operators’ Consortium, a trade group representing wholesale ISPs, filed an application requesting that the CRTC review and vary its decision, and require national carriers to allow independent MVNO access to their networks. The CRTC subsequently denied that application, although the issue has not been put to rest. In early 2015, Ice Wireless, a small mobile provider serving Northern areas of Canada, began to use its wholesale roaming agreement with Rogers to operate an MVNO called Sugar Mobile throughout Canada. The issue came to the CRTC when Rogers requested to terminate its agreement with Ice. Similar to the case with CNOC, the CRTC spurned Ice’s efforts to enter the national market in March 2017 (also see here). Despite these setbacks, as new entrants have failed or been consolidated, consumers and competitors continue to look toward MVNOs as a viable and attractive alternative to the status quo. Indeed, in June, ISED Minister Navdeep Bains ordered the CRTC to review its decision not to mandate MVNO access to the incumbents’ networks for Wi-Fi based service providers like Ice’s Sugar Mobile brand. While the CRTC’s review process is still ongoing at present, one thing that is clear is that many find the status quo in wireless competition untenable, and new policy approaches must be (and do continue to be) explored in order to attain affordable universal service for 21st century communications media.
In sum, no matter how one looks at it, by city, region, province, or country, or by revenue, subscribers, or spectrum held and used, mobile wireless services are highly concentrated. While the prevailing CR and HHI levels in Canada are not especially high by international standards, the more pressing point is that concentration levels in mobile wireless markets around the world are, with few exceptions, “astonishingly high” (see Noam, 2016, p. 25 and especially chapter 38, pp. 1307-1316). Given this, the real question is what, if anything, will be done about this state of affairs? The CRTC’s recent actions have begun to address that question.
Internet Access
As the telecoms and Internet boom gathered steam in the late 1990s new players emerged and became significant competitors. Indeed, by 1996, the incumbent telephone and cable companies’ share of the internet access market was minimal while four relative newcomers accounted for over a third of the market: AOL (12.1%), Istar, (7.2%), Hook-Up (6.3%) and Internet Direct (6.2%). As a general observation, incumbents were slow to arrive and in the meantime new players stepped into the breach to develop internet access in Canada.
The early ‘competitive ISP era’ continued up to the turn-of-the-century but subsided thereafter on account of, first, the collapse of the dot.com bubble, when many of the early ISPs went out of business and/or were absorbed by larger players, and second, the switch-over from dial-up to high speed internet access. By 2000, the big four’s (Bell, Shaw, Rogers & Telus) share of the internet access market had risen greatly but it was still a very modest 39% compared to where things have gone since. Nonetheless, at the time, internet access was still one of the most competitive sectors of the network media economy at the time.
At the national level, the industry has steadily consolidated around the incumbent telephone and cable companies ever since. By 2004, the top four firms accounted for roughly half of all revenues. That figure rose steadily over the next decade, to the point where the top four firms have accounted for around 60% of the market, which is exactly where things stood last year. The top five companies—Bell Rogers, Shaw, Telus and Videotron—accounted for 70% of all revenues in 2016, by our measure, or 73% of the retail internet access market, according to the CRTC’s figures (p. 254). The HHI score for internet access more or less doubled from the low level of 536 in 2000 to around 1,100 in the first decade of the 21st century, where they’ve hovered ever since.
Examining things at the national level, as we have done for years, is helpful insofar that it allows us to see changes over time and to make international comparisons. However, looking at things from the vantage point of the national level washes out what retail internet access services look like on the ground in cities across the country. The effect of a national focus is to greatly exaggerate the extent of competition because it assumes—wrongly—that Telus, for example, competes not only against Shaw in British Columbia and Alberta (for the most part) but with Bell, Rogers, Videotron, Eastlink, and so on across the country. In reality, however, this is not the case.[2]
This year we have decided to take a much closer look at conditions on the ground. Table 2 below does so by showing the share of incumbent cable and telephone companies’ as well as independent ISPs’ share of the retail internet access market, respectively, in order to get a more precise proxy for competition at the local level. As it shows, 88% of the residential retail internet access market was accounted for by the incumbent telephone and cable companies last year based on revenue and 87% based on subscribers (CRTC CMR, Tables 5.3.2 and 5.3.4). Based on these measures, the retail internet access market is extremely concentrated, with an HHI score of 4073. This is far above the threshold for highly concentrated markets and significantly above the levels found for mobile wireless services, for example.
Table 2: Residential Internet Access Services by Type of ISP: Market Share, CR4 and HHI Scores based on Revenue
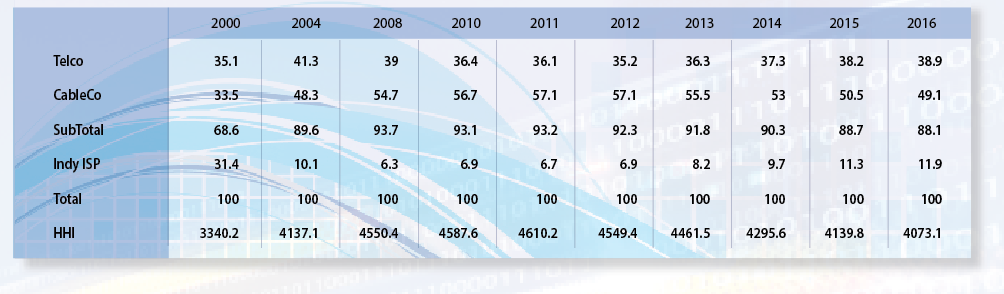
Source: CRTC (2017) Communication Monitoring Report (Table 5.3.2 Residential Internet access service revenues by type of service provider); also see the “ISP” sheet in the CMCRP Workbook)
Table 2 also shows that for the incumbent cable and telephone company operators have dominated the retail internet access market for years albeit with some significant changes over time. Take, for instance, the outset of the period covered in the early 2000s and during the heady days of the dot.com boom when independent ISPs accounted for nearly a third of the market by revenue, and the HHI score was at its lowest point in the time span addressed here.
For most of the next decade, however, the fortunes of independent ISPs waned and their market share plummeted from nearly a third based on revenue (37% based on subscribers) in 2000 to just under 6% in 2007 (or 8% by subscribers). The incumbents consolidated their gains as a result, with the lion’s share of those gains going to the cable operators. This, however, has been shifting once again in the past few years as the cable companies’ share of the retail internet access market has slid due to, both, mounting rivalry from the telephone companies as they roll out fibre-to-the-doorstep but also to indy ISPs.
Throughout this period, the number of independent ISPs across the country has stayed steady over time at around 500. In the last decade, their earlier period of decline appears to have turned around. In fact, since 2007, independent ISPs’ market share based on revenue doubled, while their share of subscribers rose from 7.8 to 12.6%. Altogether, they accounted for 12% of retail internet access revenues in 2016. The two biggest indy ISPs—TekSavvy (282,500 subscribers) and ExplorNet (275,000)—combined accounted for estimated 3.2% of revenues last year (see “ISP” sheet in the CMCRP Workbook).
While the independent ISP’s share of the retail internet access market has crawled upwards over time (CRTC CMR, Tables 5.3.2 and 5.3.3), the scale of concentration at the local level has still stayed stubbornly high. Broaden the measure to include wholesale and retail internet access markets, and the incumbent telephone and cable companies account for four-fifths of the market by revenue: e.g. Bell (22.2%), Rogers (14.7%), Shaw (12.7%), Telus (10.6%), Videotron (9.6%), Cogeco (4.7%), Eastlink (2.1%), SaskTel (1.8%) and MTS (1.5%).
In short, when assessed at the local level, rather than on the basis of national HHI scores, the incumbent telephone and cable companies’ dominance of retail internet access markets is brought into sharper relief. A similar effect emerges by examining their share of the combined retail and wholesale internet access markets. All-in-all, the national HHI figure implies a highly competitive market, while a closer inspection reveals quite the opposite, with internet access in cities across Canada generally being highly concentrated, with some exceptions in wealthy and densely populated urban areas.
Such observations underpinned the CRTC’s decision in early 2015 that found that the indy ISPs will still need regulated wholesale access to the incumbents’ local Fibre-to-the-Premise networks if they are not to be left to wither on the vine as broadband internet access migrates from copper and coaxial cables to fibre-to-the-doorstep. The Commission’s decision did not mince words in this respect:
- “incumbent carriers continu[e] to dominate the retail Internet access services market” (para 125);
- “there is limited rivalrous behaviour to constrain upstream market power” (para 122);
- wireless Internet access is not an acceptable substitute for wireline facilities because of significant disparities in terms of price, speed, capacity and quality (para 126);
- whatever “competition that does exist today is . . . a result of regulatory intervention” (para 126).
This was much the same reasoning that underpinned the Commission’s wholesale mobile wireless decision earlier that year. In both cases, having found that concentration was not a matter of conjecture but of fact, the regulator decided to act, in the case just discussed to help ensure that whatever minimal competition that does exist today is not washed away tomorrow by the transition to fibre-based internet access. While Bell petitioned that decision, its appeal was ultimately rejected by the Liberal Government in May 2016.
Cable, Satellite and IPTV
There is no doubt that competition between cable companies and the telcos has intensified. Prior to the advent of IPTV services in 2004, consolidation in the BDU market at the national level had been rising for two decades, with a brief interruption after satellite TV services were introduced in the late 1990s. The introduction of satellite TV started to chip away at local cable monopolies across the country and, nationally, the BDU market began to show the impact. The top four BDUs’ share of the market fell to 75% in 2000 from 85% four years earlier and the HHI had fallen to 1729, down from 2314 in 1996. Thereafter, however, concentration levels at the national level began to soar again. By 2004, the top four BDUs—Shaw, Rogers, Bell and Videotron—share of the market had reached an all-time high of 87%.
We can also zoom in to get a closer look at how things appear on the ground by using the cable and telephone companies’ broadcasting distribution undertakings, respectively, as a more precise proxy for competition at the local level (similar to what we just did with respect to internet access). When we do this, until 1996 and the introduction of Bell’s direct-to-home satellite TV service, cable TV was a monopoly. By 2000, however, Bell had gained a 7.2% market share and the HHI began to fall from its outer limits (10,000) to 8,664. That is still an extremely high number, but focusing on this way of seeing things helps us to better see the monopoly on cable TV services being slowly chipped away and replaced by, for all intents and purposes, a duopoly. In other words, the long-run account of cable TV is the replacement of monopoly by duopoly at the local level, with intensifying competition between the cable companies and the telephone companies, first with the introduction of satellite TV in the late 1990s and, then, the advent of the telephone companies internet protocol TV services (IPTV).
The development of the telephone companies’ IPTV services since the mid-2000s put the brakes on the upward drift of concentration that had been visible over the prior decade at the national level, More importantly, monopoly cable services at the local level increasingly had to face competition from the telephone companies’ IPTV services, although it was not until after 2010 that this force began to really gather steam. MTS and SaskTel were the first to roll out IPTV services in 2004, followed by Telus in 2007/2008. Bell was particularly slow on the uptake, but finally followed suit in 2009/2010 when it first began to introduce IPTV services in the Atlantic provinces through its affiliate Bell Aliant and finally into its heartland operating territories in Quebec and Ontario in 2010/2011.
As the telephone companies’ IPTV services have gained traction, the HHI score for this sector has dropped significantly, both at the national level and the local level. In 2004, the national HHI was 2206, but by last year it had dropped to 1823—a sizable drop, to be sure, but still within the moderately concentrated part of the scale. Yet, that measure greatly exaggerates the extent of competition because, like retail internet access services, cable TV markets are local and regional, not national. When we consider things from this vantage point, it is clear that concentration levels in the cable TV market have steadily drifted downward. That said, they are still sky high. In 2004, the HHI for BDU services was 7,156—nearly three times the threshold used to designate a market to be “highly concentrated”. By last year, the HHI had fallen considerably to 5,310 and traditional cable companies’ market share had been cut down to 62.4% while the telephone companies’ share had swelled to 37.6%.
Of course, this is a significant change, and one can understand why cable companies have groused about the increasingly intense competition that they have had to meet, while Bell, Telus, MTS and SaskTel have been able to—correctly—trumpet their successes in an ever more contentious market. These divergent perceptions on both side of the industry come back together, however, around the looming threat of “cord cutting”. As a matter of fact, the number of households that subscribe to a BDU service (i.e. cable, satellite or IPTV) did slide from its high point of 85.6% in 2011 to 79% last year. Thus, the idea of “cord cutting” is real. However, it is also much exaggerated. The scale and pace of cord cutting has been lower and slower than many seem to believe and most of the losses to cable and direct-to-home satellite TV providers have redounded to the benefit of Telus, Sasktel, MTS and Bell’s IPTV services. Indeed, this is a key element in the growing duopolistic competition that does exist and ought to be given greater pride of place in accounts of these developments rather than lost amidst so much hand-wringing about cord-cutting that takes place in public and policy discussions about these matters. It is also essential to bear in mind that revenue for the sector grew by leaps and bounds over the first dozen years of the 21st Century but that pace slowed after 2013 and fell slightly in each of the past two years, as our previous report addresses in some detail.
Lastly, it also essential to note that the cable operators and telephone companies have been working hard to offset whatever losses they do experience with quickly rising rate hikes on both BDU and broadband internet services. We showed this in the last report, but it is worth repeating here that prices for both communications services—and which many people see as essential to their lives—are rising much faster than the consumer price index. Figure 7 shows the point. Indeed, as it shows, it is exactly at the point that cable subscriber numbers begin to fall that broadband internet prices take a sharp turn upwards.
Figure 7: The Price of Communication Services and Devices vs the Consumer Price Index, 2002-2016
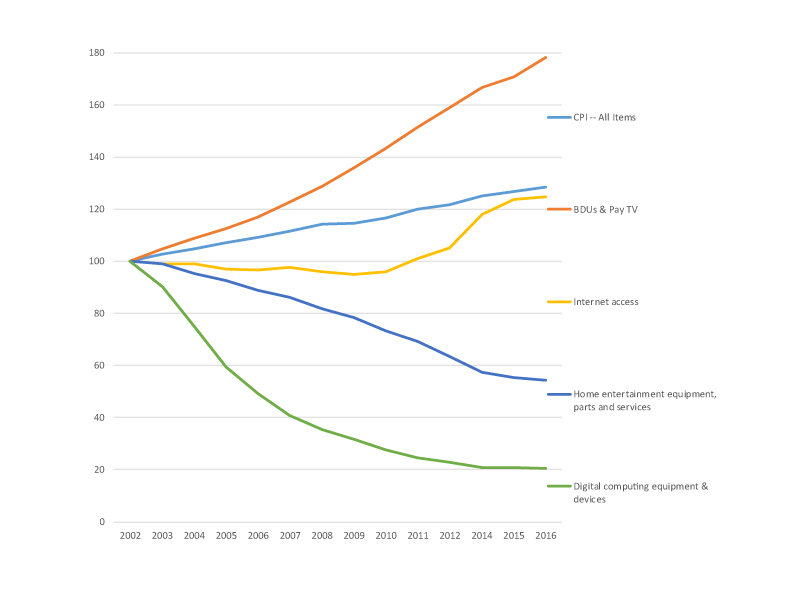
Source: Statistics Canada. Table 326-0020 – Consumer Price Index, annual (2002=100)
At the end of the day, two things are true that sometimes seem impossible to hold together at the same time: first, there is indeed more competition taking place within the cable TV market but, second, this market is still a very tight duopoly, and at the very high end of the scale in terms of concentration. Indeed, concentration is even higher in this domain than what one finds in the retail internet access and mobile wireless markets. This is why policy measures aimed at reining in prices, unbundling bloated cable packages for consumers, and encouraging wholesale access to broadband internet infrastructure (i.e. fibre-to-the-home) as a potential alternative that new BDUs like VMedia can develop on to increase the scale and intensity of competition in this market have been forthcoming. In short, such steps have understood that this market is extremely concentrated and taken very measured steps in response (see the “CableSatIPTV” and IPTV sheets in the CMCRP Workbook).
As noted in the last report, by the end of 2016, 18% of Canadian households got their television service from the local telephone company’s IPTV service: Bell, Telus, Sasktel, MTS, etc. These companies’ Internet Protocol TV (IPTV) services have grown swiftly and by last year they had 2,510,491 subscribers and revenues of $1.86 billion. By the end of 2016, their IPTV services had garnered just over a fifth of the TV distribution market by revenue (21%) and nearly a quarter based on subscribers (24%). Add Bell’s satellite TV into the picture, and the number rises to 37.6%. Again the message is clear: the quick pace of IPTV growth over the past half-decade has intensified competition between the telephone and cable companies’ TV distribution services, but this market is still a duopoly and very highly concentrated, with an HHI of 5,310—nearly double the threshold for a highly concentrated industry by this standard.
Table 3, below, illustrates the steady demise of monopoly cable TV and the rise of duopolistic competition between cable companies and telephone companies since 1996.[1]
Table 3: The Decline of Monopoly Cable TV: Cable Companies vs Telephone Companies, 1996-2016.
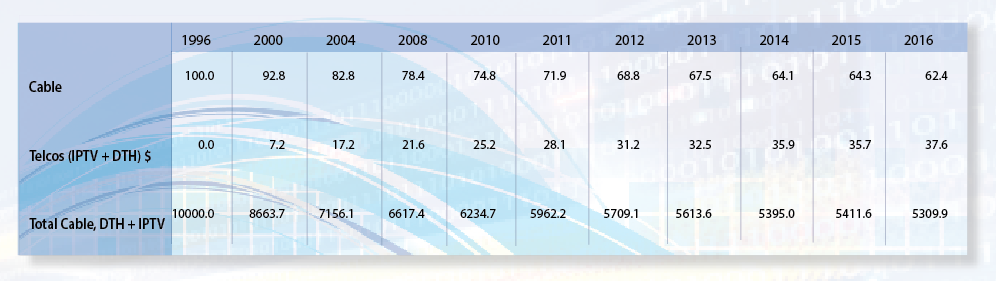
Source: See the “CableSatIPTV” and “IPTV” sheets in the CMCRP Workbook).
Using the cable company and telephone company’s respective shares of the BDU market as a proxy for local competition, Table 3 illustrates the long-term decline of the cable TV monopoly over the last twenty years. And as it also shows, by 2016, the market had been split between the two groups of companies, with just under two-thirds going to the cable companies and a third to the telephone companies. Lift our head above local conditions again, however, to scan the national horizon, and the “big four” vertically-integrated BDUs control four-fifths of the market between them: Bell (26.8%), Shaw (22.8%), Rogers (17.9%), and Quebecor (11.7%). Add the next five largest players—i.e. Telus (8.6%), Cogeco (6%), Eastlink (3.4%), SaskTel (1.1%) and MTS (1.1%)—and almost all the market is accounted for.
And one final word on this to bring these specific developments into the context of the bigger trends across the network media economy that we have reviewed thus far. When we do this the thing that stands out is that concentration levels across all three of the main “platform media industries”—i.e. mobile wireless, retail internet access and cable TV–are remarkably high. They have also risen sharply across the telecom and broadcasting landscape over the past half-decade as well. Whereas the “big five”—Bell, Rogers, Telus, Shaw and Quebecor—accounted for two-thirds of all telecoms and broadcasting revenue in 2010, that figure had grown to 80% by the end of last year. In sum, competition is growing in television distribution, but within the context of greater concentration across the platform media and the vertically-integrated telecommunications and broadcasting sectors.
The Content Media Industries
Television
From the late 1980s until 1996, concentration in broadcast television fell sharply. The rise of specialty and pay TV channels magnified the trend. The television landscape became more diverse as a result. It was a major shift from an environment of relative scarcity to one of relative abundance.
These trends in concentration levels reversed abruptly in the late-1990s, however, albeit with something of a lag before the specialty and pay TV market began to follow suit. After the turn-of-the-century, concentration levels climbed steadily. The upswing has been especially sharp since 2008. Figure 8, below, shows the trend for each of the content media industries on the basis of CR scores while Figure 9 after it does the same in terms of the HHI.
Figure 8 CR Scores for the Content Media Industries, 1984-2016
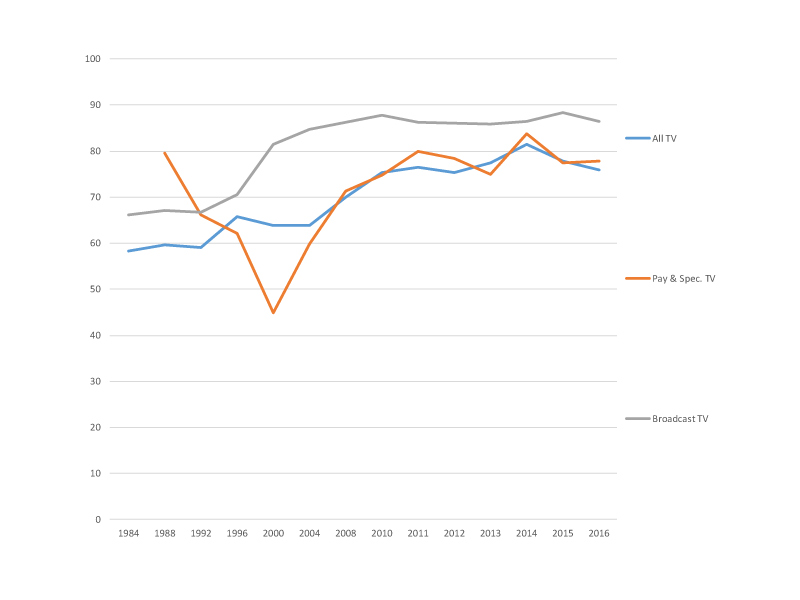
Sources: see the “CR & HHI” as well as individual sector sheets in the CMCRP Workbook.
Figure 9: HHI Scores for the Content Media Industries, 1984-2016
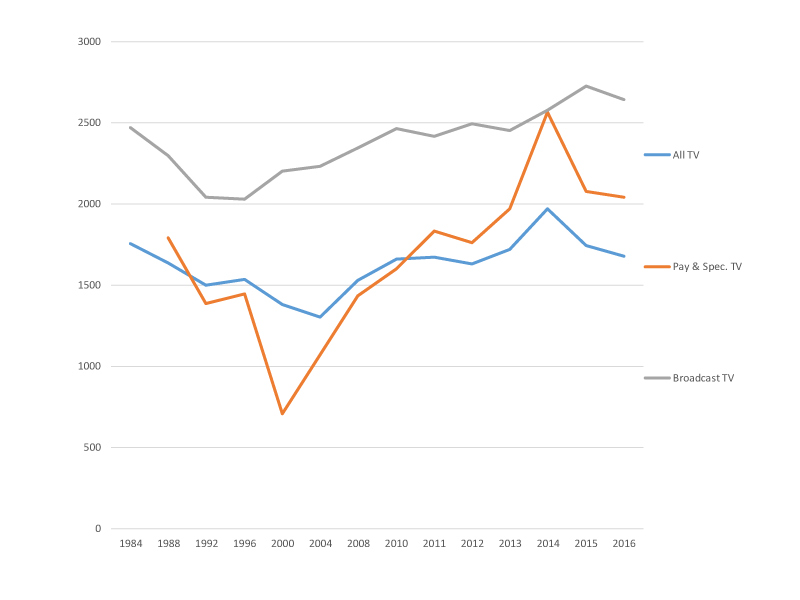
Sources: see the “CR & HHI” as well as individual sector sheets in the CMCRP Workbook.
During the first half-decade of the 21st century, the “big four” accounted for 63% of the TV content business at a time when a handful of mid-range players such as Alliance Atlantis and CHUM had carved out a significant place for themselves in the TV marketplace (circa 2000-2006), before being absorbed by the industry’s largest players. By 2008, the “big four” accounted for 70% of revenue. The four largest television groups—Bell, Shaw, CBC and Rogers—control of all television revenues reached its highpoint of 81.5% in 2014. Add Quebecor into the mix, and the number was 87% at the time.
However, including the rapidly growing internet streaming TV in this category to reflect how media consumption habits have changed in recent years reveals a different trend. Accounting for this development and the spin-off of several TV services from Bell and Shaw in the past two years, and the share of the “big four” fell significantly to 74.7% in 2016. Indeed, Netflix has become the fifth largest TV service in Canada since 2015—just ahead of Quebecor—with 6.4% of total TV revenue and based on its rapid growth. It had an estimated 5.3 million subscribers at the end of last year and revenues of $534.1 million. Add Netflix to the total, and the “big five” account for over four-fifths of all TV revenues. Netflix assumed this spot after surpassing Quebecor in terms of total TV revenue in 2015, with the gap widening with each passing year (see the “CR & HHI” sheet and the specific sheets for each segment of the TV marketplace and the Television Services Ownership sheet in the CMCRP workbook).[1]
Prior to the arrival of internet streaming TV services as a significant part of the TV landscape, the upsurge in concentration levels in the television market between 2008 and 2014 was mainly due to four key transactions. The upshot of each was two-fold: first, consolidation in the TV market (horizontal integration) and, second, consolidation between telecoms operators and TV services (vertical integration).
The first major transaction to transform the landscape along these lines was Shaw’s take-over of Canwest’s TV holdings in 2010. The second was Bell’s buy-back of CTV a year later. Given CTV’s status as the largest television company in the country, the deal pushed concentration levels up greatly. The third moment occurred when Bell and Rogers each took a 37.5% stake in Maple Leaf Sports Entertainment (i.e. NBA TV, Leaf TV and Gol TV) in 2012 (with Toronto Construction magnate Lawrence Tanenbaum’s Kilmer Sports holding the rest) (CRTC, 2012; Bell 2013 Annual Report, p. 133).
The fourth step took place with Bell’s take-over of Astral Media in 2013 after the CRTC reversed course from a year earlier when it had curtly dismissed the deal. The increase in concentration was significant, even though Bell divested itself of eleven TV channels, as required by the Competition Bureau and the CRTC: Teletoon (TELETOON Retro/TÉLÉTOON Rétro, TELETOON / TÉLÉTOON, Cartoon Network), Historia and Séries+ to Corus (Shaw), the Family Channel, Disney Jr. and Disney XD to children’s television programmer, DHX media, and MusiquePlus and MusiMax to V Media.
The CTV, MLSE and Astral transactions marked Bell’s return to the field of television after having abandoned its earlier ill-fated convergence fling in the ownership of CTV and The Globe and Mail (circa 2000-2006)(a phase in its history that is curiously missing from the company’s annual reports). These transactions put Bell at the top of the league.
Concentration levels are high in broadcast television as well as pay and specialty channels. In broadcast TV, the “big five”—CBC (41.8%), Bell (24.9%), Shaw (Corus) (12.9%), Quebecor (TVA) (7.3%) and Rogers (6.9%)—had a combined market share of 93.7%. The HHI is at the very high end of the scale: 2642. The longer-term trend has generally been small fluctuations at the high end of the scale on both of these measures
Specialty and pay services have been the jewel in the TV crown. As each of the four major transactions briefly introduced above took hold, the CR4 and HHI standards shot upwards from the “moderately concentrated” zone into the “highly concentrated” zone. Concentration reached its highpoint in 2014 when Bell (41%), Corus (Shaw) (26.4%), Rogers (12.2%), the CBC (4.1%) and Quebecor (3.9%)—collectively accounted for 87.5% of specialty and pay TV revenue—which was up substantially from the 79.5% share held by the five biggest pay TV ownership groups in 2010. Bell and Shaw broke ahead of the pack to stand in a league of their own with 130 TV services and two-thirds of the pay and specialty TV market based on revenue.
In the past two years, however, trends have run in the opposite direction. The CR4 for the pay and specialty TV market has fallen from 83.7% to 77.9% while the HHI score dropped from 2563 (“highly concentrated”) to 2042—a figure that is solidly in the “moderately concentrated” zone. Bell and Corus (Shaw) have also seen a significant drop in their market shares. Bell’s share of pay and specialty TV services fell from 41% in 2014 to 35.5% last year, while for Corus (Shaw), its share of the market fell from 26.4% to 21.5% over the same period. At the same time Rogers’ market share ticked upwards to 16.9% last year from 13.7% three years earlier, while Quebecor and the CBC stayed relatively steady.
Bell and Corus (Shaw) still stand apart from the rest of the group insofar that, combined, they account for 57% of the pay TV market—even though, as noted above, that is well down from their two-thirds marketshare at the highpoint in 2014. Altogether, Bell and Corus (Shaw)’s share of the “total TV market” in Canada has slipped from just under one-half of the total (49.3%) in 2014 to roughly 45% last year.
Add the next three largest companies and the top five possessed 204 of the 689 TV services licensed to operate in Canada: Bell (64 conventional, specialty and pay TV channels), Shaw (66), CBC (32), Rogers (26) and Quebecor (17). They also accounted for 81% of total TV revenues (including internet streaming services)—a big number indeed but down appreciably from just three years earlier when it was 86.7%. The HHI score has followed suit, dropping from a level that was firmly in the “moderately concentrated” zone in 2014 (1965.7) to a level last year that comes closer to the boundaries of a diverse and competitive market as defined by the HHI’s thresholds (1676.4). For a depiction of who owns what, see the CMCR Project’s graphic, Canada’s Top Media, Internet and Telecoms Companies by Market Share
In short, after concentration across the total TV market had been pushed to new extremes during the half-decade long bout of consolidation between 2010 and 2014, the tide seems to have turned in the past two years. Why? The first reason, of course, is due to the rapid rise of Netflix. In 2016, its share of total TV revenue in Canada surpassed that of Quebecor and reached 6.4% (or $534.1 million)—more than double what it had been just three years earlier. This adds a significant new sector and several new players—most importantly, Netflix—to the scene. Add Bell’s CraveTV and Rogers and Shaw’s jointly owned shomi service before it was shut down in late 2016, and internet streaming TV services have added modestly to the size of the TV marketplace and significantly to its complexity, with Netflix’s presence serving to drive down concentration levels.
The second significant factor is that the series of spin-offs, closures and divestitures from Bell and Shaw have redounded to the benefit of the smaller players that picked them up. Perhaps the biggest beneficiary of these developments has been DHX—the Halifax based broadcaster and noteworthy creator of children’s television programming (Caillou, Inspector Gadget, The Next Step, Degrassi: Next Class and Teletubbies). In 2014, it acquired a suite of children and family-oriented TV services that Bell had been required to spin off as a condition of its merger with Astral, including the popular Disney XD and English and French-language versions of Disney Junior as well as the Family Channel (CRTC, 2014). As a result, DHX’s share of the TV landscape has grown greatly from basically zero before 2013 to over 2.5% last year.
As part of the same process, Bell also sold MuchVibe, MuchLoud, MuchRetro and Juicebox to another independent TV operator, Stingray in 2014 (see here). Bell and Rogers also shut down their jointly owned Viewers’ Choice near the end of 2014. All of these transactions have modestly reduced Bell’s share of the TV marketplace in the past three years—although it still stands in a league of its own with a nearly 30% market share—which is still leaps and bounds higher than that of the CBC (17.1%), Corus (Shaw) (16.4%), Rogers (11.8%) or Quebecor (4.8%).
In addition to DHX and Stingray, there are several other players that round out the TV landscape. Some of them have been around for years while a few others have arrived recently: e.g. V Interactions, APTN, Pemorex (the Weather Network), Radio Nord, Fairchild (Chinavision), Blue Ant, CHCH, CHEK, Channel Zero, etc. While no doubt important sources of diversity and consumer choice, their impact has been modest and their future is uncertain—especially those that rely on advertising as their main base of revenue, for all the reasons set out in the first report in this series. Collectively, the smaller TV players account for less than six percent of total television revenue. To put this another way, their market share combined is lower than that of Astral Media—the last large independent broadcaster—on the eve of its take-over by BCE in 2013.
Radio
Radio is amongst the most diverse media sectors. The shuffling of several radio stations between Shaw (Corus) and Cogeco in 2011 helped bring about a long-term decline in concentration. The presence of several mid-size radio station groups has also added to the relatively high diversity of radio station ownership: e.g. NewCap, Patttison, Rawlco, Maritime Broadcast, Golden West, etc.
The downward drift of recent years, however, was reversed in 2013 when Bell acquired Astral Media, then Canada’s largest radio broadcaster. The deal catapulted Bell into the being the biggest radio broadcaster in the country by adding 77 radio stations to the existing ones it already had. This gave Bell 107 radio stations in 55 cities across Canada. Bell’s 21.6% market share in 2016 was substantially larger than the CBC’s share (15.8%) and far greater than that of closest commercial peer, Rogers (12%).
Bell’s acquisition of Astral has led to a significant increase in CR4 and HHI scores, and reversed the downward trend of the previous half decade. Even with this significant uptick, however, the radio sector was only modestly concentrated by CR4 standards in 2016 and for the past few years, with a score of 58%. It is firmly within the competitive zone by the lights of the HHI, with a score of 1048 in 2016 and similar levels for the past few years.
Bell’s divestiture of ten radio stations in medium to large size cities across the country at the end of 2013 and into 2014 helped offset the effects of consolidation. The effect of this sell-off has also be to strengthen some of the mid-size radio station ownership groups that acquired them: Newcap, Pattison and Corus (Shaw) (see the “Radio” sheet in the CMCRP Workbook).
Newspapers
With some twists and turns along the way, concentration in the newspaper industry rose steadily from 1984 until 2000, then fell significantly for the next ten years before rising again. In 1984, the biggest four groups accounted for 64% of the industry’s revenues, a number that rose slowly but steadily over the intervening years to roughly two-thirds of the market in 1996 and then more sharply upwards until 2011.
By 2011, the four largest newspaper ownership groups accounted for 81.6% of the market: Postmedia (23.7%), Torstar (22.7%), Quebecor (23.7%) and Power Corp / Gesca Media (11.5%) (see the “Newspaper” sheet in the CMCRP Workbook). Levels have declined since. By 2016, the CR4 had fallen to 68.3% and the HHI from 1939 to 1608—at the lower end of the ‘moderately concentrated’ range of the HHI standards. These new conditions likely reflect Postmedia’s decision to sell some of its newspapers (e.g. Victoria Times Colonist) and to cut publishing schedules at others.
Postmedia’s market share fell steeply from 24% in 2010 to 19% four years later but shot up again in 2015 and 2016 after its acquisition of Quebecor’s Sun newspaper chain (6 major dailies, 27 small dailies and 140 community weeklies). By 2016, Postmedia alone had just under thirty percent of the Canadian newspaper market, although its position is akin to being king in a crumbling castle (the Competition Bureau approved the transaction in early 2015). Concentration levels by the standards of the HHI had been hovering in the 1800-1950 range from 2010 until 2013, but have since fallen appreciably. The HHI score for newspapers last year was 1608—a figure that is at the lower end of the moderately concentrated zone.
A few new publishers have emerged by picking up some of the smaller dailies hived off from the larger chains and generally amidst the tough times facing the newspaper industry, notably Black Publishing and Glacier Publishing in western Canada. Moreover, several new internet news sources have also emerged, such as iPolitics, the National Observer, Canadaland, Blacklock’s Reporter, the Tyee, Huffington Post, Buzzfeed, Vice, AllNovaScotia, Policy Options, etc., but as we also noted in the first report in this series, none of them show up in the top 60 online news sources in Canada and they still account for only a tiny portion of internet news traffic (see pp. 45-47). In other words, they serve small and highly specialized audiences (also see below).
Magazines
Of all media sectors, magazines are the least concentrated. Concentration levels fell by nearly half on the basis of CR scores between the early 1990s and 2016, and more than seven-fold ten by the lights of the HHI criteria since 1988 (see the “Magazine” sheet in the CMCRP Workbook). The CR4 was 31, and the HHI at the extremely low level of 319. That said, however, even the best available data for this sector is terrible and needs to be treated with caution.
Core Elements of the Internet
The internet has long been held up as an antidote to ownership concentration in the “old media”. Yet, as the earlier discussion of internet access showed, there is little reason to believe that core elements of the Internet are immune to such forces. In fact, there may even be some good reasons to think that the opposite just might be the case.
The discussion below examines the evidence in relation to several core elements of the internet ecology: internet advertising, search engines, browsers, operating systems and online news sites. It starts with a critical area that is remarkably unconcentrated and which appears to have become more and more diverse over time: internet news sources.
Internet News
As previous versions of this report have indicated, internet news sites have always been an exception to the high levels of concentration found elsewhere across the media landscape in Canada.
The diversity of online news services fell between 2003 and 2008 as the amount of time people spent on the top 10 online news sites nearly doubled from 20 to 38 percent of the total time people spent online. Moreover, it was also the case, that most of the increase in time that people spent visiting online news sources went to sources that were extensions of well-known media outlets: CBC / Radio Canada, Quebecor, CTV, the Globe & Mail, Toronto Star, Post Media and Power Corp, as well CNN, BBC, Reuters, MSN, Google and Yahoo! (Zamaria & Fletcher, 2008, p. 176). However, even though there was a “pooling of attention” on the top 10 or so news sites, it was also the case that concentration levels were always at the lower end of the scale and drifted downward until 2011, the last point for which data was available from this early effort to map the audience’s attention to internet news sources (see the “Online News” sheet in the CMCRP Workbook).
For the last three years, I have obtained a new dataset from Comscore that brings us up-to-date. While the new dataset and the old one use different measures and are, thus, not directly comparable, the downward drift in concentration levels seen in the past has continued apace. Internet news sources are, in fact, amongst the most diverse of all the sectors reviewed in this report, except magazines. Table 4 below illustrates the point.
Table 4: Internet News Sources, 2013-2016

Source: ComScore Long Term Trend, September 2012 — September 2016, Total Canada, News and Information Category. See the “Internet News Sources” sheet in the Excel Workbook)
As Table 4 shows, Canadians get their news from a wide range of sources on the internet. The CBC is at the top of the heap, while other familiar media enterprises from Canada also continue to loom large: e.g. Postmedia, Torstar, CTV, Quebecor, Global TV, the Globe and Mail, etc. It is also clear that several newer online sources of journalism have climbed up the ranks (e.g. Yahoo!-ABC News, Huffington Post, Buzzfeed, Vice). There’s also a significant number of quality US and UK news sources near the top of the list (e.g. the CNN, BBC, NBC, New York Times, the Guardian, etc.). The Weather Channel also stands out as one of the most important sources of news for Canadians.
We spent considerable time in the last report discussing the significance of the changes taking place with respect to internet news sources so we will only briefly recap those points here (see pp. 56-57). For one, while the range of internet news sources used by Canadians consists of a diverse mixture of new and old, and local, national and international sources, new Canadian online news ventures such as iPolitics, the National Observer, Canadaland, etc. have yet to register significantly in the public mind except for the occasional intervention when they really do lead the charge and set the agenda by breaking stories that others have missed (e.g. the Jian Ghomeshi story and the Snowden disclosures, amongst many others). In fact, none of these sites crack the ranks of the 60 internet news sources that people in Canada go to for their news. This implies that they account for under one percent of internet news traffic and, therefore, that they speak mainly to small and specialized audiences.
While undoubtedly important, the significance of these relatively new ventures continues to be vastly outstripped by well-established news organizations like the CBC, Postmedia, Torstar, CTV, Quebecor, Global TV, the Globe and Mail, the BBC, the New York Times, CNN, The Washington Post, the Guardian and an assortment of “internet native services” like Buzzfeed, MSN News, RT, etc. Traditional news organizations are still the most important sources of journalism in the network media economy. They also continue to originate far more stories that the rest of the media pick up, and for these reasons, the problems besetting the press pose significant problems for the media, citizens and audiences generally. Whether future developments in internet news will prove to be a boon for journalism and its role in society and democracy, it is still probably too early to tell.
Internet Advertising
Internet advertising revenues have soared from a relatively small $141 million in 2000 to $5.5 billion last year. By 2013, in fact, the internet surpassed television as the largest advertising sector, and the gap between the two has continued to grow since. Figure 10 below illustrates the point. By 2016, internet advertising accounted for 42.5% of advertising spending across all media and, in fact, equaled the total amount of advertising spending for both television and newspapers combined in Canada (see TVB, 2017).
Figure 10: Internet Advertising Outstrips TV Advertising by a Widening Margin, 2004-2016
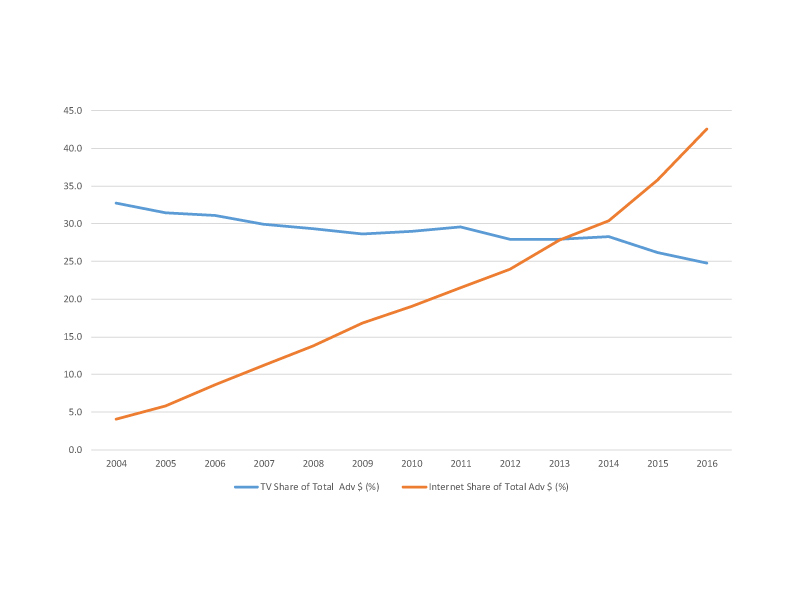
Source: TVB Net Advertising Volume.
This growth becomes more significant when recalling a key point made in the last report: namely, advertising across all media appears to have hit a ceiling in recent years, and when considered in inflation-adjusted real dollar terms, on a per capita basis and relative to the size of the whole media economy, it appears to be declining slowly. The significance of this observation cannot be understated for at least two reasons. First, it adds to the idea that in the network media economy, it is the pay-per media that are overwhelmingly dominant rather than advertising-based media (see the last report and the second sheet in the TVB workbook for more details). Second, the addition of internet advertising has not expanded the size of the media economy “pie” but resulted in a massive transfer of ad dollars from established media to internet advertisers, and to two internet behemoths specifically: Google and Facebook, as sketched in the last report and detailed further below.
We will return to that point shortly. First, however, Figure 11 below illustrates the point about the decline in total advertising spending in real dollar terms on a per capita basis for “all media” and television over the past five years or so, while it continues to surge for the internet when considered on the same per capita and real dollar terms and couched within the framework of total advertising spending across all media.
Figure 11: Hitting a Ceiling? Per Capita Advertising Spending for “All Media”, Television and the Internet, 2004-2016 (Real $)
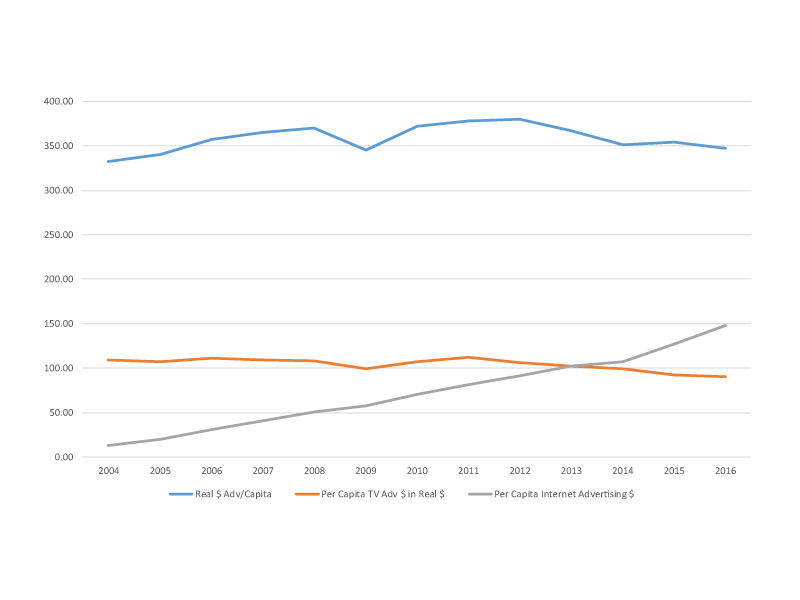
Source: TVB Net Advertising Volume with population and income figures from Statistics Canada and “current dollars” converted to “real dollars” using the Bank of Canada’s “Inflation Calculator”.
It’s important to step back for a moment to note that the advertising revenue data being discussed here are not without problems. Buried in the footnotes to the TVB and Interactive Advertising Bureau’s reports that tally up the figures are cautionary words about the potential double-counting that might be taking place between the ‘online advertising revenue’ reported by traditional media companies, notably newspapers, for their conventional areas of operation and under internet advertising (see TVB Net Advertising Volume report, footnote 2 on this point, for example). Yet, even if that is true, it would reinforce rather than detract from our claim about advertising spending appearing to be on the wane. Regardless, taking heed of these points and building on the sources we identify leads to a reasonable picture of recent developments.
Bearing this in mind, the key point from the data that we do have is that, in sharp contrast to internet news sources, internet advertising is extremely concentrated by the standards of the CR4 and the HHI. As we noted in the first report, in 2009, the top ten internet companies took 77% of all internet and mobile advertising revenue; by 2015, that number had risen greatly to 86%–where it still stood last year (IAB, 2016, p. 9).[1] Table 5 below depicts the point by highlighting the revenue and marketshares for the sixteen largest internet advertising revenue recipients in Canada in 2016.
Table 5: Internet Advertising: Revenue (Millions$), Market Shares and Concentration Scores, 2014-2016
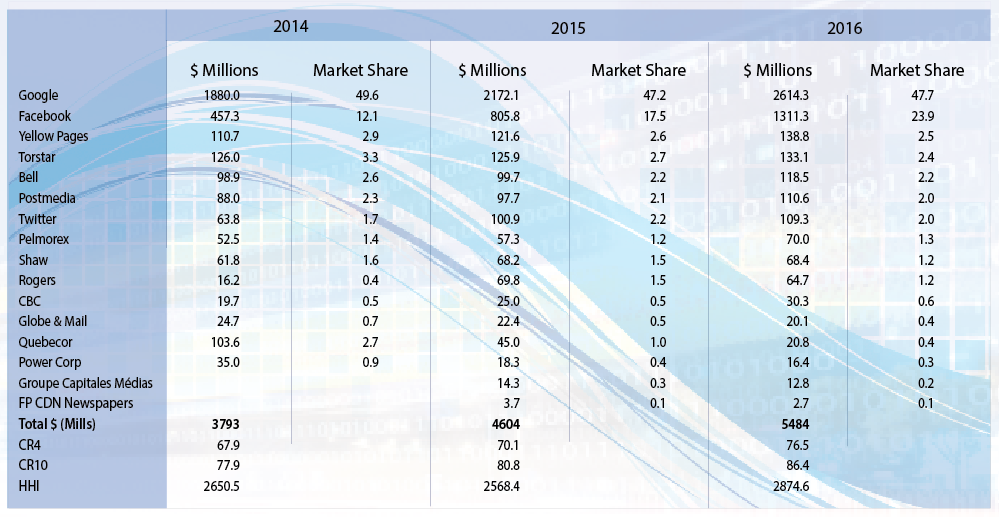
Sources: IAB, 2016 Actual + 2017 Estimated Canadian Internet Advertising Revenue Survey, p. 8, Company Annual Reports and “Internet Other” sheet in the CMCRP Workbook for more details on the methods used to arrive at these figures.
Perhaps the most outstanding observation to be taken from Table 5 is the extent to which Google and Facebook stand in a league of their own. Indeed, the two combined accounted for accounted for an estimated 72% of the $5.5 billion internet advertising market in Canada last year—up greatly just under two-thirds of the market the year before. In fact, Facebook and Google’s internet revenue in Canada are five and ten times those of the entire newspaper industry’s online and mobile advertising revenue (i.e. $258.4 million), respectively, and the chasm is widening (see TVB Net Advertising Volume).
Both companies’ aggressive embrace of the shift from the desktop internet to the mobile internet has expanded their influence considerably and tightened their grip. Facebook and Google have been almost the sole beneficiaries of conditions in which internet advertising continues to grow rapidly alongside downward pressure on overall media advertising. This has had two discernable effects: first, it has sharpened and intensified the conflict between the two companies over the only area in which there is growth, and second, it has contributed to the established media’s view of them, and the rise of the internet in general, as little more than the “vampire squids” of Silicon Valley, as the Public Policy Forum colourfully referred to them earlier this year in its Shattered Mirror report. Yet, as discussed in the first report in this series and elsewhere, this misconstrues the analysis by leaving out the pivotal facts about the seeming decline of advertising sketched above and misleadingly presumes that if only Google and Facebook can be brought to heel, that advertisers will come rushing back to them. They probably won’t because of the “advertising ceiling” point being reiterated here and because advertisers have never had any special love for the media but rather, seeing them in their time as the most efficient ways of delivering audiences to advertisers, they spent their ad budgets there. It was just business.
With a new and hyper-efficient means of doing the same job, advertisers are simply taking advantage of these “efficiency benefits” and sending their ad dollars to the most effective in the business: Google and Facebook. It is quite likely that it is just those “efficiencies” that are putting the downward pressure on the advertising spending ceiling to begin with. However, other factors are also likely at play, including the possibility that the increased concentration trends observed in several media sectors—and most of all in the biggest “platform media” sectors—are also present across the wider economy. Given that advertising is considered a means of distinguishing companies in a competitive market, waning levels of competition across key sectors of the economy could also be putting a damper on advertising spending.[1] And there is also the fact that there is extensive research showing that advertising spending rises and falls in synch with the state of the general economy. Thus, the fact that the economy has floundered since the “global financial crisis” circa 2007-2008 is yet a third factor that is likely exerting downward pressure on advertising spending in Canada (see Picard, Garnham, Miege, Vogel on the relationship between the fate of the media economy and the general economy).
Again, all of this does not mean that the public policy response should be to throw up our hands and walk away. Far from it. First, however, we need to get a better grip on the issues, and steer clear from the tendency to lay all the blame for the entertainment media and cultural industries’ woes at the doorstep of “the internet” or the two most fashionable whipping boys of such opprobrium: Facebook and Google today, Google and Craigslist a few years ago. That has been too often the tendency in Canadian cultural policy circles and it can also be seen in the current best seller by Jonathan Taplin, Move Fast and Break Things. While these polemics raise vitally important issues, their misleading diagnosis and, perhaps just as concerning, their proposed cultural policy prescriptions, if they were to gain any traction at all, are likely to end up being a distraction for what is really needed to bring the “new monopolists” to heel and to remake culture and communication policy for “the internet age”. In the first report, I suggested that we might do better by listening more closely to those who are trying to rethink issues of media and internet concentration in light of present conditions (e.g. Khan, 2017 Mazzucato, 2014; Noam, 2016; Pasquale, 2015; Stucke & Grunes, 2016). I suggested three other proposals for consideration as well: regulated algorithm audits (using banking and finance regulation as a potential guide); applying the same Election Canada’s rules that govern advertising on TV, newspapers and other mass media during election campaigns to platforms like Facebook and Google; and Advertising Whitelists whereby the top 10 to 100 advertisers could be required to use regularly updated “whitelists” of URLs to determine where their ad dollars go instead of relinquishing control to Facebook and Google’s algorithms. This would distribute control back to advertisers and likely redound to the benefit of TV and newspapers (see pp. 41-42 in the last report).
Search
Google’s dominance of internet advertising flows from its dominance of the search engine market. To be sure, the company has expanded into all manner of activities in recent years, including operating systems, browsers, mobile handsets, artificial intelligence, cloud storage (data centres) and the ownership of fibre optic cables that string together cities and countries around the world. Indeed, the company is one of the world’s biggest carriers of international internet traffic (see Stevenson, 2017, p. 147). All that said, however, close to ninety percent (88%) of its revenue still comes from its iconic search engine and advertising revenue, as the company’s latest Annual Report observes (p. 24). And so this is where we must keep our focus.
The early years of the commercial internet in the 1990s and early 2000s saw an eclectic variety of search engines: AlltheWeb, AltaVista, Excite, Go, Infoseek, Lycos, WebCrawler, OpenText, Yahoo, etc. Most went bankrupt or were swallowed up by others along the way, although some still linger on. After this early commercial phase, however, things changed as eclectic experimentation and idiosyncratic efforts working cheek-by-jowl with serious efforts gave way to the emergence of winner-take-all conditions (see van Couvering, 2011).
Concentration levels in the search engine market in Canada have been persistently sky-high since 2004. CR scores have consistently been well over 90, and HHI scores have been nearly off-the-charts in the 4000-7000 range (remembering that 10,000 represents the upper limit of the HHI scale, or total monopoly). This is another core element of the internet that is far from being immune to processes of consolidation. Indeed, internet search is amongst the most concentrated of all the different segments of the network media ecology—by far.
Google’s dominance rose sharply from the mid-2000s until the end of the decade and into the next, where it typically hovered in the low 80% to 90% range. As of 2016, the search engine giant thoroughly dominated search in Canada with a 91.4% marketshare. Microsoft (5.2%), Yahoo! (2.9%) and DuckDuckGo (.3%) trailed far, far behind. CR4 and HHI scores were sky-high at 99.8% and 8382.5, respectively. Table 6, below, illustrates the current situation and developments since 2009.[2]
Table 6: CR4 and HHI Scores for the Search Engine Market, 2009-2016
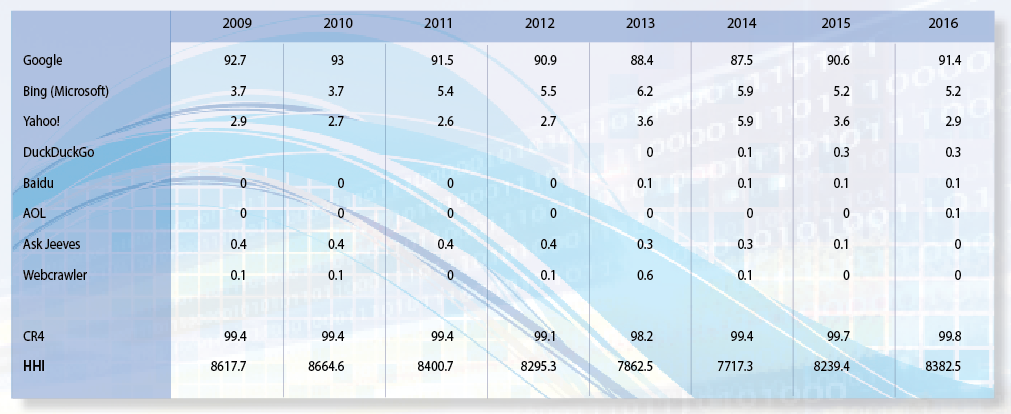
Source: StatCounter. Global Stats (Various Years). http://gs.statcounter.com/search-engine-market-share/all/canada/another.
Social network sites display a similar but not as pronounced trend. Again, however, the data is limited and dries up completely after 2013. However, while dated, that data is still useful in terms of illustrating the point that many core elements of the internet are extremely concentrated. Thus, in March 2013. Facebook accounted for 46% of unique visitors to such sites, followed by Twitter (15%), LinkedIn (12%), Tumbler (12%), Instagram (9%) and Pinterest (6%) (Comscore). With a CR4 score of 85% and an HHI of 2762, social networking sites are highly concentrated.
If anything, Facebook’s dominance of social networking has increased immensely given its sharply rising share of internet advertising and on account of three major acquisitions that have consolidated its grip within social media: its take-over of Messenger (2011), Instagram (2012) and WhatsApp (2014). All these acquisitions are examples of diagonal integration. Transactions of this type tend to reduce competition because of the take-over of one firm by another in an adjacent market reduces the number of competitors working in areas that are closely complementary (or substitutable) for one another.
With respect to other core elements of the internet ecology, current levels of concentration can be best described as sky-high. Take desktop web browsers in Canada, for example. The top four companies—Google Chrome (56.4%), Microsoft’s Explorer (26.1%), Firefox (12.2%) and Apple’s Safari (3.5%)—have a combined market share of 98.2 percent and an HHI of 4023 (Netmarketshare). To be sure, competition between Google and Microsoft has seen the two swap places in terms of the number one and two browsers over the past five years, but other than that competition has been anemic and concentration levels have been consistently at the very high end of the scale.
Similar characteristics hold for mobile browsers, albeit with a different rank ordering of the players. Just two companies account for over 90% of the market—Google’s Android or Chrome browser was at 61% last year and Apple’s Safari at 29.9%—while Opera, with a 5.6% marketshare, and Microsoft Explorer with 1.7%, lagged very far behind. The upshot is extremely high levels of concentration on the basis of both the CR4 (98.2%) and HHI (4649) scores (Netmarketshare). While concentration levels have always been solidly in the highly concentrated zone, they did fall significantly between 2013 and 2015 in the face of the rapid growth and adoption of Google’s Android operating system, and less so, the Opera operating system. That trend, however, approved transitory as Google sealed it’s dominant stake in mobile browsers in 2016.
Similar patterns prevail once again in terms of desktop and smartphone operating systems. When it comes to desktop operating systems, three entities account for 100% of the installed base (Microsoft Windows, 91.1%; Apple OS X, 6% and Linux at 2.5%). Consequently, the HHI is at the extreme end of the scale at 8415. The extent of Microsoft’s control of installed operating systems has stayed remarkably constant over the years and has actually trended upwards in recent years.
For smartphone operating systems, the top four players accounted for 99% of the market: Google’s Android OS (64.4%), Apple’s iOS (33.1%), Microsoft (.9%) and Symbian (.7%). Java (.6%) and RIM (.3%) accounted for the rest. Again, the significant growth and adoption of the Google Android operating system for mobile phones stands out, and in fact it replaced Apple at the top of the rankings in 2015 and consolidated that position in 2016. The HHI score was 5245 at the time (Netmarketshare). For all intents and purposes, however, Google and Apple possess a duopoly when it comes to mobile operating systems. Again, the upward trend in recent years with the rise of the “mobile internet” is significant, and it is consistent with trends in other areas reviewed, all of which suggests that the forces of consolidation do not abate with the advent of new media technologies but congeal—albeit with a few notable exceptions, like internet news sources, as discussed earlier.
The Network Media Industries as a Whole
The following paragraphs draw this report to a close by combining all the bits and pieces into a bird’s eye view of long-term trends across the network media economy. Figures 12 and 13, below, start the process by showing the trends across the network media economy over time on the basis of CR1, CR4 and CR10 scores, followed afterwards by a depiction of the trends based on the HHI.
Figure 12: CR, 1, 4 and 10 Scores for the Network Media Economy, 1984-2016
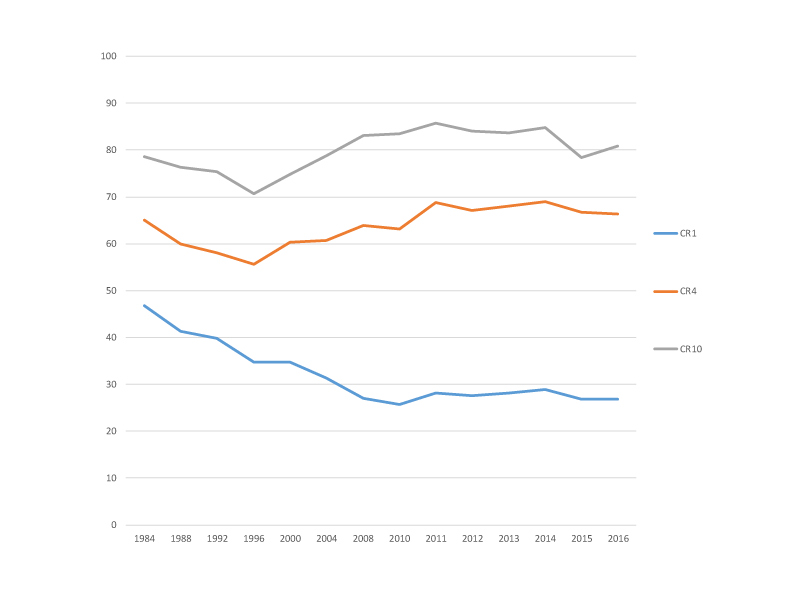
Sources: see the “CR & HHI” sheet in the CMCRP Workbook.
Looking across the entirety of the network media economy, several distinct points emerge: The biggest company’s share of revenues across the media three decades ago was 47%; in 2016, it was much less, but still a very large 27%, and within a vastly larger media universe. That company in 1984 was BCE; it still is today, and it is far larger than the second and third-ranked firms, Rogers and Shaw. Moreover, BCE’s share of the total network media economy has stayed relatively constant over the past half-decade.
At present, Bell (26.8%), Rogers (16.5%), Telus (15.5%) and Shaw (7.7%) make up the “big four” media giants in Canada. Together, they accounted for two-thirds of the whole network media economy in 2016. This was only a little higher than it was three decades ago, but up considerably from its low point in the mid-1990s as the early period of growing competition associated with the rise of wholly new media sectors and an expanded role for the market gave way to consolidation within and across media. The most significant and far-reaching change in recent times, however, is the ascent of four giant vertically-integrated telecoms-internet and media conglomerates: Bell, Rogers, Shaw and Quebecor. They accounted for 55.6% of total revenues last year. Add Telus to the fold and the market share of the top five Canadian telecom, internet and media companies swells to 71.1%.
The largest ten firms accounted for 80.8% of all revenues in 2016—down significantly from 85% two years earlier and reflecting the growing role of the internet hypergiants within the media economy in Canada. By contrast, however, the figure hovered in the low- to mid-70% range in the 1990s, and today remains modestly higher than levels in the early 1980s. Once again, the idea of a “u-shaped” curve fits the trends.
All-in-all, after taking account of the top four or five firms, there is a distant second tier of a dozen or so specialized telecoms, internet and media companies: Google, the CBC, Facebook, Sasktel, Postmedia, MTS, Cogeco, Torstar, Eastlink, Netflix, theGlobe and Mail, Power Corporation and a relative newcomer, Groupe Capitales Médias—in that order. Members of this group of second tier players does not spread their operations across many segments of the media but tend to stick to one or a small range of media. Combine these companies with the tier one firms, and a dozen-and-a-half or so companies account for 86% of all revenues in the network media economy.
Figure 13 below shows their respective rank and composition based on their revenues in Canada.
Figure 13: Leading Telecom-Internet and Media Companies in Canada, 2016
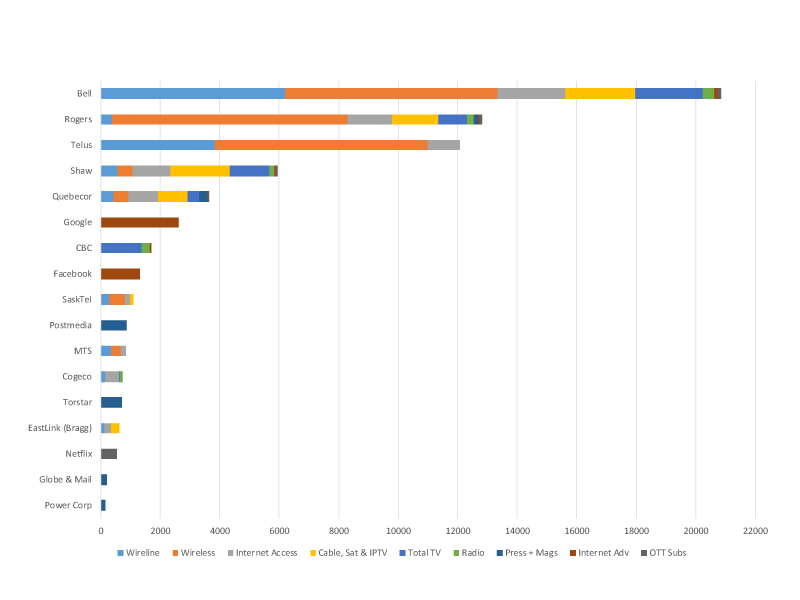
Sources: see the “Top 20 w Telecoms” sheet in the CMCRP Workbook.
A notable change in the past few years is the fast rise of internet companies up the ranks of the leading media, internet and telecoms companies in Canada. Google’s fast ascent through the ranks to 6th place by 2013 and remaining there ever since stands out in this regard. It is now second only to the tier one players—e.g. Bell, Rogers, Telus, Shaw and Quebecor—but with a greater share of the media economy than traditional mainstays on the media landscape in Canada such as the CBC, the Globe and Mail, Torstar and so on.
Facebook and Netflix also cut significant figures in their respective areas but are still modest in their standing within the overall network media economy. Netflix’s estimated revenues of $534.1 million represented 6.4% of total TV revenues in 2016, a substantial amount that places it ahead of Quebecor’s TVA and its specialty and pay TV services. It also has a more significant presence than all the main independent TV groups combined, i.e. V Interactions, DHX, APN, Pelmorex/the Weather Channel, Radio Nord, Blue Ant, Stingray and Fairchild.
For its part, Facebook’s estimated Canadian revenues of $1311.3 million account for just under a quarter of internet advertising revenues in Canada. While still modest with its 1.7% share of the $79.3 billion network media economy, a better sense of the scale of Facebook’s impact is gained by focusing on those areas where it is most likely to be having a palpable impact on well-established media players. Newspapers especially see themselves in an existential battle with the digital media giants for advertising revenue and, in this sense, they are right to be worried. As indicated earlier, Facebook’s estimated advertising revenue was five times as much as the entire newspaper industry’s online and mobile advertising revenue in 2016.
Figure 14 below offers another portrait of concentration trends for the network media economy as a whole but this time using HHI rather than CR scores.
Figure 14: HHI Scores for the Network Media Economy, 1984-2016
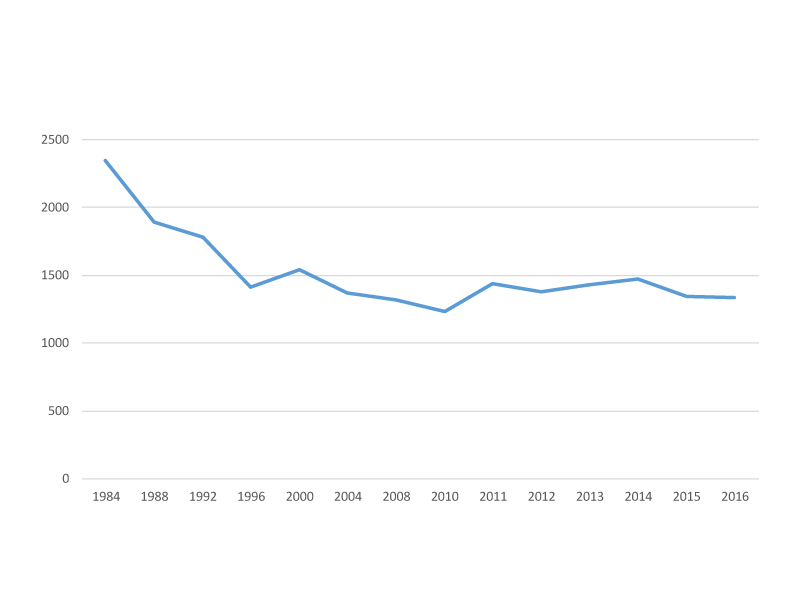
Sources: see the “CR & HHI” sheet in the CMCRP Workbook.
As with the CR scores shown earlier, Figure 14 also shows a ‘u-shape’ pattern. If we take HHI scores for the ‘total media universe’ as the beginning and endpoint of our analysis, this is our conclusion: concentration levels have fallen substantially across the media economy over time. They are much lower than they were at the turn-of-the-21st century and a far from cry from what they were in 1984. This is exactly why observers such as Ben Compaine, Ken Goldstein, Brent Skorup and Adam Theirer and Jeff Eisenach argue that any continued concern with media and internet concentration is both wrong and wrong-headed. For them, it’s all a great big “digital media ecosystem” now, and within that context, it’s a battle of all against all, with no meaningful lines between any of the various bits and pieces that make up the “system”, or the players at war with one another for their very survival, and for consumers’ attention and affections.
That conclusion, however, is deeply problematic for several reasons. First, the long–term decline in concentration that it implies has been thrown into reverse since 2010, with a significant rise in the years thereafter where things have generally stayed steady in the high 1300 to high 1400-range. While the decline since 1984 brought the overall HHI firmly into the competitive zone of that measure’s standards, the reversal in the last five years has brought levels close to the moderately concentrated zone. This represents a very significant change over a fairly short period of time. Moreover, the figure seems to be stabilizing despite all the obvious upheaval, with a handful of deeply entrenched media conglomerates well-known to Canadians at the top of the heap: Bell, Rogers, Telus, Shaw and Quebecor. Yes, Google, Facebook and Netflix are encroaching on their turf, but insofar that we take the market and competition as our guide, their presence has not dislodged the “big five” Canadian firms from their perch but added to the size and complexity of the media economy while throwing up pressing questions of their own and which we have only begun to grapple.
Second, by taking the “bird’s eye” view as the beginning and end of the story the conclusion of those who argue that things are just fine obscures trends at the sector-by-sector and category level analysis, e.g. platform media, content media and online media. We use the “scaffolding method” precisely to pick up on the dynamics within each media sector and at each level of our analysis, whereas starting at the opposite, high-end view, and sticking with that vantage point the whole way through, dulls the sensitivity of the HHI method in relation to crucial changes within each of the sectors and categories that comprise the network media. Moreover, given the reversal of long-term trends within many sectors and across the media economy, drawing conclusions about the “fiercely competitive” state of the telecoms, internet and media industries at this point in time would prematurely foreclose the end of the story.
In contrast, the “scaffolding approach” that we use reveals a more variegated portrait that is sensitive to changes in specific sectors, categories, and across the network media. Figure 15 below gives a snapshot of the network media in 2016, listing sectors where concentration was low, those that were moderately concentrated, and those that were highly concentrated by HHI standards.
Figure 15: Concentration Rankings on the basis of HHI Scores, 2016
Concluding Thoughts
Several things stand out from this exercise. First, we are nowhere near a time when studies of telecoms, internet and media concentration are passé. Indeed, theoretically- and historically- informed, and empirically-driven, research is badly needed because there is such a dearth of quality data and independent research available. And as some media and certain established players do struggle for their lives, research is being weaponized in the battles over the future of the media like never before. The stakes are huge, and things are up for grabs in a way that is very unusual. Within this contested context, it is essential to try as best we can to marshal good evidence and good stories, lest we be left ill-equipped to withstand those who mobilize knowledge and publicity in the service of their own commercial interests but not necessarily those of the many publics that make up Canadian society and who should be the primary beneficiaries of the changes afoot.
The concerns addressed in this report do not belong to a distant past rendered obsolete by new technological and economic realities. They are intimately intertwined with the events of the day. The trends observed are similar to those seen in the US and many other countries around the world (see Noam, 2016). However, they are also distinct and unique, for all of the reasons that this and our preceding report have tried to make clear, and which we summarize below.
Concentration levels fell sharply in the 1980s and part way through the 1990s, but the tide was reversed in the second half of the 1990s. Of course, details differ from one medium to the next, and from country to country, but the general trend in Canada, like the US, was similar, with a steep upward rise in the late 1990s that peaked by 2000, followed by fairly constant levels at this high point for the decade that followed.
The last five years have once again seen an uptick in most of the “platform media industries”. Even here, though, a close examination reveals some competitive dynamics in the mobile wireless, retail internet access and “cable TV” sectors that have begun to press more urgently in recent years, even if they are not fully showing up in the numbers. New entrants in mobile wireless have carved out some important gains that need to be built upon rather than left to wilt, or by pulling out the last rung on the ladder immediately after those who have secured a modicum of success have climbed past it. In this regard, Quebecor’s Videotron has certainly made impressive gains in Quebec, and the results show in terms of its own market share, more affordable rates for several tiers of services not just from Videotron but from each of the national carriers competing with it in the province, and higher monthly data allowances.
Shaw’s Freedom Mobile also aims to build upon the tentative success that its predecessor, Wind, had eked out against an unstable policy backdrop and obstacles placed in its path by the big three national carriers at each step of the way. As our analysis shows, there is indeed “no magic number” for how many wireless providers there should be. That said, however, where a strong independent rival to the national carriers exists, whether that’s in Thunder Bay, Manitoba, Saskatchewan, the Atlantic provinces or the areas covered by Videotron and Freedom, several common features emerge: more affordable prices, a wider range of service plans, bigger data allowances, and so forth (although, again, there are still differences in the details).
Similar patterns can be seen with respect to retail internet access services. The numbers alone tell something of a bleak story, with HHI scores that have remained stubbornly very high over much of the last decade. But again, look close, and a history emerges that shows that things weren’t always thus, and that even within the last decade the indy ISPs that did so much to develop internet access in Canada in the first place have slowly expanded their clout. They have effectively doubled their share of revenue and subscribers in the retail internet access market—albeit from a low base. That measures are being put into place to ensure that they have regulated wholesale access to the internet infrastructure of the 21st Century—fibre-to-the-doorstep—bodes well. The devil, as always, however, will be in the details, and those details will be hammered out in the protracted meetings that are now ongoing deep within the CRTC’s esoteric regulatory machinery. And the outcome of all that, in turn, will depend on a key question, namely whether the newly installed head of the Commission will continue to have the fortitude to finish what his predecessor began, and will the government-of-the-day have the political spine to back up these rules against inevitable pushback from incumbents?
And so too with cable TV are there some openings as well that are worth summarizing. The advent of the telephone companies’ IPTV services has driven down the very high levels of concentration that have long beset that industry but the market is still a duopoly and highly concentrated. In these areas, a lesson emerges: the platform media industries and many core elements of the internet, including broadband access, internet advertising, search, browsers, operating systems and social network sites, are not the harbingers of a communications cornucopia where concerns with concentration vanish but some of the most concentrated segments of the media, full stop. Indeed, as Noam (2016) has stated, concentration levels in these sectors are “astonishingly high”. This is certainly true of Canada. These realities gird the towering role that internet media giants like Google, Facebook and Netflix now play in Canada, and such realities need to be redressed.
Of course, these trends are not all to one side and the case is especially more varied in the content media industries. As we have seen, internet news sources frequented by Canadians are defined by “astonishingly high” levels of diversity based on a fairly wide diversity of “new” and “established” news organizations, and domestic and foreign ones as well. Magazines and radio are also at the desirable end of the diversity spectrum as well—although in some ways that is a measure of a big problem too, as magazine stables are busted up and sold off as publishers scramble to deal with the crisis besetting the industry. Some new players such as TekSavvy (internet access), Blue Ant (TV) and iPolitics (online news) have added diversity to the landscape as well, but their impact has been modest and, for some, their future remains uncertain.
Another significant development stands out in this year’s version of our report: even in the heartland of television, the half decade long bout in which consolidation levels spiked appears to be abating and the tide slowly changing course. While broadcast TV concentration remains untouched at very high levels, when it comes to pay and specialty TV, internet streaming TV, and the over TV universe, the market is expanding, becoming somewhat more diverse, and far more complex. Since the high tide of consolidation between 2010 and 2014, concentration levels have come down in the last two years as Bell, Shaw, Rogers and Quebecor have each spun off some significant TV services while shuttering others. This has reduced each of their market shares, respectively, while redounding to the benefit of relative newcomers such as DHX, Stingray and Blue Ant. Internet streaming TV services are also taking hold, with Netflix, of course, being the clear winner by far, but Bell’s CraveTV and Quebecor’s illico service are also expanding significantly. While there is no gainsaying the fact that these are significant trends, it is essential to not lose sight of the forest through the trees because the fact of the matter is that concentration levels are still firmly in the moderately high zone, and there is much room for improvement.
The idea that concentration levels in telecoms, internet and media are high is not the product of mere speculation or allegations but established legal facts. The CRTC has rediscovered media concentration in the past few years and taken some bold steps by the standards of the past to do something about it in a series of landmark rulings that were reviewed earlier in this report: i.e. the Mobile TV, Talk TV and the regulated wholesale mobile wireless and wireline decisions, amongst others. And on each occasion, the Commission’s message was clear: “Incumbent carriers continu[e] to dominate the retail Internet access services market”. There has been little change in such realities over time. The Competition Bureau has established the same points with respect to mobile wireless markets but then on crucial moments, like BCE’s acquisition of MTS, walked away from its own findings by doing what it so typically does: giving a green light to most mergers and acquisitions put before it. New technologies, whether 4G LTE mobile wireless services, the up-and-coming 5G wireless standard, or the fibre broadband internet access networks that are being brought to Canadians’ doorsteps do not obviate these concerns one iota but demand a firm hand at the tiller to ensure that the same kinds of problems that exist today do not become those of tomorrow. Equivocating regulators will just not cut it.
As this report has shown, however, it is not just high level of concentration that is at issue but the specific form it has taken in Canada. Indeed, Canada is not unique because of high levels of media concentration. It does not have the highest level of media concentration in the world (or even amongst just “developed capitalist economies”, as is commonly asserted). Where Canada stands out relative to the rest of the world is in terms of its extremely high levels of diagonal integration between different “platform media” (e.g. mobile wireless, internet access, BDUs) (essentially, telecoms operators), and vertical integration between telecoms operators and commercial TV services (other media content).[1] We have dealt with this point at length in several other reports in the past year, so will only highlight a few of the key ideas here (see here, here and here).
In terms of diagonal integration, all the main distribution networks (mobile wireless, wireline, ISPs and BDUs) are typically owned by one and the same player, whereas in many countries there are stand-alone mobile network operators (MNOs). Canada is unique in the extent to which mobile wireless and wireline infrastructures are integrated into single companies, with the last stand-alone MNO—Wind Mobile—acquired by Shaw last year. In the US, T-Mobile and Sprint are stand-alone MNOs; while stand-alone mobile providers are common in other countries: Vodafone is a good proxy for this given the many places it operates in, although it also operates wireline networks in a few countries as well (e.g. New Zealand). High levels of diagonal integration matter for at least three reasons.
First, diagonally integrated companies often manage demand, rivalry and prices across each of their “platforms” with one eye cocked on their stand-alone MNO rivals and the other fixed on ensuring that whatever one branch of the firm does it does not cannibalize the revenue of another. Some say this is natural, and I agree. However, the problem is that it undercuts the competitive thrust of market-based competition and regulators should deal with that “natural” inclination accordingly. Doing so, however, too often seems to be a bridge-too-far, and anything but “natural”, in the Canadian context. Second, diagonal integration matters because when different companies own competing networks in separate markets, concentration levels are usually lower. Third, the presence of a stand-alone MNO affects the services on offer in terms of affordability, data allowances, availability, and so forth.
As the consultancy Rewheel shows, for example, stand-alone maverick mobile operators (e.g. Free in France, Hutchison 3 in the UK, or T-Mobile in the US) “sell 8 times more 4G gigabyte volume allowance than the EU28 operators that belong to groups that also have fixed-line broadband interests”.[2] In other words, diagonal integration serves to blunt the sharp edge of competition by restricting data allowances which, in turn, limits the impact of mobile wireless services on fixed, wireline services. A similar logic also checks the impact of the internet on the cable television distribution model, which both the large incumbent network operators and cultural nationalist policy groups seek to leverage as a means of maintaining a broadcasting distribution undertaking- (BDU-) centric model of the media universe, as we noted in another research report last year.
Vertical Integration in Canada is also extremely high by historical standards, and has soared since 2008. It is also extremely high—four times as high, to be exact—in comparison to US standards as well, as we have seen. Indeed, Canada is unique in the world given the extent to which all the major commercial TV services are all owned by telecoms operators. Structure matters a lot, and in Canada the vertically integrated and concentrated structure of telecoms, internet and media markets retards competition, creativity, culture and innovation. Look across the border and around the world where the structural integration of telecoms and TV is rare rather than common like it is in Canada, for example, and cable companies and TV services are competing more aggressively, creatively and independently with one another. The result is entities that don’t simultaneously own broadband infrastructure have launched far more stand-alone internet streaming TV services for a longer period of time than anything seen in this country. This can be seen in the US, for example, over the past three years or so with Time Warner’s HBO Go, CBS All Access, Starz’ internet and mobile TV app and Disney’s plans for several new streaming TV services. This is all over and above Netflix and Amazon Prime, for example, as well as Sportsnet Now and streaming services from NBA, MLB, and so on. The only major entity to not offer its own such services is Comcast NBCUniversal,[3] and this is, not coincidentally, likely due to the fact that it is the only vertically-integrated media conglomerate in the US. In other words, Comcast is the exception in the US while its structure mirrors that which is common in Canada, and unsurprisingly the outcomes are similar. Structure matters, and in this case it bears repeating the vertical and diagonal integration—coupled with high levels of concentration—biases the media system towards closure and control. This is the exact opposite of what is needed in an evermore internet and mobile wireless media system, where competition, creativity, culture and innovation are the values to be realized.
While Canadian regulators have countenanced these developments in the past, they have begun to reject the North American “free market model” orthodoxy that brought about these conditions to begin with. As the Trump Presidency resets the regulatory clock in the US, those who have helped set that agenda, such as Jeffrey Eisenach, have been brought into Canada by the incumbent telcos to push the same agenda of dismantling of communications specific regulation and policy in favour of general competition law here—many times (see here, here and here, for example). Indeed, the incumbents have fought the current drift of events within this country tooth-and-nail. Bell, for instance, has done so by flooding the courts with appeals of several CRTC decisions in the last few years (see here, here and here) and by landing a petition to Cabinet on the desks of the incoming Liberal Government before it was even in office, although that appeal was rebuffed by the incoming Cabinet early in its mandate, and to its credit.
The lobbying front has also been in full swing for coming on close to two years in support of the companies’ stance on these matters and against any more attempts “to achieve greater competition”, with the C.D. Howe Institute calling on the new government to change course to bring it into line with the incumbents’ view of the world. The government shouldn’t be “picking winners”, they dismissively and misleadingly bellow. The Globe and Mail has published the Institute’s call in its op-ed pages, just as the National Post has done for similar reports produced by the Macdonald Laurier Institute. In fact, the marketplace of ideas has been flooded with reports by the incumbents’ hired guns and industry-friendly think tanks like the Fraser Institute, the Montreal Economic Institute or the MacDonald Laurier Institute. Meanwhile, independent research and researchers get short shrift, and their work held to wholly different standards than the “rip-and-write” approach that too often governs journalists on the telecom, internet and media beat who cover every think tank report, company press release and quarterly conference call. The public debate is skewed as a result. All of this is not by design on the part of the journalists, or a conspiracy to suppress any particular scholar’s work, but a function of the well-known role played by routine institutional sources (see here and here). Journalists can and must do better to amplify and explain all the voices that attend to these issues, and not just those of the powerful commercial interests who stand to benefit from the policy issues in play. This is essential so that we can discuss and have the debate about these issues that we need and deserve.
The impending legislative reviews of the Broadcasting Act and Telecommunications Act, while possibly needed, seem fraught with peril when seen in this light. Social connections and the revolving door between governments and industry, and especially the telecoms and media industries, have been a mainstay of the political economy of communications in Canada and have not served us well. Whether the current Trudeau government can avoid being captured by similar forces amidst the scramble now underway to shape the future of communications in this country, only time will tell.
In short, high levels of telecoms, internet and media concentration are reality. What is to be done, if anything, about this state of affairs is a political question. On that, we need to take bold steps to help bring about the kind of communications environment we want.
While so far it has been rather tepid in the moves it has made in this domain, the Liberal Government should double-down on the course charted by the Conservatives, albeit in ways that reflect more ambition and a broader conception of the role of the internet, media and telecoms in Canadian society, business, politics, culture and everyday life. The top-to-bottom review of communication and cultural policy still underway under the auspices of Minister Melanie Joly and the Department of Canadian Heritage that she leads could be a valuable step in this direction, as could the reviews of the Telecommunications Act and Broadcasting Act. To succeed, however, the Liberal Government will have to resist the pleading coming from many corners of the industry and reinvigorated cultural policy nationalists who wish to tie the evermore internet- and mobile wireless-centric media ecology to their anachronistic views of communication and culture.
To close, and as I always like to say, it’s important to keep in mind that we are living in what historians call a “constitutive moment” when decisions taken now will influence the course of events and the shape of the media environment we inhabit for years, even decades, to come. Once such decisions are made, the structures of the new medium of human communication that we are still struggling to come to grips with now – the internet- and mobile-centric media ecology — will become part of the woodwork, and stay that way for a long time to come. We hope that this report and the others in this series will contribute to better decisions, made on the basis of evidence, and a broad view of the importance of communications to all members of society.
[1] Discussions of these points tend to distinguish between “horizontal” and “vertical” integration. I follow Gillian Doyle (2013) to add a third type: “diagonal” integration. In this conceptualization, horizontal integration refers to ownership transactions within a single market; diagonal integration refers to transactions across markets at similar levels of the “value chain”, for example, between a company operating as a BDU and a competing or complementary distribution network like an ISP or mobile wireless network. Shaw’s take-over of Wind Mobile in 2016 is an example of this. Vertical integration occurs when a company takes over another firm that is upstream or downstream in the production chain, and is usually of two types: the first is where those who own the distribution network own TV and other content services delivered over them, while a second type involves, for example, integration between those who produce TV and film content and those who package and distribute it. Disney is an example of this, given that it owns one of the main Hollywood film studios and the ABC TV network as well as many specialty and pay TV services.
[2] Rewheel (2016). The state of 4G pricing – 1st half 2016 DFMonitor 5th Release. http://dfmonitor.eu/
[3] Comcast does, however, share a joint interest in Hulu with Time Warner, Disney and News Corp.
[1] I would like to thank a former Ph.D. student at the School of Journalism and Communication, whose dissertation on finance, monetary policy and communication I supervised, and a first-rate economist, Marc-Andre Pigeon, for bringing this possibility to my attention.
[2] In the past, I have used Experien Hitwise data. However, since 2014, that data has not been available on agreeable terms. The StatCounter data skews somewhat higher than those it replaces but are consistent with sources reported elsewhere.
[1] The IAB dropped its tally of the top 10 companies’ share of internet advertising after its 2016 report in favour of reporting on the top 5 and 20, respectively, companies’ share. The most recent IAB report, however, shows that the increased revenue went entirely to the top 5. Our observations for the top 10 companies’ share of the total is a little lower that the IAB’s for 2015 at 81%, but rising to 86.4% last year.
[1] The numbers would be 81% and 86%, respectively, if the tally for “total TV” did not include OTT services, as this report has done in the past. While we have treated such services separately since 2011, last year we folded them into the definition of “the total TV” universe to account for the centrality within the overall TV marketplace.
[1] Crucially, this was the year when the Chretien Liberal Government’s new Convergence Policy document lifted the restrictions that had previously prevented both sets of companies from competing with one another on their “home turf” and, crucially, that had kept telephone companies like Bell from owning and controlling broadcasting and other types of content. In other words, it was the moment when vertical integration between telecommunications and TV was given the green light.
[1] Two of these studies, Church and Wilkins (2013) and Navigant (2013), were funded, at least in part, by incumbent wireless carriers, by Rogers in the first case and Telus in the latter. See footnote 7, Winseck, D. (2014). Mobile Wireless in Canada. Wolter Lemstra and William Melody’s (eds)(2014). The Dynamics of Broadband Markets in Europe is a smart addition to the literature that takes a more scholarly versus “hired gun” approach to these issues and what it takes to improve market conditions.
[2] Constructive criticisms from Catherine Middleton and Bram Abramson have also helped spur this change and our efforts to develop a better way to get a more accurate portrait of where things stand.
[1] Also consider, for example, that Yahoo!’s revenues account for just 4.1% of Verizon’s total revenue, whereas broadcasting and other content operations account for 10-30% of the Canadian vertically integrated-giants, with Rogers (11.3%) at the low end of the scale and Shaw (26.8) at the high end (see Figure 4 above).
[1] Telecoms includes wireless, wireline and internet access; media includes broadcasting distribution, TV, radio, newspapers and magazines.
[1] Newspaper Canada redefined daily newspapers in 2014 as those that are published a minimum of four times a week and free daily papers such as the Metro papers available in large Canadian cities versus the traditional definition of every day of the week, except in some cases Sunday, as has long been the standard in the industry. The number reported here is for paid dailies that publish at least four times a week.
[2] Here I am playing on some recent ideas about “the Stack” by Benjamin Bratton in his book of that name and others like Nick Srnicek’s Platform Capitalism, but also with a sense of déjà vu in light of the fabled “Bell Heads vs the Net Heads” battles that waged from the 1970s through the 1990s during the formative years of the early internet (see Frieden and Wired).
[3] In the 2015 federal election, only twenty-three of the eighty-five paid dailies then operating published an editorial to endorse one party or another.
[4] Zero-rating, or “differential pricing practices” as it is more formally known—in essence, is when a mobile operator or ISP does not count specific content, applications or services toward subscribers’ data allowances while counting everything else towards those caps. While such practices offer the lure of “free stuff” as a way of marketing them to consumers, they have the fundamental effect of transformation carriers into publishers and/or editors who pick and choose what people get for “free” and what they don’t, undermining common carriage (or “net neutrality” as it is more popularly known). Instead of such marketing gimmicks, the Commission concluded that the drawbacks of such an approach outweighed any potential benefits they might have, and that rather than using zero-rating to competitively differentiate themselves, ISPs and mobile operators should use, for example, price, speed, quality of service standards, customer service and many other tools instead to achieve the same ends.