The Growth of the Network Media Economy in Canada, 1984-2016
A PDF version of this report is available here, while previous versions can be found for 2015, 2014, 2013, 2012 and 2011.
Executive Summary
Every year the Canadian Media Concentration Research Project puts out a series of reports on the state of the telecoms, internet, and media industries in Canada. This is the first installment in this year’s series.
The report examines the development of the media economy over the past thirty two years. We do so by examining a dozen or so of the biggest telecoms, internet and media industries, based on revenue: mobile wireless and wireline telecoms; internet access; cable, satellite & IPTV; broadcast, specialty, pay and over-the-top TV; radio; newspapers; magazines; music; and internet advertising. We call the total of these sectors “the network media economy”. Our method is simple: we begin by collecting, organizing, and making available stand-alone data for each media industry individually. We then group related, comparable industry sectors into three higher level categories: the “network media” (e.g. mobile wireless, internet access, broadcast distribution), the “content media” (e.g. television, newspapers, magazines, etc.) and “internet media” (e.g. internet advertising, search, internet news sources). Ultimately, we combine them all together to get a bird’s-eye view of the network media economy. We call this the scaffolding approach.
Why do we do this? Simply put, it helps us understand the state of the telecoms, internet and media industries in Canada. It helps us to see which ones are growing fast, which are slowing down and perhaps stagnating, which might be in decline, and even a few that appear to be recovering after having been hit hard by the rise of the internet and mobile media. The following figure offers a high-level snapshot of where things stood at the end of the last year.
Figure: The Growth, Stagnation, Decline and Recovery of Media within the Network Media Economy, 2016

Understanding the media environment also puts us in a better position to think about what we should be paying attention to. Communication and media scholars, for example, tend to emphasize the content media and seem to think that advertising-based media are the centre of the universe, but our analysis suggests that “bandwidth” and “connectivity” are far more important than is often assumed. We also find that advertising is in decline relative to the size of the economy, in inflation adjusted, real dollar terms and on a per capita basis, with subscriber fees now outstripping advertising revenue by a five-to-one ratio. In our view, this means that to focus solely or primarily on advertising-based content media is akin to looking at the world through the wrong end of the telescope. Our work and reports, in contrast, can be seen as a plea for scholars and others to reset the hierarchy of intellectual and research priorities, and to match them with the increasingly broadband- and mobile-centric media universe, and one where “the pay-per media” rather than advertising-supported media are king.
Our historically- and theoretically-informed, empirically-driven efforts give us a good vantage point from which to appraise contentious claims about the media industries—claims that are never in short supply. Within a context where the role of policy and regulators looms large, knowing both the details and the broad sweep of the network media economy secures a base from which to weigh in on these matters—as we do from time to time, and as we encourage others to do as well. Things have been especially busy in recent years, and will continue to be so, with reviews of the Telecommunications Act and the Broadcasting Act, the television industry, the Copyright Modernization Act, and many others either underway or slated to begin soon. In light of such realities we need the best view of the landscape that we can get, and that is what we strive to do with our annual reviews and regular updates to our data sets. In short, doing this kind of research is about tooling up for the policy battles to come.
In these ongoing “battles over the institutional arrangements of the information economy” (Benkler, 2006), our research is about contributing to results that benefit the citizens and businesses they affect and not just the companies who stand to gain directly through policy influence and interventions. Such representations are typically partial, and they are certainly very strategic, designed to win policy battles rather than to offer rigorous and fair-minded analyses of the media world. Independent research like ours aims to counterbalance the record, but fully aware that the vast difference in resources for such efforts—consider, for example, that Bell maintains a stable of lawyers reputed to be 40 or more deep, Telus and Rogers in the mid-20s, and Quebecor more than a dozen—weighs against the idea that we can balance the scales. Nonetheless, there is value in contributing what we know about the communications and media services and markets in Canada because increasingly they are the foundations upon which more and more of our economy, society, polity and daily life depend.
This work is also important at present because the internet seems to be going through something of a phase shift that is as much about politics, culture and the structure of markets as it is about technology and narrowly conceived economic issues. To put things bluntly, a confluence of events has led to a situation where, for the first time in their history, “there’s blood in the water” when it comes to the towering and dominant positions that the global internet giants like Facebook, Google, Netflix, Amazon and Apple have carved out for themselves in their respective fields.
Of course, these entities loom large in Canada, but how large? While there are opinions galore on the issue, evidence is scant. As evidence in this and our following report shows, some of these entities may in fact be on a path to monopoly in some markets. This trend has instigated a revival of the antimonopoly movement in the US and efforts to put the internet giants’ blackbox algorithms under much greater regulatory scrutiny than most would have even thought possible just a few years ago. Interest in questions about privacy and “surveillance capitalism” have also gained momentum in light of the deepening integration of mobile phones, broadband connections, search engines, social media platforms, internet retailers, and so on, into our daily lives. Interest in this area has risen also in the wake of, for instance, Max Schrem’s tenacious and successful victory in spearheading the Europe versus Facebook battle, which begot new rules under the European Union’s General Data Protection Regulation. Those new rules, in turn, have the potential to reshape the stage upon which we interact with the giant internet platforms, to say nothing of the terms of the trans-Atlantic trade in personal information. Edward Snowden’s revelations of systematic Anglo-American “mass internet surveillance”—with the aid and complicity of governments in Europe and elsewhere—has also put questions on the table like never before about how the communications and media infrastructures that we depend on are organized, controlled, spied on and used.
While some smell “blood in the water”, there is also a sense that we are being propelled hastily over the cliff, as some go for policy victories that would have been unthinkable just a short time ago and which would probably be better if they stayed that way. To wit, the headlong rush to harness Facebook, Google, Twitter, and other internet intermediaries in order to crack down on “fake news”, mass piracy, counterfeit goods, terrorist propaganda, and so on, by treating the platforms in the same way as traditional “publishers” (or broadcasters) is one area that comes to mind. Experience to date, as we will see later in this report, already shows these companies to clumsy and ham-fisted when it comes to making smart decisions about content and context. The idea that they should take on content filtering and blocking efforts on their own, or be subject to inapt or outmoded regulatory models, threatens to open the sluice gates to a never-ending list of demands. Unless such compulsion were to arise from, and be guided by duly constituted legal oversight by parliaments, the courts, and administrative agencies, such demands will likely make the “black box” nature of internet platforms ever darker and less easy to penetrate, and thus less accountable—all buttressed by even stronger free speech claims because the internet giants get to claim the hallowed status given of publishers. So, while the need to regulate the internet companies is on the horizon, doing so in a way that can identify and achieve progressive goals will require careful consideration–informed by empirical evidence of the type we are dedicated to collecting.
In addition, our data and analysis suggest that a healthy amount of skepticism should meet claims that the soaring revenues and sky high profits of the internet hypergiants come off the backs of “content creators” and from cannibalizing the revenue that professional journalism and the music, film, television and publishing industries need to survive, as Jonathan Taplin contends in Move Fast and Break Things. Taplin’s polemic against the “vampire squids of Silicon Valley” appears to have found a kindred spirit in Canada with the criticisms and condemnation often leveled against Google, Netflix and Facebook and their ilk here. While sympathetic to Taplin’s politics and plea for cultural policies fit for the “internet age”, and others who share them, his empirical analysis is badly flawed and the lessons taken from them are misguided as a result—for reasons that this report will make clear.
At their heart, such efforts ignore the wholesale transformation of the content media away from advertising revenue as a mainstay and toward the “pay-per”, subscriber fee-based model. Such efforts are emblematic of a tendency to still think in terms of “closed systems”, where one part of the “broadcasting system” is intentionally biased in favour of funneling money and attention to another node in that system—as has been the case with respect to cable TV in Canada since the 1960s—rather than a more open model in which everything fits together in a more modular way, more like Lego building blocks than a unitary “telecommunications system” or a “broadcasting system”.
To get away from the “closed system” approach and in furtherance of a realistic understanding of the dynamics that characterize contemporary communication developments, we need to examine how the biggest media groups in Canada—Bell, Rogers, Shaw, Quebecor and Telus (the “big 5”)—fit into the picture. First of all, the situation in Canada is unique insofar that all the main commercial TV services are owned by telephone companies. We must also ask if the “big 5” and other interests in Canada really are as challenged by the US internet giants as many commentators make them out to be? The answers to such questions have significant implications, as we observe in this and the following report.
To get a sense of all the moving parts, we need to understand the many media markets these and other companies operate in and whether, simply put, they are becoming bigger or smaller in terms of revenue and more or less profitable over time. The answers to those questions informs our understanding of how these entities interact and sometimes compete with companies like Netflix, Google and Facebook. The answers also imply something about the terms of debate that we need to have in response to assertions that we should discard the outmoded regulatory and legal frameworks set down a quarter-of-a-century ago, when the internet was just a glimmer in a few people’s eyes, in order to unshackle Canadian players so that they can rise to the challenge posed by the internet hypergiants and the shift to what they call, amorphously, “the digital media universe”.
In sum, the media’s place in the economy, society and our everyday lives is changing dramatically and up for grabs. What’s at stake is not just numbers and economic trends but what kind of media we want and deserve, and that are fit for a democratic society. Some communication historians call times like these a “critical juncture”, or a “constitutive moment”, when decisions made will become embedded in technology, markets and institutions, and then press down on us for a very long period of time thereafter, perhaps a century or more if the lessons of “the industrial media age” offer any guide to the “internet” or “digital media age”. The CMCR Project does its best to engage with such realities in a bid to help secure the communication and media that we need and deserve.
Summary of key findings and insights from this report include:
- The network media economy has quadrupled in size from $19.4 billion in 1984 to $79.3 billion last year;
- mobile wireless and internet access services continue to grow at a quick clip, with revenues rising to $24.4 billion and $10.2 billion, respectively, last year; while cable, IPTV and satellite TV services drifted downwards to $8.7 billion and wireline revenues continued their long term fall to $14.1 billion in 2016.
- the adoption and use of wireline internet access is high in Canada relative to other OECD countries, but speeds are mediocre, prices high and data caps extensively used and low whereas in most comparable countries they are rare and not as punishingly expensive;
- mobile wireless (i.e. the mobile internet) adoption in Canada ranks poorly against comparable countries. Canada ranks a lowly 24th out of 35 OECD countries in terms of adoption. Canada fares better on the measure of mobile data use, although it is still below average:
- it was 1.4 GB per subscriber per month in December 2016, well below Korea (4.3 GB), Japan (3.4 GB), US (3.4 GB), Sweden (6.1 GB) and Australia (2.2 GB);
- nearly one-in-three households in the lowest income quintile do not subscribe to a mobile wireless service, while just a little over one-in-five of those on the next rung up stand in the same position.
- the cost of media devices is plunging but the cost of communication services like broadband internet access, mobile phone and cable TV (including IPTV) continue to rise briskly relative to consumer price index;
- Subscriber fees outstripped advertising revenue by a nearly 5:1 ratio in 2016. The “pay-per media” are vastly more significant than advertising-based media;
- Advertising spending has been in decline relative to the media economy, in inflation-adjusted “real dollars”, and on a per capita basis since 2008. On a per capita basis, it was $347 per person last year—down from $380 in 2012.
- TV advertising spending also peaked at $112 per capita in 2011 but fell to $90 last year. Subscriber fees account for more than half of all TV revenue. TV remains a pillar of the internet- and mobile wireless-centric media ecology, but the ways in which it is accessed and financed are changing.
- Advertising is in relative decline but internet advertising soared to $5.5 billion last year.
- Internet advertising is becoming more concentrated. The top ten internet companies now account for 87% of all revenue, up from 77% in 2009.
- Google and Facebook dominate the internet advertising market, with nearly three quarters of the market between them in 2016—up from a little under two-thirds a year earlier;
- Bell, Rogers, Telus, Shaw (Corus), Quebecor’s (Videotron), Google, CBC, Facebook, Sasktel and Postmedia are the ten largest media companies in Canada, in that order. The “big 5” Canadian companies’ revenues are many times higher the Canadian revenues of the US internet giants.
- The telcos in Canada own all the major TV services, except the CBC. This arrangement stands in contrast to those in the US, UK and most of Europe. This helps explain why broadcast TV and stand-alone internet streaming options have fared poorly in Canada relative to those countries;
- Netflix had an estimated 5.3 million subscribers and $517.8 million in Canadian revenue in 2016—more than Quebecor’s TV operations (excluding cable).
- Telus, Bell, MTS and SaskTel had over 2.6 million IPTV subscribers between them at the end of 2016, making up nearly 24% of cable TV subscribers and 21% of revenues. Competition between the telcos’ and cable companies’ video distribution platforms has intensified in recent years;
- Cable “cord-cutting” is real but modest. Total subscribers have drifted downwards from 11.5 million in 2013 to 11.2 million last year. Accounting for population growth, however, the figure had fallen to 79% of all households last year from 84.3% in 2012;
- Fibre-based broadband infrastructure is under-developed by international standards in Canada, and expensive. Penetration levels are less than half the OECD average. Canada ranked 24th out of 34 OECD countries in 2016 in terms of fibre-to-the-doorstep—the internet infrastructure of the 21st Century;
- The CRTC’s actions over the past few years respond appropriately to reality and match those of regulators in other jurisdictions, including in the EU and FCC in the US—although the latter’s regulatory framework is being hastily dismantled by the Trump administration’s appointed chair to the FCC, Ajit Pai;
- Threats to the “broadcasting system”—e.g. cord-cutting, Netflix, Google, etc.—are real but exaggerated. Such calls should be rejected, although there is no reason why the Finance Minister (Morneau)—not the Cultural Minister (Joly)—shouldn’t require them to pay corporate and sales taxes and, maybe, peg the additional tax revenue that arises from such actions to greater support for cultural policy objectives as part of the federal budget;
- Appeals for an “internet levy” and selective use of data caps and zero-rating to promote Canadian content should also be rejected. They are out of touch with how people use mobile phones and the internet and the need to make “connectivity” and “culture” policies work together without the latter running roughshod over the former;
- Newspapers are in turmoil, and massive upheaval continues to accurately describe their plight. The turmoil stems from self-inflicted wounds and general trends in the economy, especially the relative and per capita decline in advertising revenue and the diversion of what’s left to Google and Facebook;
- The number of full-time journalists has not plunged but grown modestly. The ratio of public relations, advertising and marketing professionals to journalists, however, has soared from four-to-one in 1987 to ten-to-one at present;
- A fairly wide-range of international news organizations figure amongst the leading internet news sources consulted in Canada: e.g. the New York Times, Guardian, Washington Post, BBC, Yahoo!-ABC, etc.
- The collapse of advertising reveals the fact that people have never paid the full-cost of a general news service. Such services have long been subsidized by wealthy patrons, advertising, or the public purse. It’s time to figure out who will pay what all over again, and while the “pay-per” model will pick up some of the slack, it won’t be enough and comes with the additional problem that it aggravates information inequality
Introduction
Every year for the past five years the CMCR Project has put out a series of reports on the state of the telecoms, internet and media industries in Canada (see 2015, 2014, 2013, 2012 and 2011). This report is the first installment in this year’s series.
The report examines the development of the media economy since 1984, with the “media” defined broadly to include mobile wireless and wireline telecoms services; internet access; cable, satellite & IPTV; specialty and pay TV; broadcast TV; radio; newspapers; magazines; music; and internet advertising.
Its aim is to get a good sense of how all the different sectors of the telecoms- internet and media industries have developed over time, and how they fit together to form what we call “the network media economy”. It is also to determine which of these industries are growing, stagnating or in decline, while shining light on those that are showing signs of renewal and recovery, like the music industry. It also examines whether over-the-top services (OTT) like Netflix, CraveTV, Spotify, and trends such as cord-cutting, are delivering lethal blows to established media or helping to expand the size and diversity of the media economy overall.
A key development identified is the extent to which advertising-supported media (i.e. broadcast television, radio, newspapers and magazines) are being eclipsed by the “platform” and “pay-per” media industries. The “platform” segments of the media—i.e. the pipes, bandwidth and spectrum that people use to connect with one another, to media content, the internet, and so forth—accounted for just under three-quarters of all revenue by the end of 2016: i.e. mobile wireless, wireless telecoms, ISPs, as well as cable, DTH and IPTV services. Platform media and content media that rely primarily on subscriptions and direct purchases constitute the “pay-per” media and their revenue now outstrips that of advertising-supported media, including internet advertising, by a ratio of nearly five-to-one.[1]
Indeed, while overall advertising revenue inched upwards over the past decade, on a per capita basis it fell (see TVB, 2016). The stagnation of advertising revenue has little to do with the internet and much to do with the anemic period of economic growth that has held sway since the “Great Financial Crisis of 2008”. The growth in advertising revenue that has occurred has gone almost entirely to internet advertising. The distribution of that revenue is also becoming more concentrated.
[1] Pay-per media refer to media that people pay for through subscriptions or other direct modes of payment. They generally include platform media plus subscription-based content media such as pay & specialty TV, OTT, video games, movies, music and books. They are different from media that are subsidized by advertising or government-funding (as in the case of the CBC) or wealthy patrons (as in the “high arts”). I take the “pay-per” term from Vincent Mosco’s Pay-Per Society (1989). The video game, film and book industries are not included in this report because of data availability limitations, but see PWC, 2017 for evidence that would, more or less, bolster the point being made here.
The top ten internet companies’ combined share of online advertising revenue in 2009 was a little over three-quarters but by last year it had climbed to 87%.
Google and Facebook alone accounted for an estimated 72% of the $5.5 billion in internet advertising revenue last year (see the “Top 20 w Telecoms” sheet in the Excel Workbook). Both have taken advantage of the rise of the mobile internet to consolidate their duopolistic control over the internet advertising market in Canada.
The upshot of these dynamics is two-fold. First, well-established content media that have relied heavily on advertising are being hit hard: e.g. broadcast television, radio, newspapers and magazines. Second, in an increasingly internet- and mobile wireless-centric world, connectivity and subscriber fees, not content and advertising, are king (see Odlyzko).
Some have taken this drift of events as justification for calls to apply a levy to internet service providers (ISPs) and mobile wireless carriers to support cultural policy goals.[1] The new Creative Canada Policy Framework announced by the Department of Canadian Heritage Minister Melanie Joly in September 2017, however, rejected the idea. An ISP levy is ill suited to the aims sought by its advocates for the same reason that a jackhammer isn’t used to drive a nail: although the aim of shoring up genuine public goods such as professional journalism and original audiovisual media content created in Canada is laudable, the means (taxing the platform sector) is simply not a measure that’s proportionate to the task. The fact that people have never paid the full freight for such media goods needs to be dealt with head-on instead of taking tools built over the past fifty years within the context of a cable television-centric “broadcasting system” and applying them holus bolus to cellphones and the internet. Internet and mobile wireless connectivity should not be recast in the image of the “broadcasting system”, not least because it constitutes a small part of what people use their broadband and mobile phone connections for.[2]
This does not mean that we should take a narrow, squinty-eyed view of the matters at hand. Instead, we need an ambitious “connectivity policy” and “cultural policy”, and both need to be suitably funded and independently administered. The former should not be put in the service of the latter. Why?
Because, as a general rule, we should not tax a more expansive general purpose network whose effects are felt across society, the economy and our everyday lives to support targeted cultural policy aims. To do so would cast aside the basic principle that policy means should be proportionate to the objectives sought. The fact that “connectivity” and “culture” policies deal explicitly with public goods also means they should be dealt with directly through general taxes and politically—in the public arena—rather than through a labyrinth of opaque inter- and intra-industry funds and cross-subsidies, as is currently the case. The pledge in the Creative Canada Policy Framework to make up the lost contributions from broadcasting distribution undertakings to the Canadian Media Fund as “cord-cutting” continues apace from the public purse is a step in the right direction.
Crucially, it is the creators of cultural goods, whether journalism, television, film or video games, who should be the targeted beneficiaries of whatever cultural policy efforts are adopted in the days ahead, not distributors, because the latter are, for the most part, doing just fine. Making telecoms operators integral to the achievement of cultural policy goals would also inevitably embed conflicts of interest into the heart of media and cultural policy, in no small measure because of the significant extent of vertical integration in the communications market.
We also need to realize that “connectivity” policy is also “culture” policy in its own right. It fosters “mass self-expression” and widespread social interaction across time and space (see Castells, 2009; Rainie & Wellman, 2014). What we typically think of as culture policy tends to be institutional and professionally-oriented, and often elitist and anchored in conservative notions of merit, although that is not reason to reject cultural policy but rather as caution as to what must be avoided. More formally, the golden rule of common carriage (aka Net Neutrality) that dictates that those who control the medium shall not control the messages flowing over it is violated when mobile wireless and broadband internet infrastructures are leveraged to promote some kinds of messages over others – no matter how meritorious they are.
We’ve been here before. In the late-1960s and 1970s, the real potential to develop cable communications networks as multi-functional common carriers was forsaken in favour of developing them as limited purpose broadcasting distribution networks with the explicit goal of tilting the media ecology in favour of Canadian TV. Frankly, that was a mistake. Similar mistakes must be avoided today in relation to broadband internet and mobile wireless networks, because these networks already support an even wider and still expanding diversity of uses, users, services and apps than cable ever did.
These and a wide sweep of other critically important issues are now on the table in ways they have not been for years. For one, the CRTC continues to address a wide range of telecoms, internet and television issues after having found core segments in each of these markets woefully uncompetitive and unresponsive to people’s needs and desires.[3] Beyond this, questions about whether there should be an “ISP tax” or a specific “Netflix tax” earmarked for the production of Canadian content seem to be perennially on the table, seemingly dead one day but resurrected, zombie like the next. Beyond such specific taxes and the thicket of issues they raise about cultural policy in the “internet age”, others see no reason why Netflix, Google, Facebook, Apple or any other internet giant delivering services in this country should not pay income and sales taxes like every other business—a stance that this author agrees with, but one, it is worth repeating, that will likely be dealt with by the Finance Department, not the Department of Canadian Heritage.
Finally, the fact that Google and Facebook are consolidating their control over a shrinking pool of advertising revenue is sharpening the conflict between them and the media companies that still rely on advertising to survive The internet companies are now facing more pressure to bring them under tighter regulatory control than they have ever faced in their history, for better and for worse—as we shall see. The widespread concerns with “fake news” and their potential impact on political campaigns and elections in the US, UK, France, Germany and elsewhere has only reinforced the drift, making them more vulnerable than would have been possible even a year or two ago. There is a sense of “blood in the water” as the push to bring them to heel seems to grow by the day. In my view, there is, in fact, much potential for good that could come out of these efforts but also a lot that is deeply troublesome, and made to feel all the more so by the fact that we seem to being sped along by a strange confluence of events coming from disparate corners of the planet, literally and figuratively.
At the end of the day, without a good body of data from which to address these difficult questions, hyperbolic claims and vested interests tend to pollute public and policy discourse about the state of the media in Canada and what might be done in response, if anything. This report aims to constructively add to the discussion of these issues out of sense that we are currently living in a constitutive moment when choices made now or in the near future will have enduring and cumulative effects on what the media and communications ecology will look like for much of the rest of the 21st Century.
The Network Media Economy in Canada: Growth, Stagnation, Decline or Recovery?
The network media economy continues to expand considerably. Indeed, between 1984 and last year, revenue quadrupled from $19.4 billion to $79.3 billion (current $). Figure 1 below illustrates the trends.
Figure 1: Growth of the Network Media Economy, 1984–2016 (current $, millions)
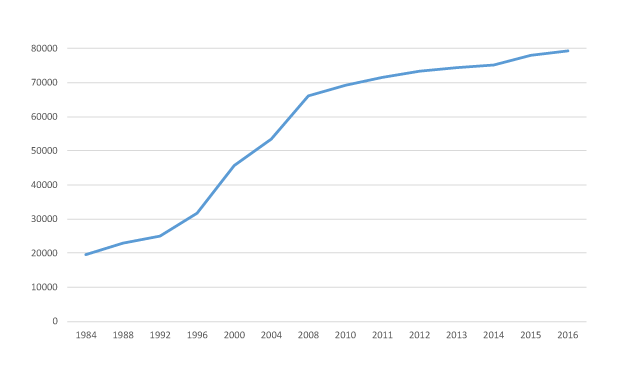
Source: see the “Media Economy” sheet in the Excel Workbook.
While the media economy in Canada is often seen as a pygmy amongst giants, especially relative to the colossal size of the US media economy, it is still among the ten biggest in the world. Of the thirty countries examined in Who Owns the World’s Media, the sum total of which account for 90% of the world’s media revenues, Canada ranked 9th (Noam, 2016, pp. 1018-19).
The media economy in Canada, as elsewhere, is also becoming ever more internet- and mobile-centric. “Platform media” (i.e. wireline, mobile wireless, ISPs and cable, satellite and IPTV) have grown much faster than the “content media” (i.e. television, radio, newspapers, magazines, music), especially those that depend on advertising. Platform media altogether accounted for nearly three-quarters of all revenue in 2016. To illustrate the point, while internet advertising has grown swiftly into a $5.5 billion industry and now represents 7% of all revenue across the media economy, internet access is close to double that size (see the “Media Economy” sheet in the Excel Workbook).
Figure 2 below illustrates the divergent development trajectories for the “platform media”, “content media” and “internet advertising” over the past thirty years. The most outstanding observations are, first, the vastly large scale of network media relative to “content media” and, second, the much quicker pace of growth of the former relative to the latter. Finally, while internet advertising is crucial, and growing fast, its place within the overall scheme of things is more modest than one might assume given all the attention paid to it and the sectors of the media that either depend on, or are affected by, its rapid growth, to say nothing of the two behemoths that have been its biggest beneficiaries, i.e. Google and Facebook.
Figure 2: Development of Platform Media vs Content Media and Internet Advertising, 1984-2016 (current $, millions)
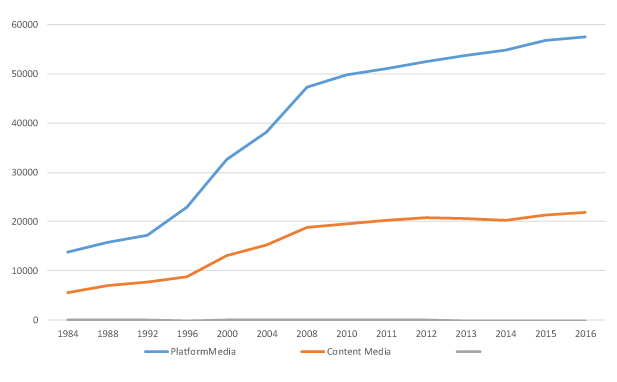
Source: see the “Media Economy” sheet in the Excel Workbook.
Figure 3 goes a step further by separately depicting each sector covered in this report. While all areas of the telecoms-internet and media industries have grown substantially over the long-run, there are unique differences among them that merit closer attention.
Figure 3: Separate Media, Distinct Evolutionary Paths and the Network Media Economy, 1984–2016 (current $)
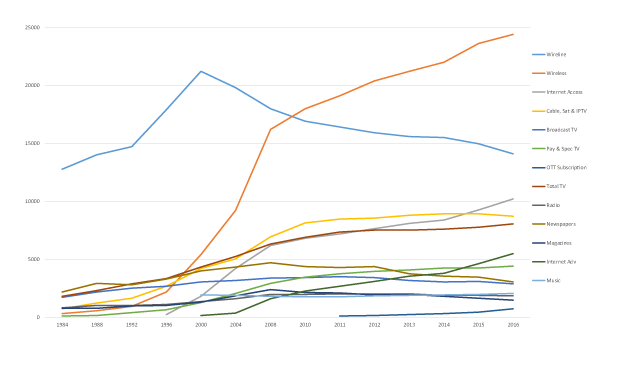
Source: see the “Media Economy” sheet in the Excel Workbook.
The rise of wholly new media sectors – e.g. mobile wireless, internet access, pay and specialty TV, OTT, and internet advertising – has added immensely to the size of the network media economy. It has become much larger and structurally more complex as a result.
Another thing that stands out in Figure 3 is the sharp kink in the revenue lines since 2008 for all sectors on account of the impact of the global financial crisis. Growth has fallen to roughly two percent per year on average ever since—half the rate of the previous half-decade. Switch to inflation-adjusted dollars and the size of the media economy has inched up slowly since 2010 amidst the uncertain economic times.
The financial crisis and economic downturn have had an impact on all media, but the severity of the impact has varied greatly. After 2008, the earlier rapid pace of growth for mobile wireless, internet access, broadcasting distribution undertakings, specialty and pay television services and even internet advertising slowed. It declined outright for wireline telecoms, direct-to-home satellite, cable television, broadcast television, newspapers and magazines. The music industry, in contrast, went into decline early in the decade, before bottoming out in 2012, after which it appears to have turned a corner (see Picard, Garnham, Miege, Vogel on the relationship between the fate of the media economy and the general economy).
Table 1 below gives a snapshot of which telecoms, media and internet sectors have grown, stagnated, declined or recovered in the past few years.
Table 1: Growth, Stagnation, Decline and Recovery in the NME, 2016
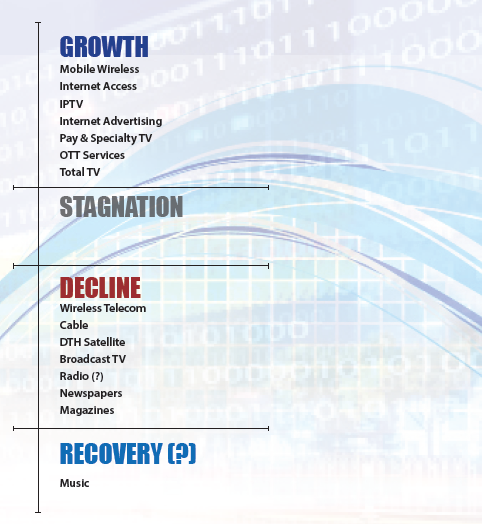
Source: see the “Media Economy” sheet in the Excel Workbook.
The Platform Media Industries: Bandwidth is King, not Content
The platform media industries have grown enormously, from $13.8 billion to $57.4 billion between 1984 and 2016. Table 2 below shows the trends. They account for approximately 72% of all revenue, and are thus the fulcrum upon which the media economy pivots.
Table 2: Revenues for the Platform Media Industries, 1984-2016 (current $, millions)
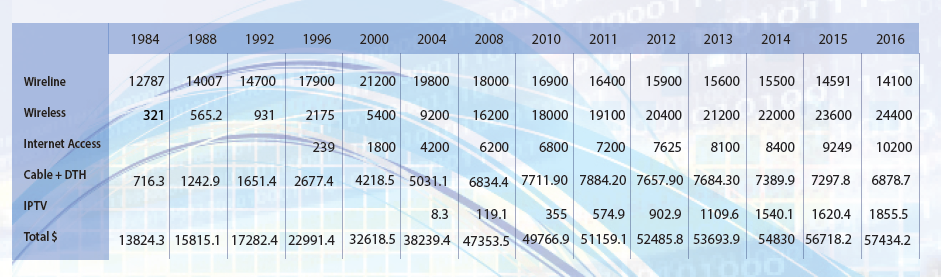
Source: see the “Wireline”, “Wireless”, “ISPs” and “CableSatIPTV” sheets in the Excel Workbook.
Mobile Wireless
Mobile wireless services have expanded quickly since the turn-of-the-21st century to become a cornerstone of the digital media ecology. Revenue grew more than four-fold during this time, from $5.4 billion to $24.4 billion last year. Wireless services also overtook plain old wireline telephone services in 2009 based on revenue, while in 2014 the number of Canadian households subscribing exclusively to mobile services for their voice calling needs exceeded those relying exclusively on landlines for the first time (CRTC, 2015, p. 1).
The growth spurt in mobile wireless services has tracked an expanding array of devices that people use to connect to wireless networks–feature phones, smartphones, tablets, wifi connected laptop PCs, and so on—and a widening array of services. Mobile data traffic doubled in Canada between 2012 and 2013, and has continued to grow in the 40-60% range every year since. Cisco projects that mobile data traffic will grow five-fold between now and 2021.
In terms of mobile wireless and broadband use, however, the message is mixed. By the standards of OECD countries and other large media economies for which data is available (from Cisco), Canada ranks in the top-third for wireline broadband adoption and internet data use is high at 63GB per month (this is above average and in the top 3 out of a dozen countries); however, levels of adoption and data use for mobile wireless (i.e. the mobile internet) range from very poor to decent.
Mobile data use by the “average subscriber” in Canada was 1.4 GB per month at the end of 2016, significantly below the average of the countries surveyed and much lower than Korea (4.3 GB), Japan (3.4 GB), the US (3.4 GB), Sweden (6.1 GB) and Australia (2.2 GB). There are many reasons for this, and price and affordability are certainly two of them, but much of the explanation lies with the structure of these markets in Canada and of the leading firms that operate in them; incoherent policies and inconsistent actions by regulators, including the CRTC, Competition Bureau and ISED/Industry Canada, play a key role to (see Middleton, 2011 and Benkler, et. al. 2009, on the latter point).
Like other sectors, revenue growth in mobile wireless slowed post-2008. Some argue that this is the result of a maturing market (Church and Wilkins, 2013, p. 40). While the pace of growth has slowed relative to the torrid pace of growth in the late-1990s and early 2000s, this single-focus explanation is myopic.
The pace set during the early uptake of new technologies cannot be sustained forever, however, and mobile wireless has unsurprisingly followed the classic “S-pattern” of diffusion, i.e. slow adoption at first, rapid uptake as the new technology becomes mainstream, and a return to flatter growth thereafter as “late adopters” come on board.
However, more than just following the typical “technology diffusion curve”, the flattening of mobile wireless growth dovetails perfectly with the financial crisis. In fact, revenues for the network media economy worldwide declined between 2008 and 2009 and some of the world’s biggest media economies shrank in the next few years thereafter (e.g. Germany, UK, Italy and Spain), while others stalled (e.g. Japan and France) or grew only modestly (e.g. US, Canada and Korea). Mobile wireless revenues were not hit as hard as other media sectors by the collapse of the dot.com bubble in 2000 or the Anglo-European financial crisis (2007-2008ff), but the recent let-up in the pace of wireless growth amidst such conditions is not surprising.
The “mature market” explanation also ignores the under-development of the mobile wireless market in Canada relative to all but a few of its OECD peers. CRTC data for 2016 shows that 87% of Canadian households had a mobile phone subscription at the end of 2016 (p. 305). The latest Statistics Canada data, as Figure 4 illustrates, also shows that the adoption of mobile wireless services, and other information and communications media, is highly unequal and stratified by income.
Figure 4: Household Access to Information and Communication Technologies by Income Quintile, 2015
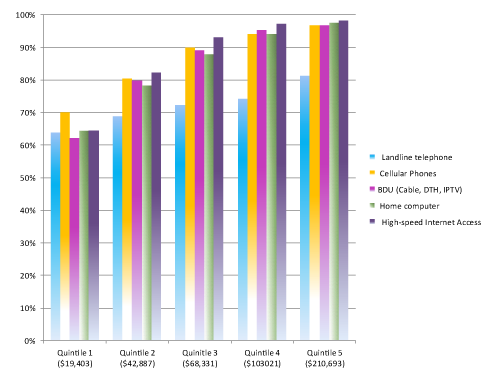
Source: Statistics Canada (2017). Dwelling characteristics, by household income quintile, Canada, 2015, in Statistics Canada, 2017. Survey of Household Spending.
For households in the lowest income quintile, nearly one-in-three do not subscribe to a mobile wireless service, while just a little over one-in-five of those on the next rung up the income ladder stand in the same position. At the opposite end of the income scale, however, mobile wireless penetration is nearly universal at 97%.
Rogers, Bell and Telus, and other observers content with this state of affairs often obscure the existence of such low levels of wireless penetration by touting the large proportion of subscribers who have smartphones. In fact, just a little over three-quarters of Canadian households have a smartphone (OECD, 2017; also CRTC, 2017, Table 5.5.12). Smartphone adoption in Canada, thus, has been rather slow on the uptake and is not a triumph to be celebrated but an index of a bigger problem that needs to be redressed, i.e. low levels of mobile phone adoption, high prices, and substantial inequalities in terms of adoption rates.
That this is so can be seen from the fact that Canada ranks a lowly 24th out of 35 OECD countries for broadband wireless penetration as of December 2016—well below levels in the US, UK, Denmark, Australia, and many other countries. Figure 5, below, illustrates the point. Moreover, this is a position that Canada has languished in for years (Benkler, Faris, Glasser, Miyakawa, Schultze, 2010; OECD, 2011).
Figure 5: OECD Wireless Broadband Subscriptions per 100 inhabitants, by Technology, December 2016
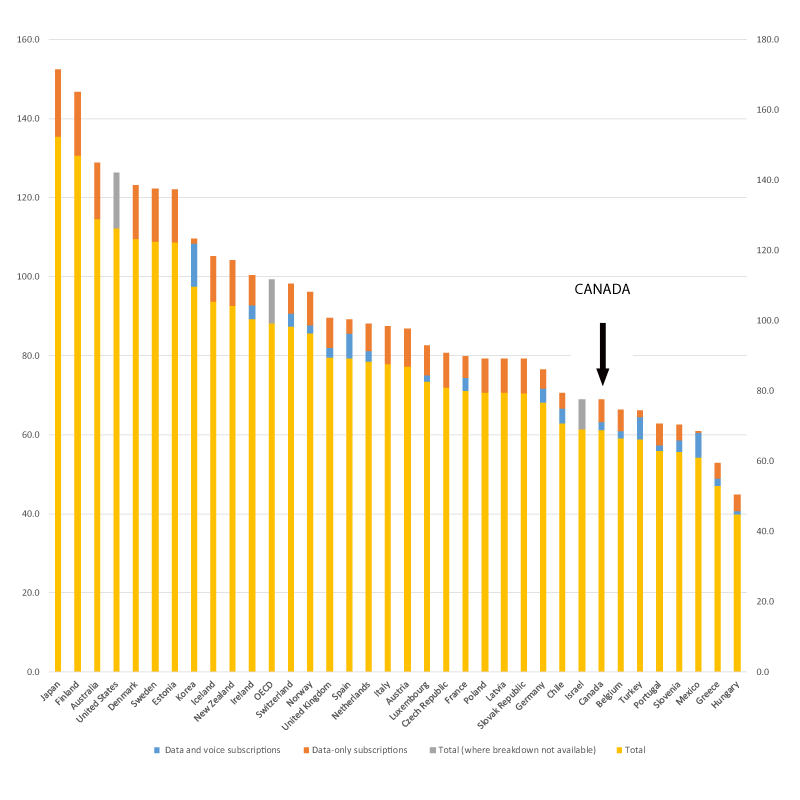
Source: OECD Broadband Portal.
Plain Old Telephone Service, Internet Access and Internet Protocol TV (IPTV)
While mobile wireless services are at the centre of the media universe, the wireline telecoms infrastructure—e.g. plain old telephone service (POTS), internet access, cable and IPTV networks—is still a central pillar in the network media economy. These services accounted for well over half of all platform media revenues (54.2%) in 2016. Mobile wireless services accounted for 43% while direct-to-home satellite services made up the rest.
Plain old wireline telecom revenues were estimated to be $14.1 billion (current $) last year—far off their high-water mark of $21.2 billion in 2000, but with the steep drop-off abating in recent years. Those decreases, however, have been offset by significant gains in internet access, IPTV and cable revenues. Telecoms and cable companies have also established or, more typically, acquired data centres, although the lack of available data does not allow us to gauge the size of this sector or the companies’ revenues in it with any precision.
Internet access revenues have grown immensely in the past decade, similar to mobile wireless. Internet access revenues were roughly $10.2 billion last year, up considerably from $9.2 billion the previous year, and well over five times what they were at the turn-of-the-21st century ($1.8 billion). As observed above, the adoption and use of wireline internet access in Canada is high relative to other OECD countries, but speeds are mediocre, prices high and data caps commonplace whereas in most places they are rare and not as punishingly expensive (OECD, 2016; FCC, 2017; ITU, 2017).
Like mobile wireless services, high-speed and broadband internet access are far from universal. According to Statistics Canada’s most recent data (2015), 87% of households have adopted high-speed internet access service (i.e. > 1.5 Mbps). Look at the uptake of services that meet the broadband universal service target of 50Mbps up and 10Mbps down adopted by the CRTC last year, however, and the number falls to 22% (see CMR 2017, Table 2.0.9). Thus, while access cuts strongly across urban vs rural and remote lines, people’s adoption of broadband is divided starkly along income lines. Figure 6 illustrates the point.
Figure 6: High-Speed Internet Access by Income Quintile, 2015
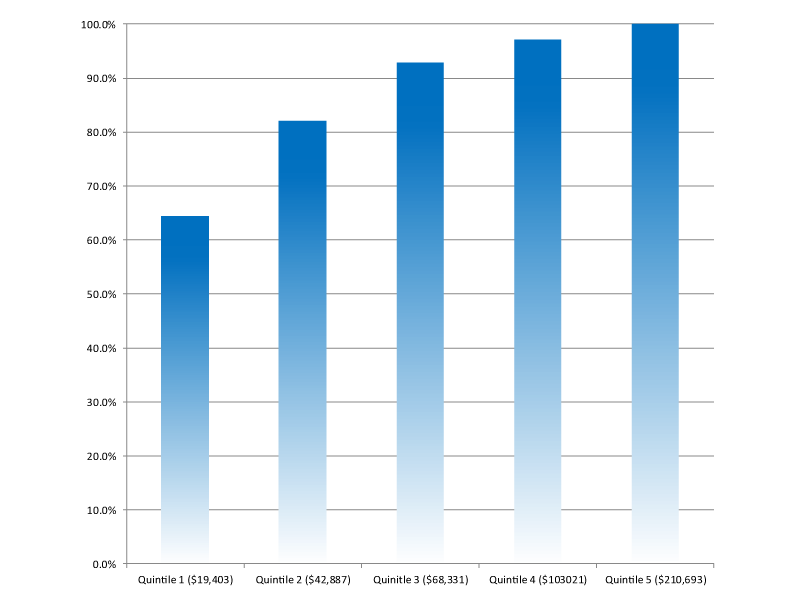
Source: Statistics Canada (2017). Dwelling characteristics, by household income quintile, Canada, 2015, in Statistics Canada, 2017. Survey of Household Spending.
A key recent development has been the rapid growth of the telephone companies’ (e.g. Telus, Bell, MTS, SaskTel) Internet Protocol TV (IPTV) services, that is, the incumbent telcos’ managed internet-based tv services that compete with traditional cable television services. The number of IPTV subscribers has more than tripled over the last six years, to 2,508,476 at the end of 2016. Table 3 below shows the trends.
Table 3: The Growth of IPTV Subscribers in Canada, 2004-2016
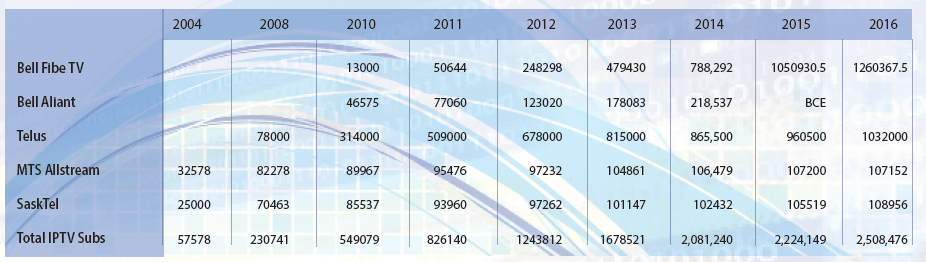
Source: see the “IPTV” data sheet in the Excel Workbook.
The telcos’ revenue from IPTV service has also increased sharply from $1 billion in 2013 to $1.86 billion last year–again, quadruple 2011 levels. Table 4 below shows the trends.
Table 4: The Growth of IPTV Revenues in Canada, 2004-2016
Source: see the “IPTV” data sheet in the Excel Workbook.
The subscriber and revenue figures reported in Tables 3 and 4 are slightly higher than those reported by the CRTC. This is likely because the CRTC’s data is taken from the end of August each year as opposed to the companies’ fiscal year-end, as we have done. The CRTC’s estimated “average revenue per user” (ARPU) is also lower than what the telcos cite in their audited annual reports. Lastly, the lack of consistent, full disclosure by both the telcos and CRTC further obscures the exact number.
The growth of IPTV services is significant for many reasons. First, the addition of IPTV as a new television distribution platform brings the telcos deeper into the cable companies’ traditional turf. By 2016, IPTV services accounted for roughly 21% and 24% of the TV distribution market by revenue and subscribers, respectively, a doubling of their market share in just four years.
The increased competition posed by IPTV hit the western provinces earliest where Shaw faces three companies that have been quickest to roll out IPTV services: Telus in Alberta and BC, SaskTel in Saskatchewan and MTS in Manitoba. From Ontario to the Atlantic, in contrast, Bell’s roll-out of IPTV services occurred later, softening (or perhaps delaying?) the competitive impact on Rogers, Quebecor, Cogeco and Eastlink – until around 2013.
Cable and satellite companies are losing subscribers to the telcos’ IPTV services as a result. Altogether, they have lost 2.4 million subscribers since 2009. Their revenue has also dropped by nearly 13% (~$1 billion) since the high point in 2011, as Table 5 illustrates.
Table 5: Cable & Satellite Provider vs IPTV Revenues, 2004-2016 (current $, millions)

Sources: see the “IPTV” and “CableSatIPTV” data sheets in the Excel Workbook.
Against the hew and cry about cord-cutting and industry pleadings for regulatory favours, the losses of incumbent cable providers should not be mistaken with an industry in peril (see the Miller Report, 2015 as an example of such claims). This is because almost all the cable and DTH satellite TV providers’ losses have redounded to Telus, Sasktel, MTS and Bell’s IPTV services. In fact, the total number of cable subscribers has dipped by two-and-a-half percent since its high point in 2011. Seen from another angle, however, the number of subscribers for all broadcast distribution services, as they are called in Canadian regulatory parlance, has slipped from 85.6% of households in 2011 to 79% last year (CRTC, 2017). These losses are real, to be sure, but they are hardly the calamity that some might have us believe.
Revenues overall continued to climb until 2014, stayed basically flat in the next year, then fell modestly in 2016, as Table 5 above illustrates. Overall revenue has fallen 2% in the last two years. Thus, while subscriber numbers have fallen more sharply, the impact of the blows has been softened by the fact that most of the subscriber loss to cable and DTH providers—notably, Rogers, Shaw, Videotron, Cogeco and Eastlink—has been offset by the growth of IPTV and steep increases in subscription prices as well. Indeed, the price of subscriptions has risen well-above increases in the consumer price index, as Figure 7 illustrates, and this continues to be the case (also note the steep rise in internet access prices since 2010).
Figure 7: The Price of Communication Services and Devices vs the Consumer Price Index, 2002-2016
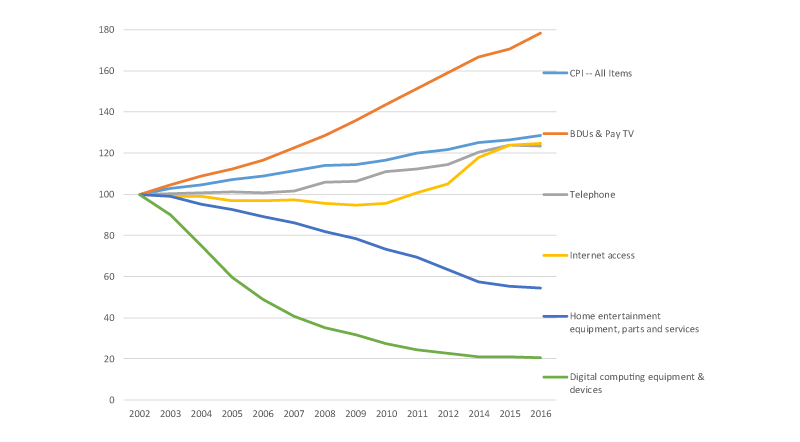
Source: Statistics Canada. Table 326-0020 – Consumer Price Index, annual (2002=100)
The trend indicated in Figure 7, in turn, partly justifies the CRTC’s efforts to promote the unbundling of cable TV packages and pick-and-pay options in its trilogy of “Talk TV” decisions over the past few years–against the protests of the culture policy and industry groups. The former want to retain and even extend the methods used in the past to the internet, while the latter mainly want the Commission to stand aside and let the industry do as it pleases, or for the CRTC to be dismantled altogether and the residual bits of its mandate handed over to the Competition Bureau (see the reports by the C.D. Howe Institute, the Fraser Institute, the Montreal Economic Institute and the MacDonald Laurier Institute, for example, on this point).
Against those complaints, however, the CRTC’s efforts match these and other realities of the communications and media markets; they are also firmly in line with efforts taken by the FCC in the US as well as by regulators in Europe. The backlash from the industry and “cultural industries community” against the Commission has been ferocious. This is a clear index of the stakes being disturbed, but not unusual and in line with similar responses abroad. Whether the Commission will continue to hold the line under the direction of its new Chair Ian Scott, a long-standing industry insider right up until his new role, remains to be seen.
While IPTV services are taking off in many cities across the country, a few things need to be kept in mind. First, it was the prairie telcos, followed by Telus, which took the lead in deploying IPTV in the early- to mid-2000s. Bell launched IPTV relatively late, first via its then affiliate Bell Aliant in 2009, before slowly rolling out the service in the high-end districts of Montreal and Toronto over the next two years—half a decade after MTS and SaskTel took such steps in the prairies. More cities have been added at a hastening pace since 2012 and subscriber numbers and revenue have risen significantly for the Bell Fibe service as a result. Bell’s slow start is due, at least in part, to its desire to minimize the impact of its IPTV roll-out on its existing investment in DTH satellite TV. It has turned the corner since, however, and last year it had more than 1.3 million IPTV subscribers; it has been the largest BDU in the country since 2014.
The telcos are also finally bringing next generation, fiber-based internet networks closer to subscribers, mostly to neighbourhood nodes and increasingly to people’s doorsteps. If the distribution of television is key to the take-up of next generation fibre optic broadband networks, as I believe it is, IPTV is a key part of the demand drivers for these networks (see below).
The rate of IPTV adoption in Canada is relatively high by international standards. About 18% of households in Canada subscribed to IPTV services by the end of last year. However, this lags behind countries such as France (where uptake of IPTV reached 41% of households), Korea (34%), the Netherlands (28%) and Singapore (26%), among others, as the UK regulator Ofcom notes, but is still higher than the US (10%), Japan (7%), Germany (6%), the UK (7%), Spain (17%) and Australia (4%) (p. 133).
While Canada has done reasonably well with respect to IPTV, the picture changes for fiber-to-the-doorstep (FTTP). 10% of broadband connections in Canada use FTTP—less than half the OECD average (21.2%). At the high end of the scale, in countries such as Denmark, Finland, Norway, Sweden, Korea, Japan, one third to three-quarters of all broadband connections are fiber-based. Canada ranked 25th out of 35 countries on this measure as of December 2016, according to the OECD. The following figure illustrates the point.
Figure 8: Percentage of Fibre Connections Out of Total Broadband Subscriptions (December 2016)
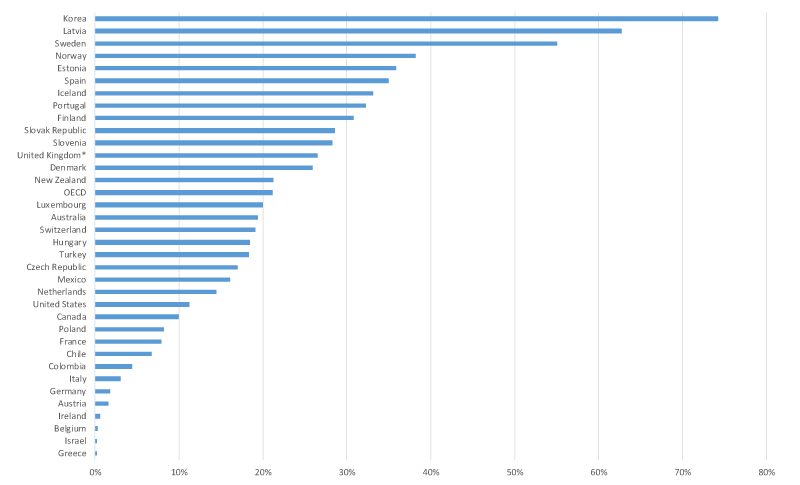
Source: OECD (2017). Broadband Portal, Table 1.10.
In sum, when it comes to fibre-optic networks, the prairie telcos and Telus were early leaders, not Bell. Globally, Bell’s late turn to IPTV and FTTP in Ontario, Quebec and Atlantic Provinces has also dragged Canada down in the comparative league tables.
The general evolutionary pattern that we see replays a long-standing practice for new services to start out as luxuries for the rich before a combination of competitive markets, public pressures and public policies turn them into affordable necessities for people at large (see Richard John with respect to the US history, Robert Babe for Canada). Current debates over access to broadband infrastructure are the latest iteration of this old story (Winseck Reconvergence, Winseck and Pike, John, Babe, Middleton). In fact, this could be seen last year when the CRTC set new standards for universal and affordable broadband internet service: minimum speeds of 50 Mbps up and 10 Mbps down to 90% of the population by 2021 (and the rest of the country a decade to a decade-and-a-half later), and with an unlimited option on offer—that is, an internet connection with no data cap, a concept that is actually the norm for most people in the developed world but rare and expensive in Canada.
A similar relatively large view of the public’s interests was pursued again this year when the CRTC adopted new rules that stop the telcos and ISPs from picking and choosing some services, apps and content that won’t count against your monthly data caps while everything else does. The practice is called zero-rating. While it can be attractive to the companies as a way to differentiate their services from those of competitors, and to some consumers who see this as way of getting data for “free”, such practices are largely marketing gimmicks propped up by artificially low data gaps and limited choices. Where data caps are large or non-existent, zero-rating is rarely used, whereas in countries where they are low, like Canada, it is far more common—at least until the CRTC’s ruling that effectively banned them. Data caps are also low and extensively used when markets are highly concentrated, as mobile wireless markets tend to be. They also tend to be relatively low and extensively used when telephone companies own many of the most important TV and entertainment services, as is in Canada, because under these circumstances, carriers’ have both the incentive and the ability to zero-rate their own services while counting everything else towards subscribers’ monthly data allowance. In other words, several structural features of broadband and mobile wireless markets in Canada bias them toward low and restrictive data caps, with concomitant pressures from service providers to adopt “zero-rating” as an alternative to bigger data allowances, or even unlimited services as the norm versus an expensive and rare option.
Ultimately, questions about zero-rating embody a philosophy of communication, one that says that when data caps are high or non-existent, people can use bandwidth to communicate, entertain, express themselves, work and do with as they want—within the limits of the law, of course. When they are low, however, what people can and cannot do with “the means of communication” at their disposal is restricted. Seen from this angle, the issues at stake are not just about prices but whether the speech and editorial rights of people, “content creators and distributors”, apps makers and service providers come first or those of the telephone companies and ISPs? The CRTC ruled in favour of the first group, and drew on the principles and history of common carriage[1] to do so (see Klass, Winseck, Nanni & McKelvey, 2016).
Both rulings—the new basic service standard and the zero-rating decisions—stake out a fairly ambitious view of what Canadians need and deserve in “the digital media age”. On the one hand, it includes affordable access to high quality communication services and gives priority to the speech and expressive rights of people, content creators, apps developers and service providers over the those who own and control the networks. Consequently, people don’t have to accept only what the market gives them because communication needs have been recast in a more expansive way in the light of conditions in the 21st Century.
The telephone companies don’t like this one bit, and are fighting to change it, although thus far without much success other than slowing down the momentum through well-known procedural tactics and delays. The upcoming reviews of the Telecommunications Act and Broadcasting Act, and the swapping out of the public interest friendly J.P. Blais for a known industry insider at this moment in time are all fraught with risk. Whether the hard-won advances will be maintained remains to be seen. On this latter point, however, it is essential to be cautious about casting aspersions as well because in at least two recent cases—the appointment of Daniel Therrien, a former national security specialist in the Harper Government to the Office of the Privacy Commissioner and Tom Wheeler’s position at the helm of the FCC in the US—new appointments have pursued course of actions that confounded early expectations, and with impressive results.
The Content Media Industries
The remainder of this post looks at the content media industries: broadcast TV, pay and specialty TV, over-the-top streaming services such as Netflix, Amazon Prime, CraveTV, Illico, etc., radio, newspapers, magazines, internet advertising and music. These sectors have grown greatly over the long-run of the thirty-plus years covered by our project, although hardly at all for most content media sectors since 2008.
In 1984, revenue for the content industries was $5.6 billion; in 2016, it was $21.9 billion. In inflation-adjusted dollars, revenue nearly doubled from $11.4 billion to $21.3 billion. Growth has been steady, except for a slowdown in the early 1990s recession and since the Great Financial Crisis” of 2008, after which revenues for almost every sector—except pay and streaming TV services, and the music industries in recent years—fell steeply, as Figure 9 illustrates.
Figure 9: Revenues for the Content Media Industries, 1984-2016 (current $, millions)
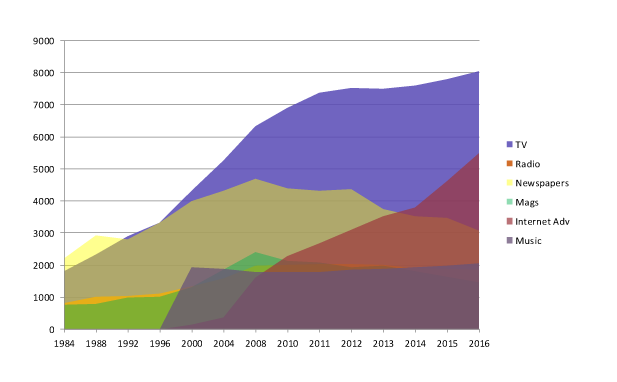
Sources: see the “Total TV”, “Radio”, “Newspaper”, “Magazine” and “Music” sheets in the Excel Workbook.
Trends in the content media industries tend to follow the twists and turns of the economy more tightly than the platform industries. This is because they depend on advertising revenue rather than subscriber fees, and advertising has long been a barometer for the general state of the economy. Given this, it is not surprising that advertising revenue has gyrated in lockstep with the state of the economy over the half decade: plummeting from 2008 to 2009, followed by sizeable increases in 2010, 2011 and 2012, shrinking again the following two years, respectively, before inching upward in each of the last two years. Overall, advertising spending has been around $12.9 billion per annum for the past five years, based on current dollars; in inflation adjusted dollars, however, it has fallen.
Perhaps more tellingly, advertising revenue on a per capita basis hovered between $370-380 per person between 2008 and 2012, but has fallen ever since to $347.43 last year (in real dollar terms). For TV alone, advertising revenue fell from roughly $110 per Canadian in the first dozen years of the 21st Century to just over $90 last year (TVB, 2016). Such trends fit the patterns sketched earlier almost perfectly (on advertising revenue, recessions and the economy see Picard, Garnham, Miege and Vogel). Consequently, media that rely the most on advertising have been hardest hit by a weak economy: e.g. broadcast TV, radio, magazines and newspapers.
The Rumoured Death of Television is Much Exaggerated
Broadcast TV
While advertising for broadcast television plunged in 2009 before rising again in the following two years, it has dropped greatly since, falling from $2.3 billion in 2011 to $1.8 billion in 2016. Television advertising revenue, however, has stayed relatively steady over time because losses in broadcast TV have been made up for gains in advertising on specialty cable and satellite channels like TSN, RSN, Discovery, the Cartoon Network, etc.
Cut-backs by the previous Conservative Government to the CBC of $126 million after 2012, and an additional drop of $121.1 million in payments from the Local Program Improvement Fund after 2013 until it was phased out completely by 2015, have further compounded the woes facing the CBC (see the CBC, Annual Reports and the CRTC, CBC Aggregate Annual Return French and English for these years).
Overall broadcast TV revenues, i.e. including the CBC and its annual Parliamentary funding, slid from an all-time high in 2011 of $3,501.7 million to $2,883.9 million last year—nearly a 20% decline. Eight local TV stations have closed since 2009: CHCA (Red Deer), CKNX (Midwest ON), CKX (Brandon), Sun News (Toronto), four Rogers stations, including City News in Toronto and three of its Omni stations in BC, Alberta and Ontario, respectively, and one other station in Kenora that was closed by Shaw early this year (Local News Research Project, 2017). By the end of 2016, broadcast TV revenue stood, more or less, where they were in 1998. It is truly a sector in peril.
Lay-offs and cut-backs are now a constant theme, and by 2015 local news staff had been cut by an estimated 4%, according to the Reuters Institute (p. 80). Indeed, just in 2015, at least 1,200 full-time television and radio jobs were cut: 460 at Bell, 439 at Rogers, 244 at the CBC, and 129 at CHCH (see here, here, here and here). Last year, Rogers cut another 200 jobs at its television, radio and publishing divisions, while Corus (Shaw) cut another ten positions at Global News when it cancelled its investigative news program, 16X19. Furthermore, a study prepared for the Friends of Canadian Broadcasting and Unifor by Peter Miller (2015) estimates that if current policy trends persist, up to half of the local TV stations in 56 small and mid-size cities across Canada, and up to 900 jobs, could be lost (p. 5).This would cut the core of local broadcast journalism and programming if it comes to pass.
It is precisely such conditions that spawned a review by the Canadian Heritage Parliamentary Committee and the CRTC on the state of local news in communities across Canada in the past year, each of which struggled to come up with solutions to the pressing problems the trends raise. In the meantime, some of these pressures will likely abate in the years ahead because of the Liberal Government’s decision in 2015 to inject $675 million in additional funds over the next five years into the CBC’s funding envelope. The step reversed the cuts undertaken by the last government in 2012, but does not counter the significant decline in advertising revenue.
In sum, four points help to explain the stagnation and recent decline of broadcast TV:
- declining advertising revenue since 2011;
- budget cuts to the CBC;
- the phasing out of the Local Program Improvement Fund between 2012 and 2014;
- the big four commercial TV providers – Shaw, Bell, Rogers and Quebecor – shift of resources to fast growing pay, specialty and other subscriber-based forms of TV (i.e. mobile, IPTV), while edging away from broadcast TV (see the CRTC’s Communication Monitoring Report, pp. 122-127 as well as Individual Financial Summaries for a list of the 119 pay and specialty services the big four combined owned as of 2016).
A crucial question, however, is why conditions in Canada are so bad relative to trends in the US and elsewhere. Broadcast TV is not enjoying a “golden age” anywhere, but the turmoil in Canada is especially severe.
Take, for example, the US, where the number of US households that are broadcast-only (that is, households that do not subscribe to cable but receive television over-the-air) has inched upwards in recent years, from 10% to 11%, according to the FCC’s two most recent Competition in the Video Marketplace (and here). There, broadcast network affiliates and independent TV stations “total day share of viewing” increased from 30% in the 2012-2013 to 32% in 2013-2014 and then again to 33% in the 2015-2016 season. Prime time viewing for the same TV stations also rose from 33% to 36% over the same period. Broadcast TV revenue rose from $24.3 billion in 2013 to $27 billion in 2015 as well (see paras 116-119 in both reports).
Looking further afield, Ofcom’s survey of fifteen countries reveals a mixed picture. Funding for public service media, it says, has been stable over the past five years, with modest changes either way in the countries surveyed. The average time spent viewing broadcast TV dropped by two minutes to 3 hours and 41 minutes from 2014 to 2015 (pp. 125-138). A year earlier, Ofcom noted that the “results for advertising revenue” varied but improved for broadcast TV in 10 out of the 14 countries in 2014, and in 8 out of 10 countries over the past five years (pp. 154-255). Nowhere, except Italy, did advertising revenue drop as much as it has in Canada.
Why is this? Miller explains that it’s a function of policies in the US that are more supportive of local broadcasting (pp. 4-5). There is no doubt some truth in that because localism is a bedrock principle in US communications policy, and has been for much of the past century. However, that is far from a sufficient explanation.
For one, it ignores events in the UK and other countries. Second, and crucially, it ignores the extent to which the crisis in Canada is a function of the structure of an industry where all the main commercial television services are owned by telephone companies. The deterioration of broadcast TV in this country mostly reflects an era of unprecedented consolidation. The main issue, however, is not consolidation just within the TV industry (which can be seen in many countries), but rather that Canada breaks ranks with its international peers in terms of its extraordinarily high levels of diagonal and vertical integration across the network media economy (for a fuller elaboration of this claim, see CMCRP, 2016).
While we must be cautious about identifying any one cause for the dramatically different situations in Canada versus the US (and elsewhere), one key difference stands out: broadcast TV providers in the US (and elsewhere) are not nearly as integrated into the telecoms-internet sectors and specialty and pay TV services as they are in Canada. Other than Comcast’s ownership of NBC Universal, for example, none of the main broadcast TV ownership groups in the US are owned by telephone companies or BDUs. Indeed, broadcast TV ownership groups in the US are sizeable entities in their own right: CBS, Sinclair, TEGNA Inc., Comcast, E.W. Scripps, Gray, Nexstar, Univision, Walt Disney, Fox, and Media General. Other than Disney (the ABC network) and Fox, broadcast TV ownership groups do not also own a fleet of specialty and pay TV services – again, unlike Canada (see FCC, 2016, para 84).
These groups compete with one another rather than functioning as arms of the telecoms giants which operate with one eye fixed on their rivals and the other on ensuring that whatever competitive strategies they adopt do not side-swipe other aspects of their vertically-integrated telecoms-internet and TV operators, as is the case in Canada. Much the same holds true in Europe.
These observations mean three things of critical importance. First, stand-alone broadcast TV services in the US compete vigorously with specialty and pay TV services as well as OTT rivals like Netflix, Hulu and Amazon Prime. As the FCC observes, “they have increased the amount of online offerings of their ad-supported prime-time programming on their owned-and-operated sites between 2014 and 2015” (see FCC, 2016, para 134). In fact, the catalogue of episodes they offered online “increased between 10.6 percent to 119.3 percent between the end of 2014 to the end of 2015” (see FCC, 2016, para 135). Notably, however, NBC (owned by Comcast) still limits access to its online library of programming only to people with a BDU subscription—much like its similarly structured counterparts in Canada.
Not surprisingly, US broadcast TV stations are also obtaining more revenue from internet advertising, which grew from 5% of their total revenue in 2012 to 7% in 2015 (FCC, 2017, para 119). The figure in Canada lags considerably, rising from 3.2% in 2012 to 5% last year—for all TV services (TVB, 2017).
Second, US, UK and European broadcasters and pay TV providers have been quicker to unbundle specialty and premium pay TV services from an underlying cable subscription to make them available OTT. Examples include Time Warner’s HBO, Disney’s ESPN, several services owned by CBS and Viacom, and some of the major sports league like the NFL and MLB. By not being vertically-integrated, and as “content media” providers only, these operators aim to get their content before as many people across as many platforms as possible with less concern that offering their services over the internet and mobile wireless connections might cannibalize the subscriber and revenue base of an affiliated BDU—at least not to the same degree, since BDUs are still their main source of revenue.
The contrast with Canada is striking, and it is this reality that underpins the CRTC’s TalkTV rulings, although one would be hard-pressed to discover such realities in the accounts provided by the Commission’s implacable foes. Looking ahead slightly, this point is driven home by the case of HBO. In the US, it is offered as an OTT service, but in Canada, where Bell owns the distribution rights, there is no such offering and smaller BDUs such as MTS have complained bitterly about not being able to get equitable distribution rights to premium pay TV rights such as HBO.
Third, not only are all the major commercial television services owned by telephone companies but there are no stand-alone mobile wireless operators left in Canada after Shaw acquired Wind last year, which is important because without a stand-alone, competitive mobile phone operator, prices for mobile phone service tend to be higher and data caps lower, and the cost of exceeding them steeper. The upshot is that low data caps and expensive overage charges deter the use of new media to consume all forms of audiovisual content, including broadcast TV (see Rewheel, 2016).
Consider the US, UK and EU, where there are major stand-alone mobile wireless operators such as T-Mobile, Vodafone, Hutchison and Free, for example. They are all fierce rivals to the integrated wireline/wireless operators. The Finnish consultancy Rewheel documents how stand-alone mobile or mobile-centric network operators that compete with groups that have both mobile wireless and wireline platforms offer more affordable data plans and data caps on 4G LTE services—i.e. those that are well-equipped to handle watching TV on wireless devices—that are between two and eight times higher than those of diagonally-integrated groups (see Rewheel, 2016).
None of these points are discussed by the various reports prepared by Miller on behalf of the “cultural industries communities” (e.g. ACTRA, CMPA, Unifor, Friends of Canadian Broadcasting, etc.) or by the implacable foes of the CRTC and other policy makers at the Competition Bureau and the Department of Canadian Heritage. That none of the recent reports from these groups or the C.D. Howe Institute, the Fraser Institute, the Montreal Economic Institute or the MacDonald Laurier Institute address these structural realities while chastising policy and regulation as the source of the content media industries’ woes is a major concern. They reflect the extent to which questions about media ownership and the structure of media markets are “off-limits” in the mainstream discourse. Instead, such efforts strive to change government policies in favour industry interests rather than dealing with the structure of the network media industries and the biggest players in them.
Pay and Specialty (Subscription) TV
For all the woes affecting broadcast TV, the fact of the matter is that the overall TV universe is doing well, although again, not without issues that need to be addressed, and with all the same realities just described bearing down hard on its evolution. Yet, climb down from the lofty heights of industry-friendly conventional policy rhetoric and one discovers fundamental changes that are taking place and new centres of growth and development. The real growth in television has been in subscriber fees and the pay-per and OTT streaming models of TV, as is the case in many countries around the world.
The UK regulator, Ofcom, underscores the point: “Subscription revenues [worldwide] continue to be the key driver of this growth, rising by 5.4% to reach £125bn, just over half of total revenue”, and a cumulative annual growth rate of 5.3% over the last five years (Ofcom, 2015, pp. 139-141). The same applies to Canada.
Once we widen the lens to look at the fastest growing areas of television, it is clear the chorus of voices declaring the supposed “death of television” are wide of their mark: specialty and pay TV services, OTT services, mobile TV, IPTV, and television distribution have done especially well. Indeed, pay and specialty TV services have been fast growing segments since the mid-1990s, and especially so during the past decade, although that pace has slowed in the last year or two.
Specialty and pay TV revenues eclipsed those of broadcast TV in 2010, when revenues reached $3,474.6 million. By 2016, revenue for this segment of the TV universe had grown to $4,415.6 million. The new engine of growth is shifting more and more to OTT services, however.
The Total Television Universe
In order to complete the picture of the “Total TV Universe” we need to add in OTT streaming services. That, however, is difficult given the dearth of publicly available information, from either Netflix, the biggest OTT provider in Canada, or from Bell’s CraveTV as well as Roger and Shaw’s jointly-owned shomi, respectively (although the latter was closed in November 2016). However, we can arrive at reasonable subscriber and revenue estimates for Netflix’s operations in Canada based on its annual reports and press coverage.
This year’s CRTC offers valuable new insights into internet streaming video services like Netflix, CraveTV, illico, etc. as well as transactional video on demand services, notably the purchase of TV programs and films through Apple’s iTunes (see pp. 146-148). However, we find its estimate that Netflix had 6.2 million subscribers and revenue of $766 million in a streaming TV market worth $1081.2 million in Canada last year implausible. Estimates reported in the press that Netflix has 5.7 million subscribers also seem to be on the high side.
Both figures are considerably higher than Netflix subscriber rates in the US of 37.6% (based on a year-over-year average)(Netflix, 2016 Annual Report, p. 21). They are significantly higher than estimates by IHS Screen Digest as well. In addition, using year-end subscriber estimates fails to account for subscriber growth over the year, likely overstating Netflix’s revenue as a result. The fact that the consultant reports behind these numbers are proprietary means that issues of method and who commissioned them are private and, therefore, beyond scrutiny.
We estimate that Netflix’s revenue in Canada last year was $534.1 million and that, based on IHS’s estimates, it had 5.3 million subscribers by the end of 2016. This is just under 38% of Canadian households, a rate slightly less than in the US (i.e. 39% at year’s end, 37.6% accounting for annual growth). Factoring in growth over the year in Canada and an average monthly subscriber fee of $9.50 yields the figure above.[1] Add in revenue for Rogers and Shaw’s shomi before it was shut down ($92 million), Quebecor’s illico ($31.4 million) and estimated revenue for Bell’s CraveTV ($86.2 million), and total Canadian revenue for SVOD services in 2016 was roughly $743.8 million.
Adding broadcast TV, specialty and pay TV services and OTT services together to get a sense of the “total television universe” revenue yields an unmistakable picture: total TV revenue grew four-and-a-half fold from $1,804.3 million in 1984 to $8,043 million last year. Using “real dollars”, total TV revenues more than doubled from $3.7 billion three decades ago to $7.8 billion last year.
Netflix’s share of all TV revenue has grown from zero five years ago to more than 6.4% last year—but more on this in the next report in this series. In sum, the advent of Netflix has added to the size and diversity of the TV market, and kept revenue on an upward trend.
The fact that TV services based on subscriber fees rather than advertising continue to grow briskly even in the face of economic headwinds reveals a crucial point: the TV business has shifted to the direct pay-per model. Subscriber fees, as noted at the outset of this report, are now the centre of the media universe, not advertising. The pay-per model is more resilient to economic shocks compared to the hyper-twitchy nature of advertising revenue. However, they also raise pressing questions in terms of affordability and inequalities of access after nearly a century of policies that have tried to foster universal and affordable broadcasting services.
If we add cable, satellite and IPTV distribution to this portrait the trend is even more undeniable. The addition of new services, first DTH in the 1990s, accompanied by the steady growth of cable and DTH up until 2011, and the quick growth of IPTV in recent years, means that the TV distribution market has also grown immensely over time. Indeed, sum up all the elements of “Total TV” and TV distribution sectors and the TV marketplace accounted for nearly $16.8 billion in revenue in 2016. To put it another way, in 1984, all segments of the TV industry combined accounted for 13% of revenue across the media economy. That figure is now 21.2%. While there has been a slight dip in the past few years, one thing is clear: television is still central to the internet- and mobile-centric media universe. Table 6 illustrates the trends.
Table 6: Television at the Centre of the Network Media Economy Universe, 1984-2016 (current $, millions)
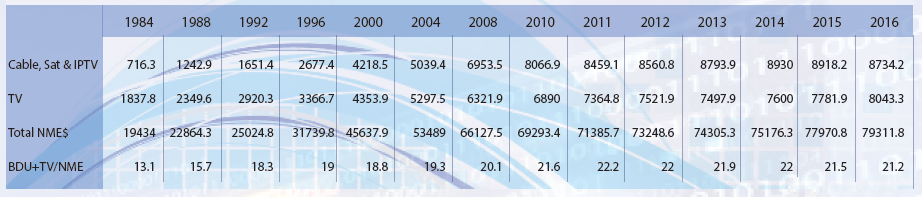
Sources: see the “Total TV” and “CableSatIPTV” sheets in the Excel Workbook.
A broader analysis reveals a more mixed picture. The time people spent watching television ‘the old fashioned way” has has fallen by about one hour per week over the last five years. That decline, however, has been more than offset by a rise in TV viewing over the internet and mobile wireless connections (CRTC, 2017, p. 157).
A recent Canadian Media Usage Study paints a similar picture, with time spent watching television weekly in Canada growing in the past decade-and-a-half once streaming services are included. As it says, “all [o]ffline media have experienced declines in their ability to generate weekly reach over the last 14 years. The TV medium is the exception” (p. 4). The latest versions of that report also observe that TV viewing has grown by nearly 200 minutes per week over the last decade-and-a-half, with almost all of that gain being attributable to the growth of streaming television services.
In a 2012 article, Why the Internet Won’t Kill TV, Sanford C. Bernstein & Co. senior analyst, Todd Juenger, also shed light on the point regarding increased TV viewing across media platforms and devices. As he observed, “so far teens are following historical patterns, and in fact, their usage of traditional TV is increasing”. Their use of computers, smart phones and tablets adds to, rather than takes away from, how much they watch television. As Marshall McLuhan once put it, old media are not wiped out by the new but rather become the content of new media.
Data from Cisco and Sandvine also suggests that television and online video are driving the evolution of the internet, with more than half of all down-stream internet traffic now accounted for by Netflix and Youtube. For the past few years, Netflix alone has accounted for a third of all internet traffic in North America (p. 4). Internet traffic also ebbs and wanes over the course of a day in ways that match traditional television viewing patterns. Elsewhere, I have called this the rise of the prime time internet.
The proliferation of devices is re-arranging the time and space/place for television in people’s lives. That Netflix is engineered to be watched on 800 devices highlights the point. To be sure, watching television the “old fashioned way” is on the way out, but this is largely being offset by changes in how people watch television. In this regard, watching television over the internet and via mobile devices has resulted in television viewing time remaining relatively constant over time.
Of course, this does not mean that that life is easy in the television business. Indeed, all its constituent elements must come to terms with an environment that is becoming structurally more differentiated because of new media, notably IPTV and over-the-top (OTT) services such as Netflix, and because of major changes in how people use the multiplying media at their disposal.
Incumbent television providers have leaned heavily on the CRTC and Parliament to change the rules to bring OTT services into the regulatory fold, or weaken the rules governing their own services, on the grounds such services threaten the economics and cultural policy objectives of the Canadian television system. Others are pushing hard for a levy on internet access and wireless services in support of Canadian content, and to selectively lift data caps for Canadian content while applying them to “foreign” TV services and everything else that people do with the internet and mobile phones. While strange bedfellows in the best of cases, the incumbent, vertically-integrated telecoms and TV service providers and reinvigorated cultural nationalists are rallying around the idea that keeping the BDU-centric TV model for as long as possible is a wise thing to do (see Bell’s submission, notably pp. 22-24 and the Miller Report (2015b) commissioned by the ACTRA, CMPA, Writers Guild of Canada, the Directors Guild of Canada, the Friends of Canadian Broadcasting and Unifor).
In sum, instead of cannibalizing the revenue of the television industry, developments in OTT streaming services and new modes of consumption using the internet, IPTV and mobile wireless services have added to the size of the pie. Watching TV online has become a core activity in the internet- and wireless-centric media universe. In fact, such activities are driving the uptake and use of mobile wireless and internet services. Not surprisingly, therefore, Rogers, Telus, Shaw, Bell and Videotron all use television to drive the uptake of 4G wireless services and broadband internet access. To paraphrase Mark Twain, rumours of television’s demise are greatly exaggerated.
Internet Advertising
In non-inflation adjust terms, advertising spending in Canada has basically stayed the same in the last five years. Switch the measure to real dollar terms, and it has flat-lined for most of the last decade. More significantly, on a per capita basis, it fell from an all-time high of $380 to $347 (in real dollar terms) (see TVB, 2017).
Amidst the declining role of advertising revenue in the media economy, the growth that has occurred in internet advertising looks all the more stunning—and to some, menacing. In 2016, internet advertising revenue reached $5.5 billion—up from $4.6 billion a year earlier and just $1.6 billion in 2008. Internet advertising continues to grow briskly despite the economic doldrums that have prevailed since the onset of the financial crisis nearly a decade ago, and perhaps even because of them.
It has also become markedly more concentrated. With estimated revenue of $2,614 million and $1,311.3 million in Canada, respectively, Google (48%) and Facebook (24%) accounted for nearly three-quarters (72%) of the online advertising market in 2016—up from just under two-thirds a year before. In fact, all the gains, and then some, went to Google and Facebook. When it comes to internet advertising, the two digital behemoths are in a league of their own. Beyond them, the top ten companies garnered 77% of internet and mobile advertising revenue; by 2016, the share of the “big ten” reached 86%. (see “Internet Advertising Market share, 2014-2016” on the “Internet Other” page in the Excel Workbook).7
Google is now the sixth largest media company operating in Canada, after Bell, Rogers, Telus, Shaw and Quebecor; Facebook ranked eighth, behind the CBC but bigger than Sasktel, Postmedia, MTS, Cogeco, Torstar, Netflix, Eastlink, the Globe and Mail, Power Corporation and Groupe Capitales Médias. Altogether, Google and Facebook account for 5% of all revenue across the media economy in Canada.
For its part, Facebook had an estimated 20.7 million users in Canada at the end of 2016. With each Canadian user worth $62.23 to the company per year, Facebook’s Canadian revenue can be estimated as being $13,111 million in 2016, or roughly 24% of internet advertising revenue (Facebook, Annual Report 2016, pp. 35-37). Its annual ARPU—the industry’s measure for the value of the “audience commodity”—has soared in recent years. It is now more than three times what it was just three years ago (i.e. $19).
Google and Facebook’s Internet Advertising Monopoly Problem
Google and Facebook have become major players in Canada in a very short period of time. They form a duopoly in internet advertising and the scale and scope of their influence is growing and consolidating. Their move from the desktop internet to the mobile internet has expanded their influence considerably and tightened their grip. Google has also expanded far afield from its iconic search engine to owning a huge system of overland and submarine fibre cables (it’s one of the biggest internet traffic carriers in the world), data centres, mobile operating systems (Android), software and document storage, maps, urban development projects (Toronto); news delivery, artificial intelligence, autonomous vehicles, and other bits and pieces of the emerging internet-of-everything. Facebook has moved into messaging services (WhatsApp), marketing campaigns, political campaign management, virtual reality, news delivery and more as well.
The extent of Google and Facebook’s domination of internet advertising and a growing range of activities has led to justifiable concerns about the extent of their power and influence. As they expand their dominions, they flirt with the outer edges of the law—or, “move fast and break things”, as Taplin puts it. Their technocratic elitism and hubris grates, and is basically authoritarian and anti-democratic, he adds. Both companies set take-it-or-leave-it terms of service policies for all who would use their services. They strip mine personal and public (e.g. geomatics data) information. If their dominance of the internet advertising market wasn’t a big enough problem, their growing clout across the economy has stirred the antimonopoly movement in the US back to life (Khan, Pasquale, Zuboff, Taplin). Could it migrate to Canada and elsewhere as well? There are signs in Europe that it already has.
That Google and Facebook should be regulated for monopoly power in their respective areas of operation, and sometimes stopped from entering certain new ones, is no longer a far-fetched idea but one that is now more influential than it has ever been. The European Commission’s €2.3 billion (CDN$3.4 billion) fine levied against Google for its anti-competitive tactics in Europe is one step in this direction. Max Schrems’ tenacious and successful Europe versus Facebook battle, and its impact on the General Data Protection Regulations adopted last year, is another such instance. The EC’s declaration that Apple’s sweet tax deal with Ireland is an unfair state subsidy, and ordering the company to return back taxes of €13 billion (CDN$19.3 billion), is another that seems both fair and in line with fostering open markets.
As worries mount about whether the internet giants pose a threat to democracy, three additional steps to bring the companies to account now seem well-within the pale in a ways that would have been unthinkable just a few years ago:
- Regulated Algorithm Audits. In the name of disclosure and accountability, annual audits of Google and Facebook’s algorithms would be a good first step. Like banks and the financial reporting requirements for publicly-traded firms, a new Federal Algorithm Commission similar to a proposal by Owen Bracha and Frank Pasquale nearly a decade ago would oversee a certified annual audit of the companies’ “blackboxes”;
- Election Rules Apply. The same Elections Canada rules that apply to broadcasters and the press with respect to funding, disclosure, links to third parties, restrictions on foreign funds, use of voter information and so on during election campaigns, including all the locational and targeting data connected to such campaigns, should be applied to Facebook, Google and other digital platforms, as Owen, McKelvey and Dubois have proposed;
- Advertising Whitelists. The top 10 to 100 advertisers could be required to use regularly updated “whitelists” of URLs to determine where their ad dollars go instead of relinquishing control to Facebook and Google’s algorithms. This would help break up the latters’ power over the social flow of information and at least make the allocation of advertising money more pluralistic. This would be real progress against Google and Facebook’s duopoly over such activities, even though it falls far short of being a democratic solution.
I also think that it is essential for regulators to lean much more heavily on anti-trust and competition laws as well. Yet while it is obvious to me that the extent of Google and Facebook’s domination of internet advertising justifies a range of actions to curb their growing clout, there is also a sense that we are being swept along by the force of events in ways that could lead to no good. There is a strong need to be careful and ensure that whatever remedies are proposed function not under the compulsion of moral panic but sound judgement, and not as a sledgehammer but a scalpel.
In this regard, there is much reason for concern. The tendency to extrapolate from Facebook and Google’s undeniable dominance of internet advertising to blaming them for all the woes that supposedly ail the media is commonplace and one of the tendencies that we should be wary of. Taplin exemplifies this stance in Move Fast and Break Things when he repeatedly asserts that as much as “$50 billion per year . . . has moved from the creators of content to the owners of monopoly platforms” (p. 7). He bases the figure on a tall of the losses to “recorded music” (down $12.6 billion per year), “home video” ($3.6 billion) and “newspaper advertising” ($42.2 billion) over the past decade or so.
Those numbers, to be sure, are real. They are also partial, and Taplin misleadingly uses them as if they stand in for the whole before single-mindedly blaming these losses on the villains of his piece: Google, Facebook and Amazon. Much the same style of analysis and rhetoric defines a report released early this year by the Public Policy Forum in Canada, The Shattered Mirror: News, Democracy and Trust in the Digital Age. I have addressed this report at length elsewhere, but a brief reprise will help highlight its main claims, and the problems with them.
The report’s portrait of the state of journalism in Canada is grim indeed: advertising revenue has plunged, newspapers have been closed down, merged or pared back; local TV stations have been shuttered with more likely to come; 12,000 journalism jobs have vanished; fake news is pouring in to fill the void; and the 20th Century’s beneficial three-way relationship between advertisers, journalists and the public, which got its news for next to free because advertisers footed most of the bill, is on the brink of collapse. These arrangements literally supported the “free press”, and democracy was the better for it, the report’s authors lament, but all of this is now falling apart because “foreign giants are getting most of the advertising money the news outlets rely on to pay for quality journalism”, they say. That needs to change, they declare.
However, like Taplin, The Shattered Mirror report misleadingly takes the receding parts of the media economy—advertising supported broadcasting and newspapers, mostly—and lets them stand in for the media economy, tout court. Its focus on a few segments of the media that are in trouble ignores or downplays those that are not, such as internet news, pay and specialty TV as well as internet streaming services. It also ignores the fact that the the centre of gravity in the media economy is shifting away from advertising to the “pay-per”, subscriber-based model. It even fails to mention that advertising revenue is declining—relative to the size of the media economy, in “real dollar” terms, and on a per capita basis. In so doing, it lashes its sails to a sinking ship. The report also puts a gloss on the advertising-based model of “the free press” without considering any of the well-known criticisms of it. Blaming Facebook and Google for much of the woes besetting some aspects of the media and journalism in Canada, the Public Policy Forum’s authors were blind to many of the defining features of the contemporary media.
The advertising revenue that does remain is increasingly going to Facebook and Google, that much is beyond dispute. That does not mean that they are venal (although they might be), however, but that they are more efficient at doing what the mass media used to do best: delivering audiences to advertisers. Even if Facebook and Google’s efficiency advantages were cut down to size by, for example, restricting their ability to strip mine personal and public data, or to micro-target audiences on the scale that they do now, it is still highly unlikely that advertisers would rush back to broadcasters and newspapers.
The Shattered Mirror report also downplays the fact that general news services have long been subsidized by either wealthy patrons, governments and advertising. With the “advertising subsidy” for journalism now in free-fall, and the willingness of people to pay for news growing but still weak, how an approach focused on the getting “lost advertising money” back will stem the carnage is a bit of a mystery. Other evidence that does not fit the one-dimensional story of doom and gloom that the authors want to paint is ignored as well: notably, Statistics Canada data showing that the number of journalists in Canada has actually ticked upwards over time (also see below).
Lastly, the Public Policy Forum’s call to treat Facebook and Google as publishers or broadcasters is worrisome. This is because both have been proven to be clumsy and flatfooted when it comes to making sensitive judgements about content and context. Facebook’s ham-fisted approach to enforcing its “community standards” was on full display, for example, when it censored the Pulitzer Prize winning “napalm girl” photo of Kim Phuc running naked away from a village just after it was bombed by the US during the Vietnam War. It has also taken down or restricted access to images of the Statue of Neptune in Bologna; the Little Mermaid Statue in Copenhagen; Evelyne Axell’s Ice Cream; Gustave Courbet’s Origin of the World and Illma Gore’s recent sketch of Donald Trump in the nude (see here if you must).
We should also be wary of the claims about “fake news” in The Shattered Mirror report and elsewhere that are leading the push to enroll Facebook, Google and others in efforts to stamp it out. Those calls may seem appealing now given the mounting evidence about the extent and role of “fake news stories” in the 2016 US presidential election and elections in the UK, France and others. However, caught up in a political maelstrom and a sense of moral panic, we must keep in mind that the effects of “fake news” are probably not as strong as many seem to think. In a recent study, “Social Media and Fake News in the 2016 Election”, Hunt Allcott and Matthew Gentzkow from New York University and Stanford University, respectively, find that even though Americans use social media a lot, only a small portion of them relied on social media as their “most important source of news” during the election. TV was the main source of political news, by far. Those who did get their news mainly from social media were exposed to fake news that favoured Trump over Clinton by a wide margin, but few could remember “the specifics of the stories and fewer still believed them”, notes a Poynter Institute commentary of the study. Other scholars reach similar conclusions (Dutton).
The evidence, to be sure, is neither clear-cut nor complete, but that, too, should be reason for pause. Indeed, it is still far too early to say anything conclusive on these matters, but just as with the question of the broader political and social effects of the internet giants so too is it necessary to reign in claims about their alleged impact on so-called legacy media.
The Music Industry
While many have held up the music industry as a poster child for the woes besetting “traditional media” at the hands of digital media, the music industry in Canada is not in crisis. The picture to be sure, is mixed but seemingly improving. The analysis that follows is also instructive in relation to the kinds of claims that Taplin makes in Move Fast and Break Things and that that we find in The Shattered Mirror report, where the selective use of data for one specific aspect of a media sector is misleadingly held out to stands for the whole when it does not. Taplin’s repeated references to the steep drop in revenue for “recorded music” is of this type. Why that is so misleading will become evident in the discussion of the music industries in Canada that follows immediately below.
Indeed, like Taplin, many observers have argued for more than a decade that the music industry is in crisis. Indeed, the notoriety of file-sharing and peer-to-peer (P2P) networks from Napster in the late-1990s, to Grokster, Pirate Bay and the closing of Limewire, reinforced the view of an industry under siege, and that this would only get worse as broadband internet became more widely used and search engine giants like Google built the businesses on top of linking to other people’s media content without permission and proper payments. For a decade-and-a-half, the Recording Industry Association of America and the International Federation of Phonographic Industries (IFPI)—two international trade associations that represent the music industries—consistently argued that the industry’s revenues were in decline and that the music business is the ‘canary in the coalshaft’ for things to come for the rest of the media.
And like Taplin, the evidence with respect to the deep and long-term plunge in “recorded music” revenue is clear cut and convincing, as Figure 10 below depicts.
Figure 10: The Collapse of the Record Music Industry in Canada, 1998-2016 (current $, millions)
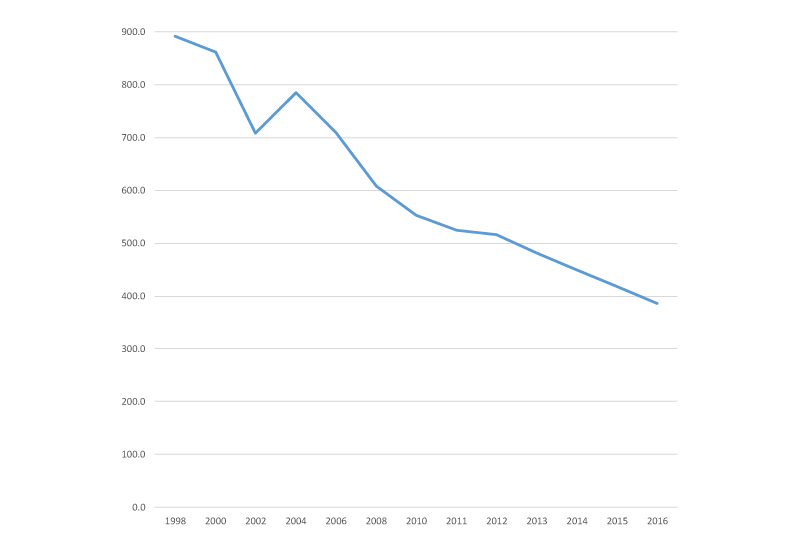
Source: Statistics Canada, Sound Recording and Music Publishing, Summary Statistics CANSIM TABLE 361-0005.
This image of a beleaguered industry, however, is badly flawed. This is because it refers only to the “recorded music” segment of the industry and lets that stand for the whole. Figure 11 below, however, tells a very different story once the three other key segments of the music industry are brought into the picture: (1) concerts and live performances, (2) music downloaded or streamed on the internet and mobile devices, and (3) publishing (lending rights + more digital and network distribution platforms).
Figure 11: Total Music Industry Revenues in Canada, 1998—2016 (current $, millions)
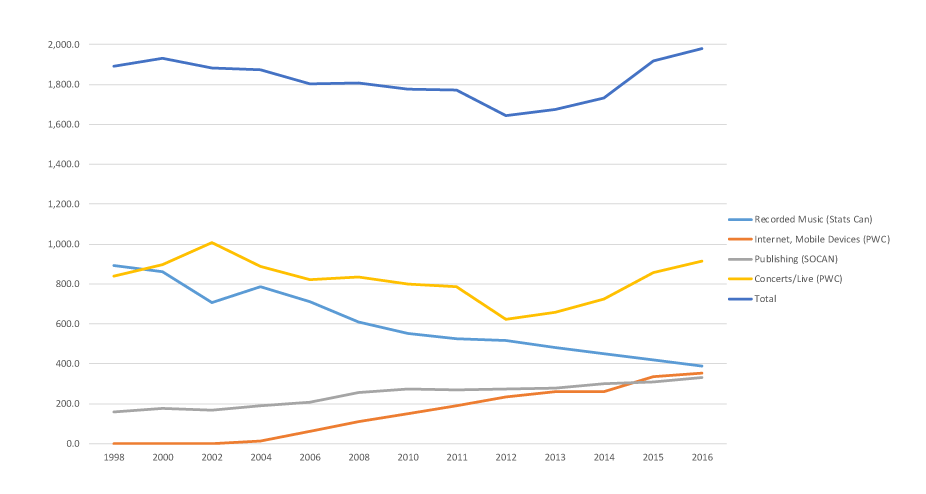
Sources: Recorded Music from Statistics Canada, Sound Recording and Music Publishing, Summary Statistics CANSIM TABLE 361-0005; Sound Recording: data tables, October 2005, catalogue no. 87F0008XIE; Sound Recording and Music Publishing, Cat. 87F0008X; Publishing from Socan, Financial Report (various years); Concerts and Internet from PriceWaterhouseCoopers, Global Media and Entertainment Outlook (various years); USD converted to CDN$ using Bank of Canada Year Average of Exchange Rates.
To be sure, this is not a wholly “good news” story. “Recorded music” has gone into seemingly terminal decline. The sum of all revenues from the main elements of the music industry – i.e. recorded music, digital sales, concerts and publishing royalties – indicates that the music industry revenues drifted steadily downwards from $1,889.7 million in 1998 to $1,769.8 million in 2012 or so. Revenue began to rise again in 2012, however, and has continued to crawl upwards gradually ever since. At the very least, this evidence tempers claims about the crisis of the music industry. It also reveals the problem of selectively plucking figures about one aspect of media markets and using them to stand for the whole, as both Taplin and the Public Policy Forum do.
Conditions in Canada mirror those in the music industry worldwide: an uptick in revenues in the past few years and a pathway to recovery clearly in sight. To be sure, certain elements within the music industry—recorded music—have suffered badly, but publishing has grown greatly. It is also clear that digital/online/mobile revenues have exploded while concerts remain a crucial cornerstone of the industry. Recognizing that the music industry had clearly turned a corner, Socan, the trade association that represents music composers, writers and publishers in Canada, boasted of “a banner year” and “record revenue” in 2015 (pp. 1 & 8). It did so again in 2016, noting “record revenue” of $330 million, with sizeable increases in money distributed to music creators and publishers (up 4.6%), international royalties (up 31% over the last three years) and internet revenue that had more doubled over the year (Socan, 2016 Annual Report, p. 5).
Similar accounts can be seen at the international level, too. Thus, as the IFPI stated in its 2013 Digital Music Report, “the music industry achieved its best year-on-year performance since 1998” (p. 5). In 2014, the same publication observed, “Recorded music revenues in most major markets have returned to growth” (p. 5). The IFPI struck a more measured note last year but was still upbeat, the upshot of which is that the lingering sense of an industry is in crisis is slipping into the past:
. . . After two decades of almost uninterrupted decline, 2015 witnessed key milestones for recorded music: measurable revenue growth globally; consumption of music exploding everywhere; and digital revenues overtaking income from physical formats for the first time. These are positive metrics of accomplishment. They reflect an industry that has adapted to the digital age and emerged stronger and smarter (IFPI, 2016, p. 5).
A common thread in each of these sources behind the rekindled yet measured optimism about the music industries is that because the music industries embraced digital/internet sources of revenue earlier and more extensively than other media, they fortunes have turned around much more quickly. Indeed, already by 2012, the industry was obtaining about 15% of its revenues from online, mobile and digital sources compared to single digit figures for newspapers and television that still prevail today. In other words, after having suffered the blows from the onslaught of the internet and piracy early in the game, the music industry was out in front of others in embracing the realities of an ever increasing internet- and mobile-centric media world. These lessons may hold for other media as well.
The upshot is that after having gone through wrenching changes, the music industry has been recomposed along new lines. To illustrate the points further, Figure 12, 13 and 14 depicts the transformation of the sector away from one centred on recorded music to one where concerts, the internet and mobile devices, and publishing play pivotal and growing roles.
Figure 12: Composition of Total Music Revenues, 2000
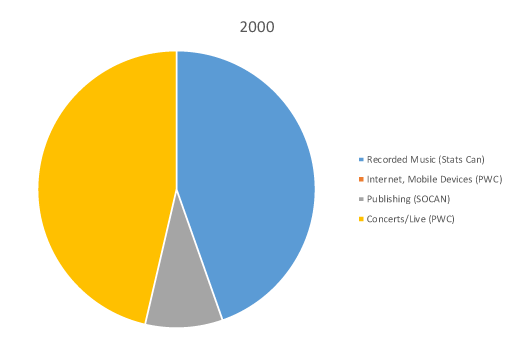
Figure 13: Composition of Total Music Revenues, 2008
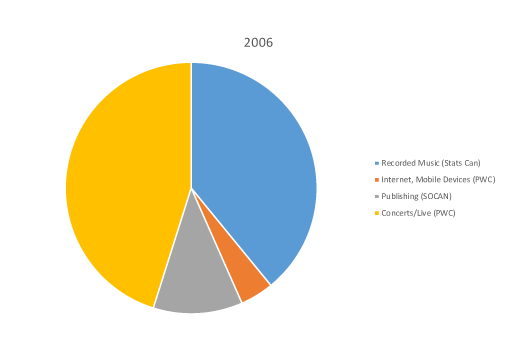
Figure 14: Composition of Total Music Revenues, 2016
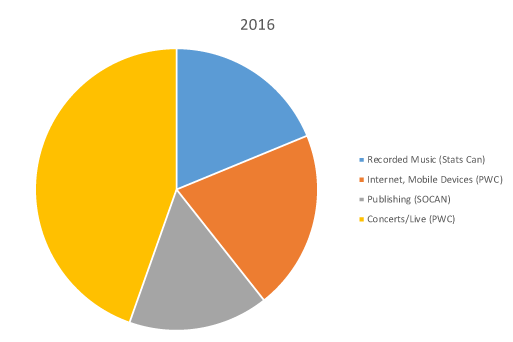
Sources: Recorded Music from Statistics Canada, Sound Recording and Music Publishing, Summary Statistics CANSIM TABLE 361-0005; Sound Recording: data tables, October 2005, catalogue no. 87F0008XIE; Sound Recording and Music Publishing, Cat. 87F0008X; Publishing from Socan, Financial Report (various years); Concerts and Internet from PriceWaterhouseCooper, Global Media and Entertainment Outlook (various years); USD converted to CDN$ using Bank of Canada Year Average of Exchange Rates.
Radio
Radio stands in a similar position to the music industries a few years ago. Revenues grew until peaking in 2011: $2,025.6 million (including the CBC annual parliamentary appropriation). They have drifted downwards since. In 2016, revenue was $1,1841.6 million (current dollars). Change the measurement from to real dollars, however, and the picture changes, with revenue declining from $2,150.2 million at the sector’s high point in 2010 to $1,796.1 million in 2016 – a substantial fall of 17% (see the “Radio” sheet in the Excel Workbook).
Magazines
Magazines appear to be an instance where there was a steep drop in revenue after peaking in 2008 at $2,394.4 million, before falling to $1,922.2 million in 2012. Fast forward to 2016, however, and revenue was still basically the same at $1,462.7 million—a drop of nearly 40% from the peak, to be sure. This is a clear instance of a medium in free fall (see the “Magazine” sheet in the Excel Workbook).
Newspapers
Perhaps the most dramatic tale of doom and gloom in the network media economy comes from the experience of newspapers. In earlier versions of this report, and other posts, I have been skeptical of claims that journalism is in crisis. I still am but the idea that circulation and revenues are in long-term decline, and the industry as well as the nature of journalism as a profession, are in turmoil, is hard to deny.
Making sense of the messy situation that is the contemporary newspaper industry is not easy. Data for the industry are “a mess”, as one industry insider who tallies up the data told me. As ways of reading the newspaper change to include the internet, tablets and mobile devices, the notion of circulation has had to change, but so too have definitions of the “daily newspaper” been altered to fit the new reality in which many so-called dailies don’t actually publish every day of the week but just four or more. Even the simplest of questions, therefore, like, “What’s a daily newspaper?”, have no easy answer. In 2016, the newly renamed News Media Canada stopped publishing circulation figures altogether because its members could no longer agree on what should count toward them and what should not.
The extent of these conceptual and empirical difficulties makes it hard to keep a standard measure of newspaper revenues over time. Nonetheless, using a mixture of data from Newspaper Canada, Statistics Canada and corporate annual reports, we can get a reasonably good portrait of the industry over time and its main players.
Based on revenue, the evidence is clear: it peaked between 2006 and 2008 at around $4.8 billion, but has plunged ever since. Last year, total revenue was just $3.1 billion – a loss of nearly a third of all revenue in less than a decade. Table 7 below illustrates the trends.
Table 7: Newspaper Revenue, 2004-2016 (current $, millions)
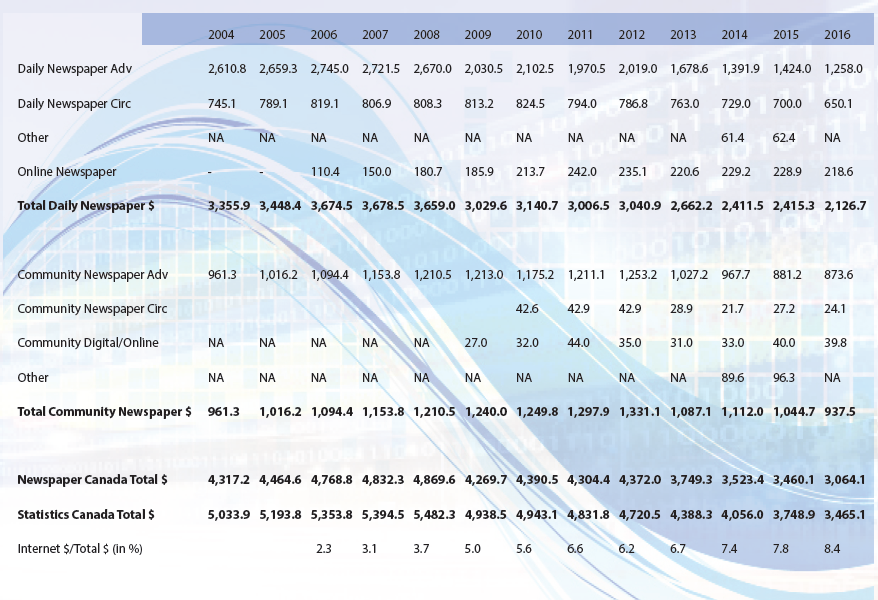
Sources: see the “Newspaper” sheet in the Excel Workbook for industry revenues back to 1984. Newspaper Canada from 2000 onwards; Statistics Canada before. The CMCR Project’s Methodology Primer and additional thoughts on sources and method offers further discussion on the methodological issues at play.
In real dollar terms, the drop is steeper and longer in the making. From this angle, newspaper revenues peaked in 2000 ($5,299 million), drifted downward until 2010 ($4,783.7), and then fell off a cliff to reach $2,988.2 million last year – a long, drawn out plunge of over 40%. Digital/internet revenues have increased over time but not even close to being enough to replace the revenues lost. By 2015, they constituted 8% of all newspaper revenue. While this is an increase in percentage terms, given that the revenue base has shrunk greatly, in absolute terms, digital/online revenue has hovered around the $250-285 million range since 2011, as Table 7 shows.
The tough times can also be seen in the fact that since 2008, eleven paid dailies and thirteen free dailies have closed, while a dozen-and-a-half have scaled back their weekly publishing schedule from six or seven days to four. This is the most clear-cut case of a medium in decline.
The punishing effects of these trends even in just the last two years (i.e. 2014-2015) are clear:[1]
- All major newspaper publishers have seen steep revenue losses over the past three years: Torstar (17%), Postmedia (30%) and the Globe and Mail (19%) (based on estimates and adjustments for ownership changes);
- Reduced publishing schedules across the Postmedia chain adopted in 2012 (the Calgary Herald, Edmonton Journal and Ottawa Citizen) and previous years (e.g. the National Post) have been maintained and are now the norm at these papers;
- eighteen positions were cut in 2014 at the Globe and Mail (i.e. nine editorial, three photographers, three copy-editors and three others, bringing the number of lay-offs to 100 since 2012); plans to have editorial staff write “branded content” for advertisers met stiff resistance from journalistic staff and were dropped; new voluntary retirement programs for journalists and editorial staff were put in place at the Globe and Mail with the goal of reducing staff by about 60 (here and here);
- lay-offs by Postmedia continued with 90 more jobs cut in Vancouver, Calgary, Edmonton and Ottawa in 2016, with expectations that 50 more employees would take voluntary lay-offs; at least a half-dozen journalists and editors in its Parliamentary Bureau and eacross the chain were cut in previous years, and a standing offer of buy-outs and early retirement packages has been in place place;
- twenty lay-offs at the Halifax Chronicle-Herald, while staff at the paper were on strike for much of 2015 and 2016;
- lay-offs of nine editorial and photographic staff across the Brunswick News chain in the Maritime provinces;
- Postmedia struck a deal to acquire Quebecor’s chain of six major urban dailies, 27 community dailies, 140 weeklies, the 24 Hours free papers in Toronto and Vancouver adn a variety of websites for $306 million (a massive write down from the $983 million Quebecor paid for the papers when it bought them in 1998). The transaction was approved by the Competition Bureau in 2015;
- Six French papers in Quebec (Le Soleil, Le Nouvelliste, Le Quotidien, La Tribune, La Voix de l’Est, Le Devoir) were sold by Gesca/LaPresse to Group Capitales Médias in March 2015;
- La Presse announced the elimination of 102 full-time staff positions and fifty-six in September 2015;
- several small dailies stopped publishing: Kamloops Daily, Vernon Morningstar Daily, Alberni Valley Times and Peace Arch News Daily, and Metro London, Metro Saskatoon and Metro Regina and the Dawson Creek Daily News merged with the Alaska Highway News;
- some newly emerging journalistic organizations have begun to bulk up. iPolitics had 15 full time journalists, five staff and a number of free-lancers, for example, as of 2015.
Taking a broader view that includes broadcasting, Romayne Smith-Fullerton, of the Faculty of Information Studies at Western University, says that “in the last seven or eight years, we’ve lost more than 10,000 journalism jobs”. The idea that all of this is part of a crisis of journalism was one of the reasons that brought about the Canadian Heritage Parliamentary Committee and CRTC reviews of the state of local news in communities across Canada in the past year as well.
The most systematic attempt to keep track of these changes is a project led by Ryerson University and University of British Columbia professors April Lindgren and Jon Corbett. Their interactive Local News Map chronicles the closures and cutbacks at newspapers and broadcast stations across the country, but also the emergence of new ventures and recent hires that effect the production of news as well (also see Watson, 2016).
Another significant other change to take place in the last five years is the extent to which daily newspapers have been put behind paywalls. Prior to 2011 there were no significant dailies with paywalls; two years later, there were 27 dailies accounting for roughly 45% of daily circulation were behind paywalls. By 2015, the number had grown to 38 dailies representing nearly 60% of daily circulation behind a paywall. However, by the end of that year the embrace of paywalls began to reverse. The Toronto Star was the first to drop its paywall last year when it launched its tablet-centric StarTouch version of the newspaper. Two small newspapers owned by Black Press—the Red Deer Advocate and Cranbrook Daily Townsman—dropped their paywalls, as well, 2016. Paywalls were fast becoming a defining feature of the daily newspaper landscape in Canada between 2011 and 2015, and at a rate higher than in the US or the UK (see here). However, since the Toronto Star reversed course in 2015, the extent to which paywalls rule has begun to slide. By the end of 2016, just over a half of daily newspaper circulation in Canada was behind a paywall. Table 8 illustrates the point.
Table 8: The Rise of the Great Paywalls at Canadian Newspapers, 2011-2016
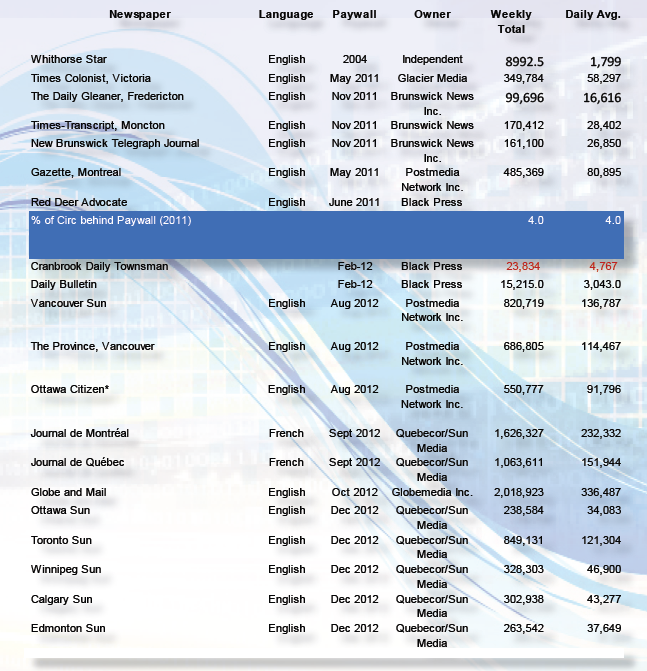
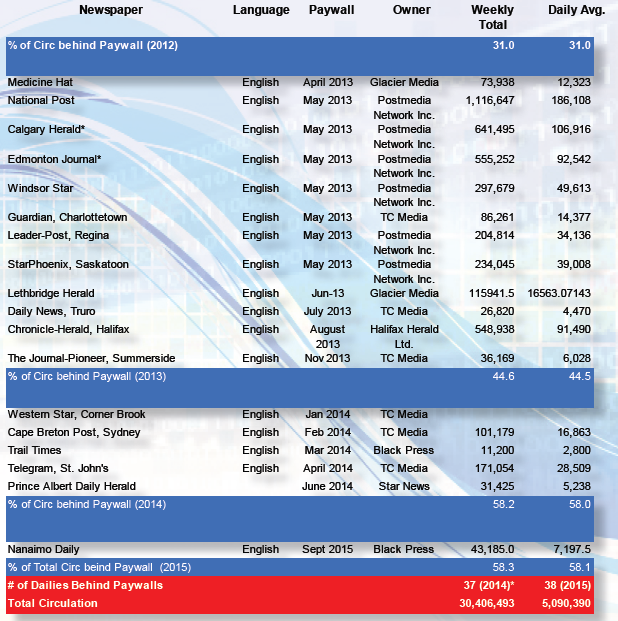
Sources: Newspaper Canada 2015 Daily Circulation Report and observations.
The extent of cut-backs in the number of journalists and newspaper staff, and that the industry’s turn to paywalls has not come even close to offsetting the lost revenue that has accumulated over the years, all add to the image of a “crisis of journalism”. Indeed, in light of the run-of-events reviewed thus far, it is hard to imagine that things are otherwise. But are things really as bad as they seem?
For several years I was reluctant to agree that newspapers were in crisis because the trends had not been long enough in the making to draw a firm conclusion one way or another. I also saw many of the wounds that the industry is suffering from as having been self-inflicted by two decades of consolidation, bloated debts, and timid approaches to new technology and new markets. I still believe that the latter point in particular is important to explaining how we have arrived at where we are but I have changed my general conclusion as evidence of the severity of the economic woes besetting the industry continued to pile up.
That said, I also still agree with those like Yochai Benkler, who argue that we are in a period of turmoil, not catastrophe. Like his observations a few years ago in relation to the US, so too in Canada can we take some respite from the emergence of a new crop of:
- commercial and donor supported, internet-based approaches to journalism and public commentary (e.g. iPolitics, National Observer, Canadaland, Blacklock’s Reporter, the Tyee, Huffington Post, Buzzfeed, Vice, AllNovaScotia, Policy Options, etc.),
- the revival of the partisan press (e.g. Blogging Tories, Rabble.ca, Rebel.ca)
- a couple of non-profits and cooperatives (e.g. the Dominion),
- a larger role for academic experts who are bringing their specialized knowledge into the public domain; and
- citizen journalists.
Whether these changes will ultimately prove to be a boon for a free press, however, remains to be seen and I am more skeptical on this point than Benkler. That they are taking hold, however, is promising. So, too, is the fact that most of these ventures have been launched by professional journalists. They have broken several major stories. Some have specialized expertise like iPolitics, Policy Options and The Wire Report. This new raft of ventures run by professional journalists, and flanked by a renewed partisan press, lively public conversations led by academic experts and citizens, suggests that there is a healthy dose of good news to consider over and against the steady flow of bleak images of an industry otherwise in peril.
One striking indicator that things may not be as dire as often depicted can be seen from data on the number of full-time journalists over the past three decades. While the steady drumbeat that “journalism is in crisis” narrative leads one to suspect that the picture is dire, the number of full-time journalists in Canada has not plummeted. In fact, it has actually crawled (stumbled?) upwards over time. Figure 15 illustrates the points.
Figure 15: Journalists vs the PR, Advertising and Marketing Professions, 1987-2016
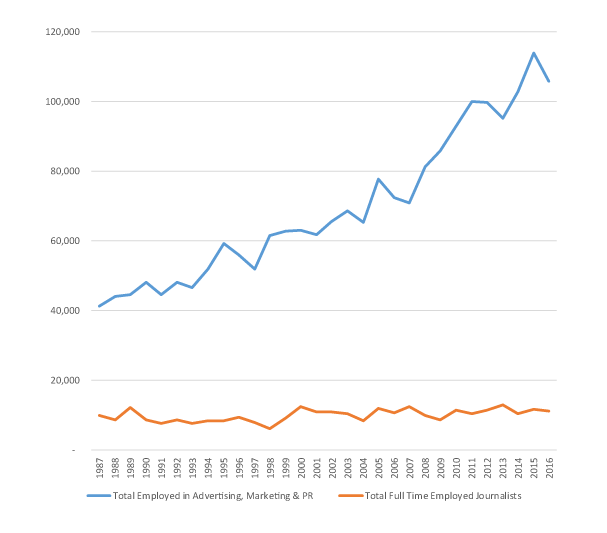
Sources: Statistics Canada (2017) Employment by occupation: 1123 Professional occupations in advertising, marketing and public relations and Statistics Canada (2016). Employment in Journalism occupation, by province. Custom LFS tabulation. File on record with author.
The number of full-time journalists rose from 10,000 in 1987 to 11,631 last year. This is a small increase, to be sure, but an increase all the same. Also consider the fact that, in the 1990s, after years of slow growth, extensive consolidation and cut backs, the number of journalists had fallen to a little over 6,000 in 1998. If we take that as our base, the number of working journalists has nearly doubled and the period since looks more like one of recovery with some modest growth rather than a catastrophe.
At the same time, however, given that the media economy has quadrupled in size while the number of journalists has stayed relatively steady means that the number of journalists has shrunk relative to the size of the network media economy. In other words, there are fewer journalistic resources in a much bigger media pie. In addition, the modest growth in journalists has been vastly out-paced by the number of people working in the PR, advertising and marketing professions. In 1987, there were four people working in the publicity industries for every journalist; last year, the imbalance had swelled to almost 10:1.
We also need to consider that while the increasing number and diversity brought about by new journalist ventures is important, none of these efforts – e.g. iPolitics, Blacklocks Reporter, Canadaland, etc. – even ranks in the top 60 internet news sources that people in Canada go to for their news (see the “Internet News Sources” sheet in the Excel Workbook). This implies that they account for under one percent of internet news traffic, suggesting that they speak mainly to small and specialized audiences.
Their presence in the online news environment is vastly outstripped by mostly well-established news organizations like the CBC, Postmedia, Torstar, Quebecor, CTV, the Globe and Mail, the BBC, the New York Times, CNN, The Washington Post, the Guardian, and an assortment of “internet native services” like Buzzfeed, MSN News, TRONC, RT, etc. While the range of internet news sources now used by Canadians is a diverse mixture new and old, as well as local, national and international sources, the emergent crop of online journalistic ventures have yet to register significantly in the public mind except for the occasional intervention when they really do lead the charge and set the agenda by breaking stories that others have missed (e.g. the Jian Ghomeshi story and the Snowden disclosures, amongst many others).
For the time being, however, traditional news organizations are still the most important sources of journalism in the network media economy. They are still the content factories that produce news, opinion, gossip and cultural style markers that by and large set the agenda and whose stories cascade across the media in a way that is all out of proportion to the weight of the press in the media economy. In other words, the press continues to originate far more stories that the rest of the media pick up, whether television, radio or via the linking culture of the blogosphere, than its weight suggests. Thus, problems in the press pose significant problems for the media, citizens and audiences generally.
All-in-all, these developments suggest that journalism is not dead but in a serious moment of soul searching and transformation. Whether the changes will ultimately prove to be a boon for a free press, however, it is still too early to tell. And on this point, I am considerably more skeptical than Benkler and others who put their faith with the new online ventures, not least because the central problem, in my view, is nowhere near being adequately solved: i.e. the people have never paid the full cost for the news. For the past 150 years, advertising played an ever-increasing role in covering up that reality, but that façade is now collapsing before our eyes (John & Loeb-Silberstein, 2016).
As the advertising subsidy dries up, or is diverted to the internet and into fewer and fewer hands, who or what will fill the breach?
Some Reflections on Subsidies and Public Goods
Of course, the major English- and French-language press groups have called for subsidies, and for those subsidies to be given to them (see, for example, Postmedia CEO Paul Godfrey’s call to the Canadian Heritage Parliamentary Committee along these lines, as well as similar calls from Quebec-based newspaper groups (see here).
Such calls for public subsidies for journalism, of course, have been resisted in many quarters, not least by many of the new journalistic ventures that have emerged (see, for example, Canadaland’s position statement on the issue). The view from these quarters tends to be that such subsidies will only preserve that which is destined to die, or worse, that state funds will be funneled into both commercial enterprises and the CBC that these new upstarts must compete against as they strive to carve out a place for themselves in the emergent network media ecology. One hears such views whenever discussions turn to the emergent journalistic ventures such as iPolitics, the National Observer, the Tyee, Blacklocks, AllNovscotia and Canadaland, to take just the most prominent. Maybe crowd-funding, subscriptions and/or some other type of direct payments will do the trick, is the reply that tends to flow from those who are pouring the energies into these efforts at remaking the news for the 21st Century.
Yet, the idea that paywalls, crowdfunding, backing by wealthy benefactors, or some combination thereof might carry the day brings us right back to square one: people have never paid the full-freight for journalism. Historically, other than advertising, the other two main sources of subsidies to support journalism and other cultural goods have been “the state” through public service broadcasting and various other ways and means, or wealthy patrons who have funded the high arts and kept more than a few influential newspapers going for their own reasons, some of which have been altruistic, others tied to personal political projects and specific agendas to promote. The question, thus, becomes what kind of support do we want to give – as a society – to functions that we think are essential to personal and social well-being?
Avoiding, or simply opposing subsidies on the grounds that they are antithetical to “market values” avoids the reality that paywalls, and the entire intellectual property edifice is a specially devised creature of “the state” designed to deal with the public good characteristics of news, knowledge and culture. Indeed, the institutional set-up of copyright is based on a basic predicate: these goods are not normal goods traded in normal markets. That is why distinct “intellectual property laws” have been created for them, unlike most other kinds of “property” where the normal laws of property and the market hold sway.
In a bid to encourage the production and consumption of news, copyright was extended to news around the turn-of-the-20th Century. Indeed, news wasn’t even copyrightable – i.e. treated as property and a commodity in the eyes of the law – in the UK until this time. Similar events took place in the US in 1918. As a matter of fact, subsidies and legal protections like copyright have been the twin pillars of journalism since the creation of the US itself, and far from ever being seen as offside from the point of view of the First Amendment, such measures have been crucial to furthering the free press and free speech values that it embodies and democracy needs to flourish (see John on how the US post service subsidized the development of the “free press” to the tune of tens of billions of dollars per annum in the late-18th and 19th centuries).
Once again, it’s worth noting that people have never paid the full freight for a wide variety of media and cultural productions. These go beyond audiovisual media to include libraries, education, basic research, archives, the arts, orchestras, statistical agencies, universities, etc., in sum, the media, culture and knowledge infrastructures of modern capitalist societies. As a general rule, the more of these things there are, and the better they are cared for in the public interests, the healthier, happier and more democratic a society is—a sweeping statement to be sure, but in the round, basically on point.
Information/culture/media goods are not public goods just because I say they are but because society does through the political process, and because they fit the criteria for public goods set out in mainstream and heterodox economic theory, historical experience, as well as normative ideas that directly link them to human development, citizenship and democracy. The economic ways and means used to produce such things through a combination of market and non-market forces are integral parts of the overall structure of the media economy not just in Canada but around the world –at least developed and democratic ones. The settlement struck during the ‘industrial media era’ that recognized these basic facts is becoming undone, but without clear alternatives in sight.
Turning away from such realities for reasons of self-interest is understandable, but avoids the nub of the issues before us. How to settle the problems raised by these issues is an open question. However, there are lots of good ideas and accumulated expertise available to draw upon and it is incumbent upon us—and policy-makers—to draw on those resources to address the many big questions whose resolution will shape internet- and mobile wireless-centric media ecology now taking shape in front of our very eyes and which may be locked into place for a century or more, if the lessons from the past 150 years of the “industrial media age” are any guide (for an example of how changes to income tax law in Canada, for example, might better sustain non-profit journalism, see the report by the Reuters Institute on the topic).
Some Concluding Comments and Observations
This report has examined the development of the network media ecology over the past three decades. It has done so out of the conviction that too often discussion of “the media” in Canada proceeds without a solid base of evidence, and too often is driven by stakeholders whose interests are understandable but not necessarily in line with public interests.
The network media economy has grown immensely over time, quadrupling in size based on revenue between 1984 and 2016. Within the emergent network media economy, “content media” are being displaced by the “platform media” (mobile wireless and broadband internet access services). Bandwidth is king, not content, in this context. There is also a decisive shift from advertising-supported content media to “platform” and “pay-per” media, with the common denominator between the latter being that they are based on subscriber fees and direct payments versus advertising revenue.
While advertising revenue has held steady in absolute terms, it is in decline relative to the size of the media economy, in real, inflation-adjust terms and on a per capita basis. TV advertising revenue has stayed basically flat in absolute terms but fell from $110 per Canadian in 2008 to $90 last year. The growth of the “pay-per” aspect of TV (as well as music), however, means that television is still central figure on the broadband- and mobile wireless-centric media landscape. Indeed, it is a key driver of their growth, and we can even speak of the ‘prime-time internet’ to capture the sense to which both TV and the internet overlap.
While advertising is receding as a defining feature of the network media economy, it is still important to note that internet advertising has soared. It has, however, become more concentrated over time, with the top ten internet companies’ share of revenue growing from 77% of all internet and mobile advertising revenue in 2009 to 86% last year. Google and Facebook dominate internet advertising and their dominance is, in fact, growing. Combined, the two internet hypergiants now account for almost three-quarters of online advertising revenue. The increased role of the mobile internet has only consolidated their grip on the market.
Other relative newcomers like Netflix have also become significant players in the media economy. They are having a significant impact on “the broadcasting system”, although that nomenclature is circumspect in the context of the emergent network-centric media ecology. Moreover, while Google, Facebook and Netflix were the 6th, 14th and 15th biggest media companies in the country last year, their impact across the media is more modest than some seem to think, at least when it comes to laying the blame at their feet for whatever woes do affect some segments of the media. All-in-all, the narrative of crisis and catastrophe is overwrought, although this does not mean that nothing should be done about Google and Facebook’s dominance of the internet advertising market and the propensity to work the outer edges of the law to their own benefit. In terms of the market dominance, privacy, the take-it-or-leave it stance they impose on others, their potential impact on elections and reluctance to open up their “black box algorithms” to regulators, and so forth, are all indicators of their clout, and a need to limit that clout.
Bell, Shaw (Corus), Rogers, Telus and Quebecor (Videotron) are still the biggest players across the network media economy in Canada, with revenues many times higher than those of the US-based internet hyper-giants’ Canadian revenues. This is not likely to change anytime soon either, mainly because, other than Netflix, the US-based internet companies depend almost entirely on advertising revenue. In the network media economy, however, this report has emphasized the extent to which it is bandwidth and subscription fees that are king. The dominant Canadian telecoms-TV operators have secured their position across all aspects of the “pay-per” media, and it is their clout that presses most on the development and use of the network media economy in this country.
The fact that all the major commercial TV operators in Canada are owned by telephone companies sets it apart from the vast majority of other countries in the world. The CRTC, backstopped in recent years by the Competition Bureau, has begun to address this condition, one that just a few years earlier it had given its full blessing to. That about face, however, has provoked a ferocious backlash from the “cultural industries communities” and the incumbent telecoms-TV operators.
These two groups are uneasy bedfellows but for now they share an interest in rolling back the regulatory tide. They generally want to keep things the way they have been for the last half-century. The BDU-centric model of TV suits them just fine, and to the extent that the internet and mobile phones are given any thought at all, they are just a new revenue stream, and a means by which income can be diverted to support Canadian content. As I have said in another report, we need to think of the network media ecology in terms of Lego building blocks, in which competitors, newcomers and people can pick, choose and snap together various elements of the whole as they see fit, versus the “systems” view and its long legacy of “end-to-end”, and top-down control (see here).
What could be easier, for instance, the “cultural industries communities” say, than to apply a “small tax” on smart phones and people’s internet service to replenish the assortment of cultural production funds that now exist across an equally wide variety of media, from TV, to music, to videogames, film, and so on? And why not “zero-rate” CanCon while applying data caps to foreign content and everything else people do with their mobile phones and internet connections, if that tilts the field in Canadian producers’ favour? Thankfully, both options have been spurned so far.
From this view, that the telcos own all of the biggest commercial TV services in the country passes by without comment. Data caps are not seen as artificial constraints on people’s ability to communicate and do as they please with the connectivity (the bandwidth) at their disposal, but rather something to be skewed in ways that support the “cultural production community”—much like cable networks went from being the foundation of “wired cities” in the 1960s and 1970s to become the nucleus of a BDU-centric “TV System”, and its spin-off effects on arts and cultural communities across the country. The culture and arts part, and even the TV part, are all just fine, in my view, but the means to get there being promoted by dominant interests are twisted, and the idea that we should think about things in terms of “a system” closes off more open possibilities before the discussion even begins.
The “Big 5” — Bell, Rogers, TELUS, Shaw and Quebecor – and their supporters amongst consultants, hired experts, think tanks and many journalists are probably the most influential participants in this ongoing battle over the network media ecology. To their way of thinking, who cares that Canada stands in a league unto its own in the extent to which telephone and internet companies own all the major TV services in the country when even the biggest Canadian companies are little more than lightweights thrown into battle with massively capitalized and unregulated global internet behemoths (Apple, Google, Facebook and Netflix)—a digital free for all of global proportions that is now playing out in Canada’s own backyard. It is not the broadcasting system we need to worry about, they and their hired guns assert, but the digital ecosystem. The best thing to do in the face of these daunting realities is to let the market rip, they assert.
That the current battle is as intense as it is, highlights the scale of the interests at stake. Sorting through these competing interests without losing sight of the myriad of public voices who have something to say is vital. So, too, is having a long-term, systematic body of evidence, set against a background of history, experience and scholarly independence, critical. That is what this report, and the CMCR Project, aims to achieve. We hope that you find it helpful.
[1] Thanks to Sabrina Wilkinson, an MA student at the School of Journalism and Communication at Carleton University, whose research for her MA thesis led me to several of these examples and sources.
[1] The small difference between Canada and US might be attributable to the lower take up of Netflix by Francophones. For further notes on the method used to arrive at this estimate, see the Netflix entry for 2016 in the “Top 20 w/ Telecoms” worksheet in the Excel Workbook. The gap between the figure reported here and by the CRTC would not likely be filled either by including Amazon Prime or SportsNet, especially because the former did not launch service in Canada until the very end of 2016
[1] In contemporary parlance, the concept of “net neutrality” often serves as shorthand for core principles of common carriage.
[1] The best expression of such calls is probably a report prepared by Peter Miller (2015 for ACTRA, the Canadian Media Guild, the Directors Guild of Canada, Friends of Canadian Broadcasting, Unifor): Canadian Television 2020: Technological and Regulatory Impacts. The report’s ideas were once again put on the public record in the Canadian Content in a Digital World consultation, but rejected.
[2] I have developed these points at greater length in a report entitled From the BDU-Model of TV to Radical Unbundling: Common Carriage and Culture Policy for the Internet Age (2016).
[3] See, for example, the CRTC’s trilogy of Talk TV decisions in 2015, it’s wholesale roaming investigation (2014-398), wholesale mobile wireless (2015-177) and wholesale wireline (2015-326) decisions, the mobile TV decision (2015-26) and its decision to generally prohibit ISPs and mobile operators from zero-rating services in favour of upholding common carriage principles (2017-104), and the decision by the Liberal Government to reject Bell’s appeal to overturn the CRTC’s decision giving independent ISPs wholesale access to the incumbent telephone and cable companies’ fibre-based networks.